Inspiration
The inspiration for Lotus came from a simple but devastating reality: healthcare costs are the number one cause of personal bankruptcy in America, yet patients have almost no way to see them coming. The worst part is that many of these costs are predictable. Diabetes is associated with kidney disease. High blood pressure is associated with stroke. These progressions happen to millions of people every year, and the medical community has decades of data on it. But patients never see this information until the bill arrives.
We realized that the data to predict healthcare costs already exists in federal databases. Patient records, disease progression patterns, insurance plan structures. It's all there. It's just never been combined in a way that's actually useful to the person paying the bills. We wanted to build something that would take all this scattered data and turn it into something actionable: a map of where your health is headed and what it will actually cost you.
What it does
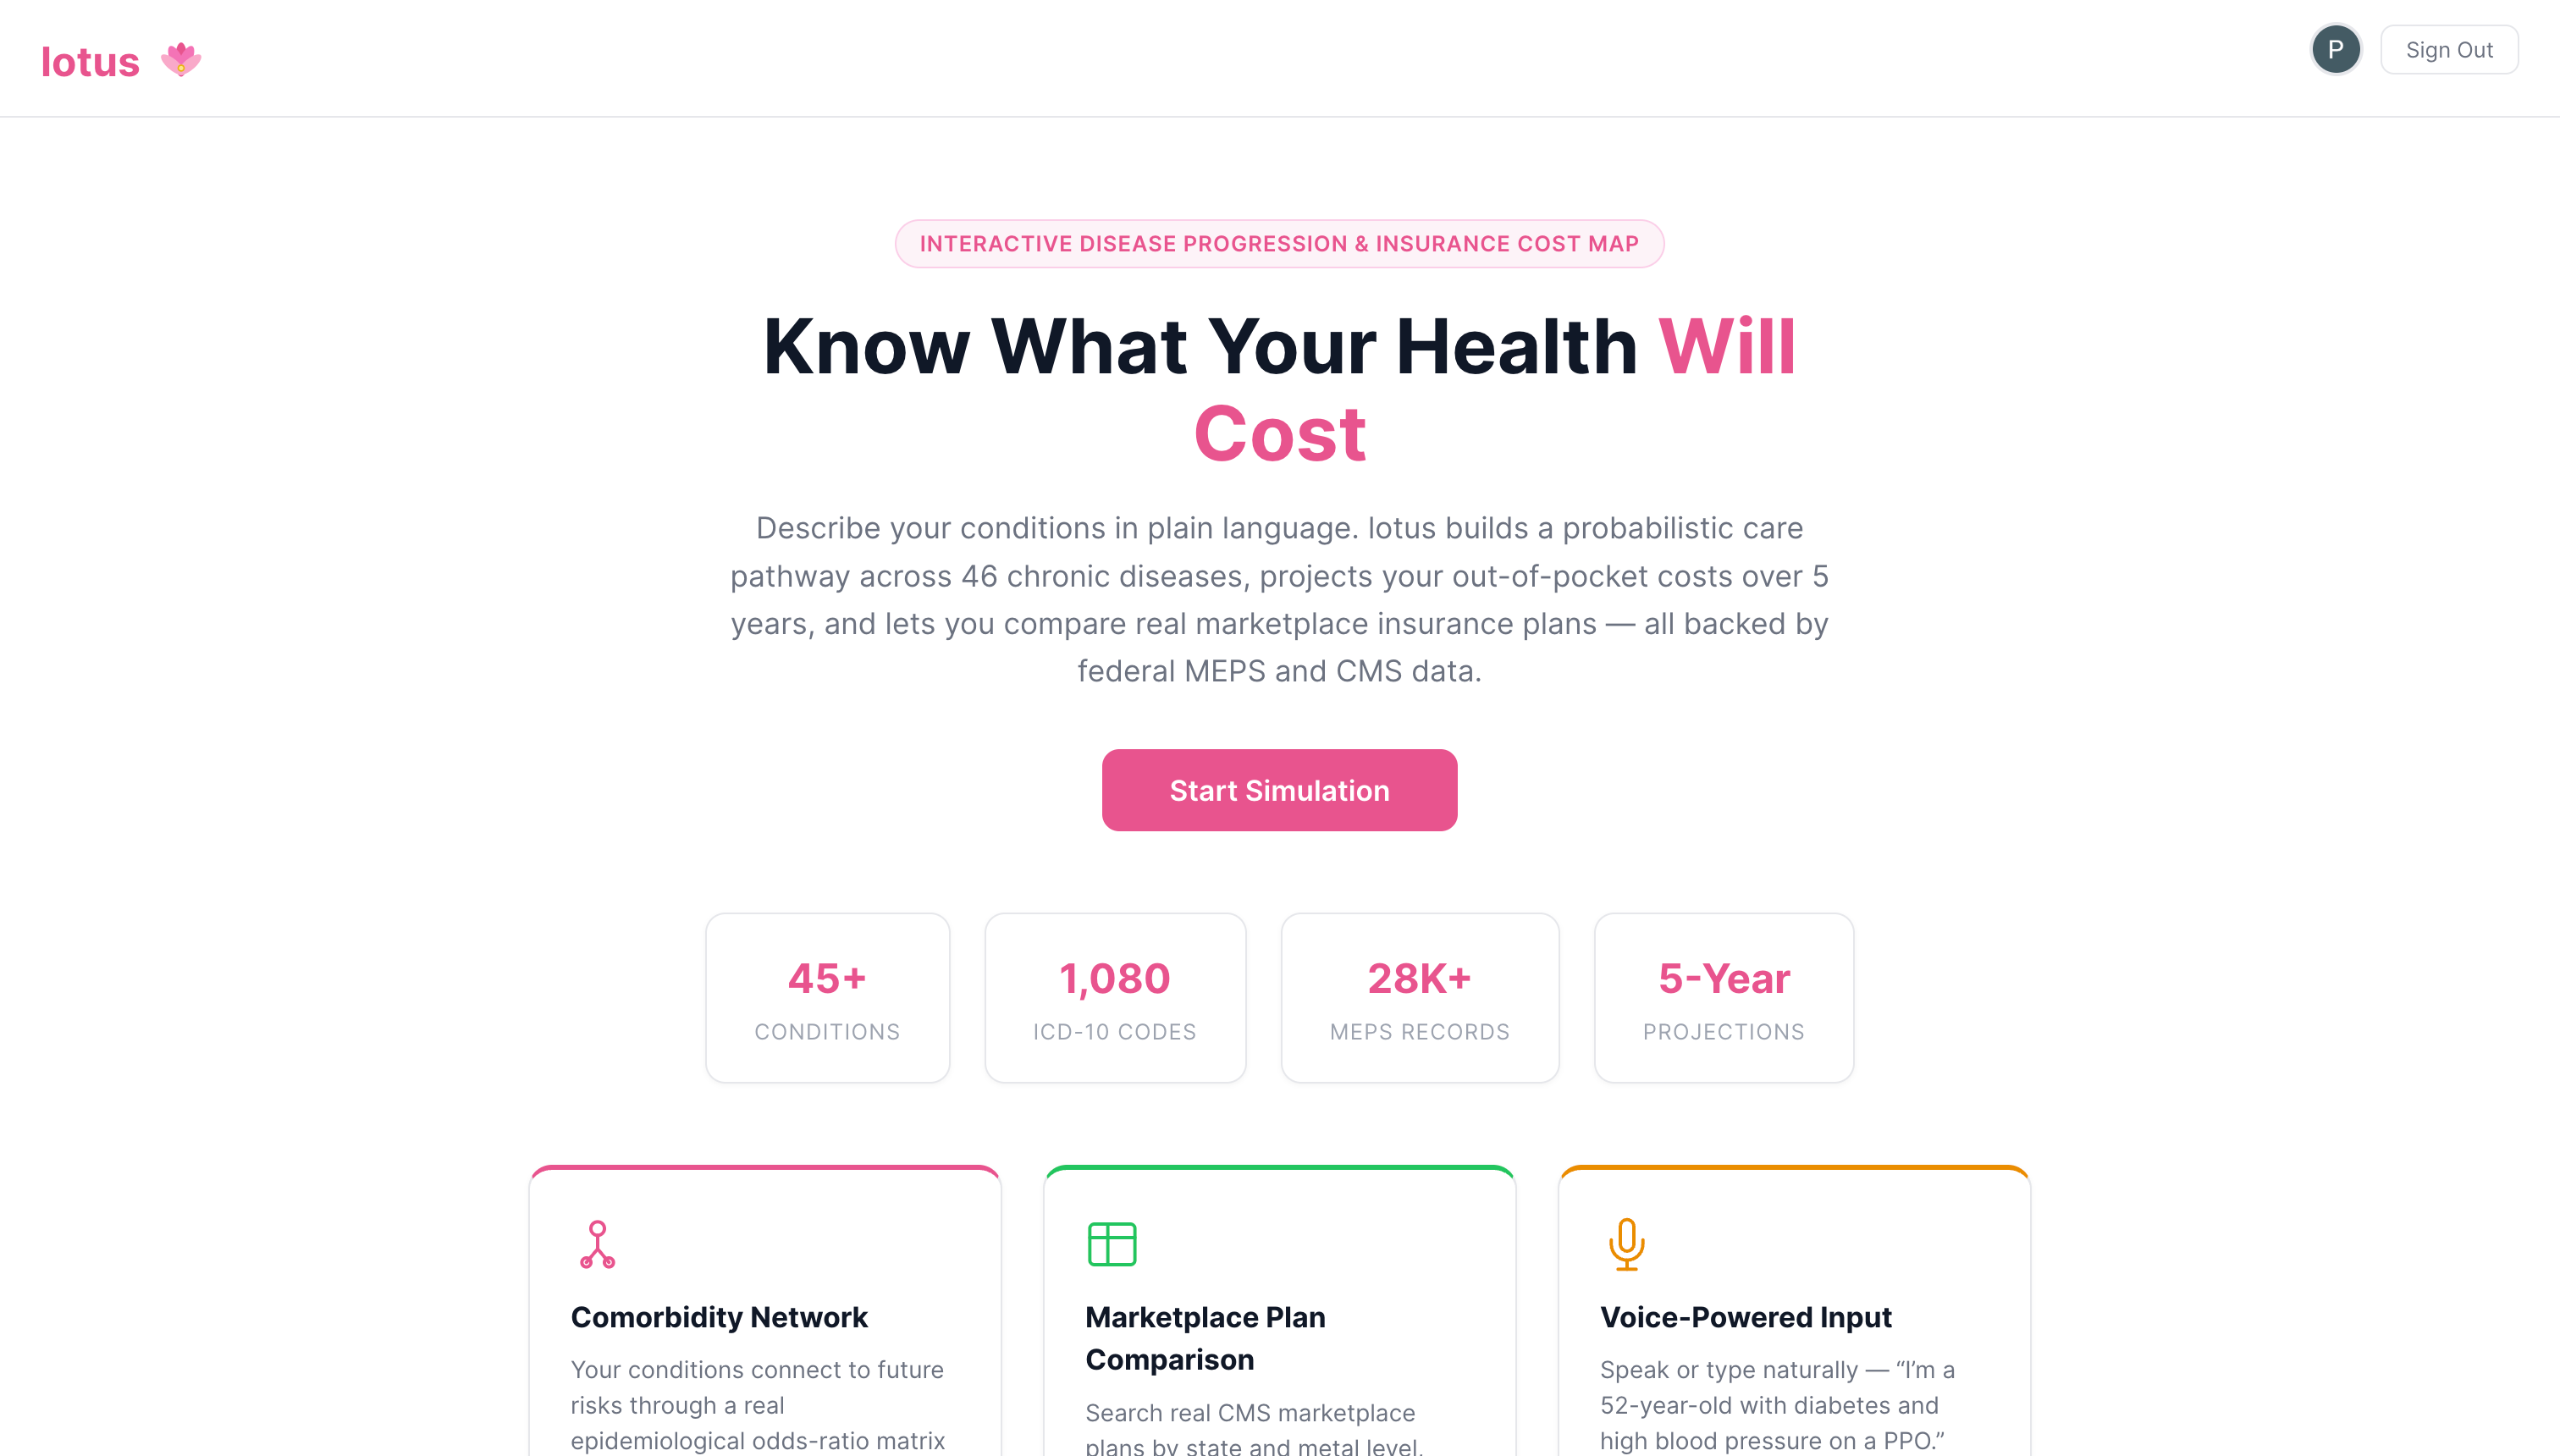
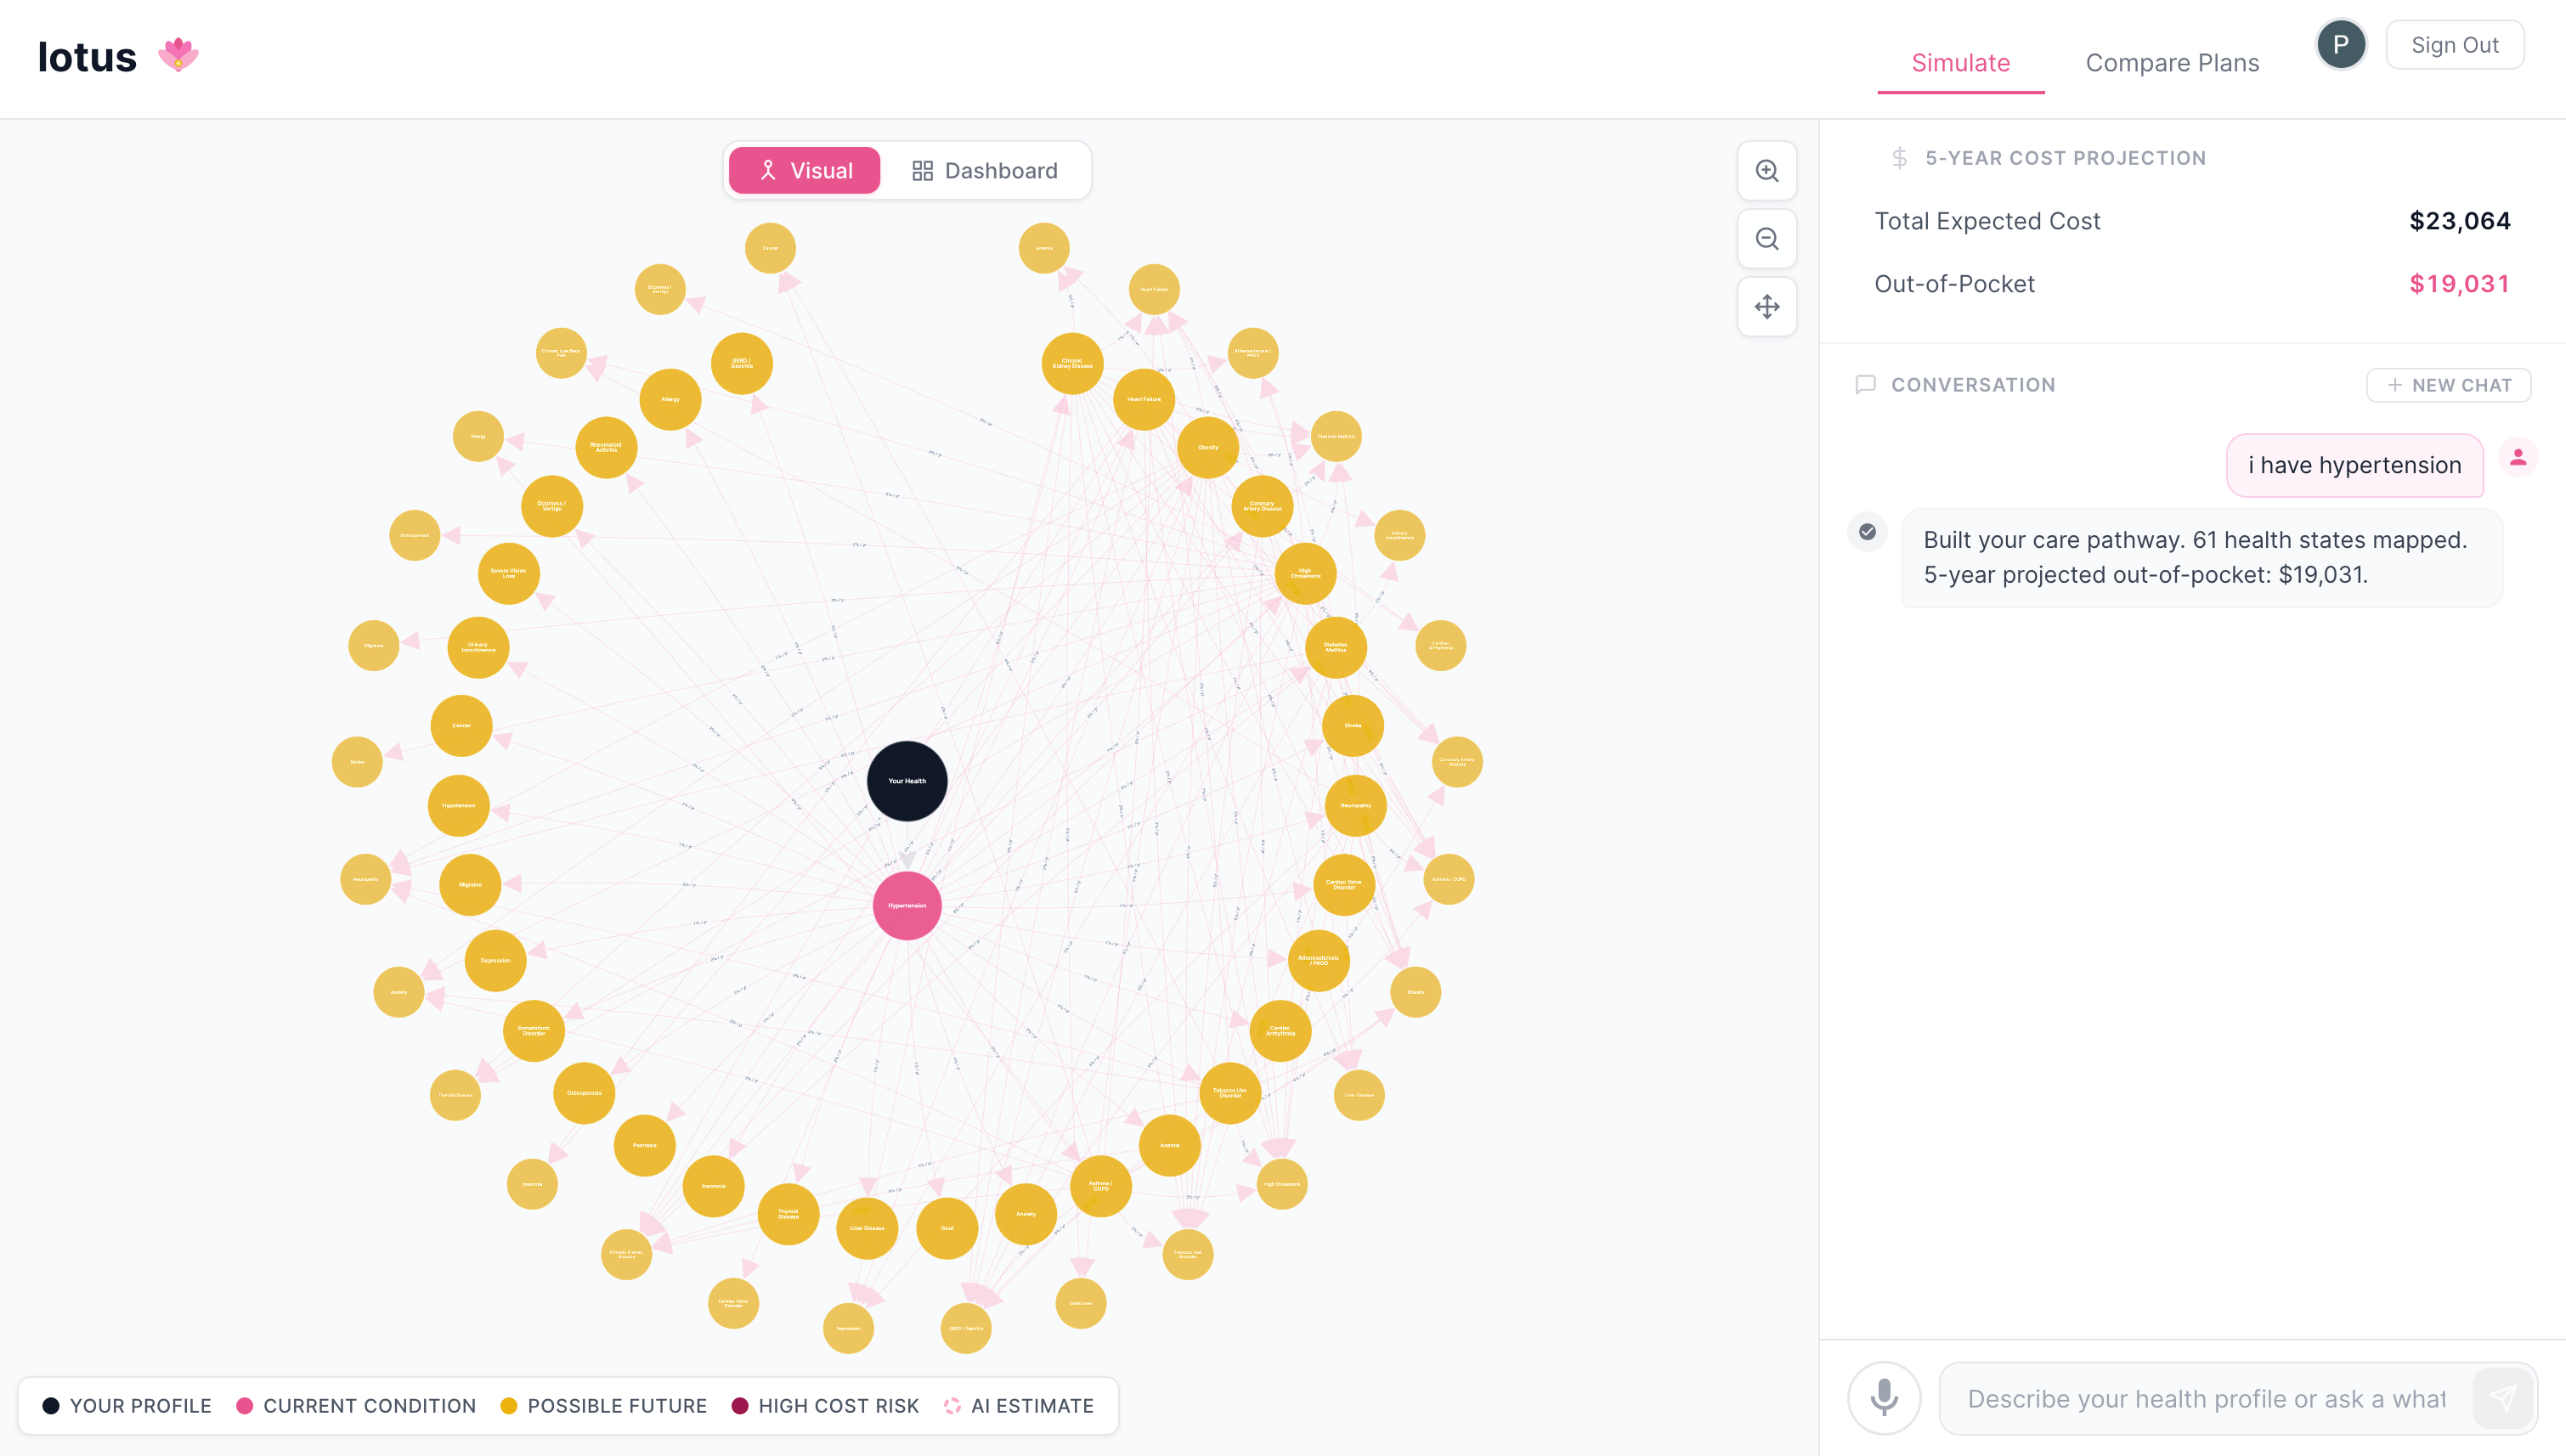
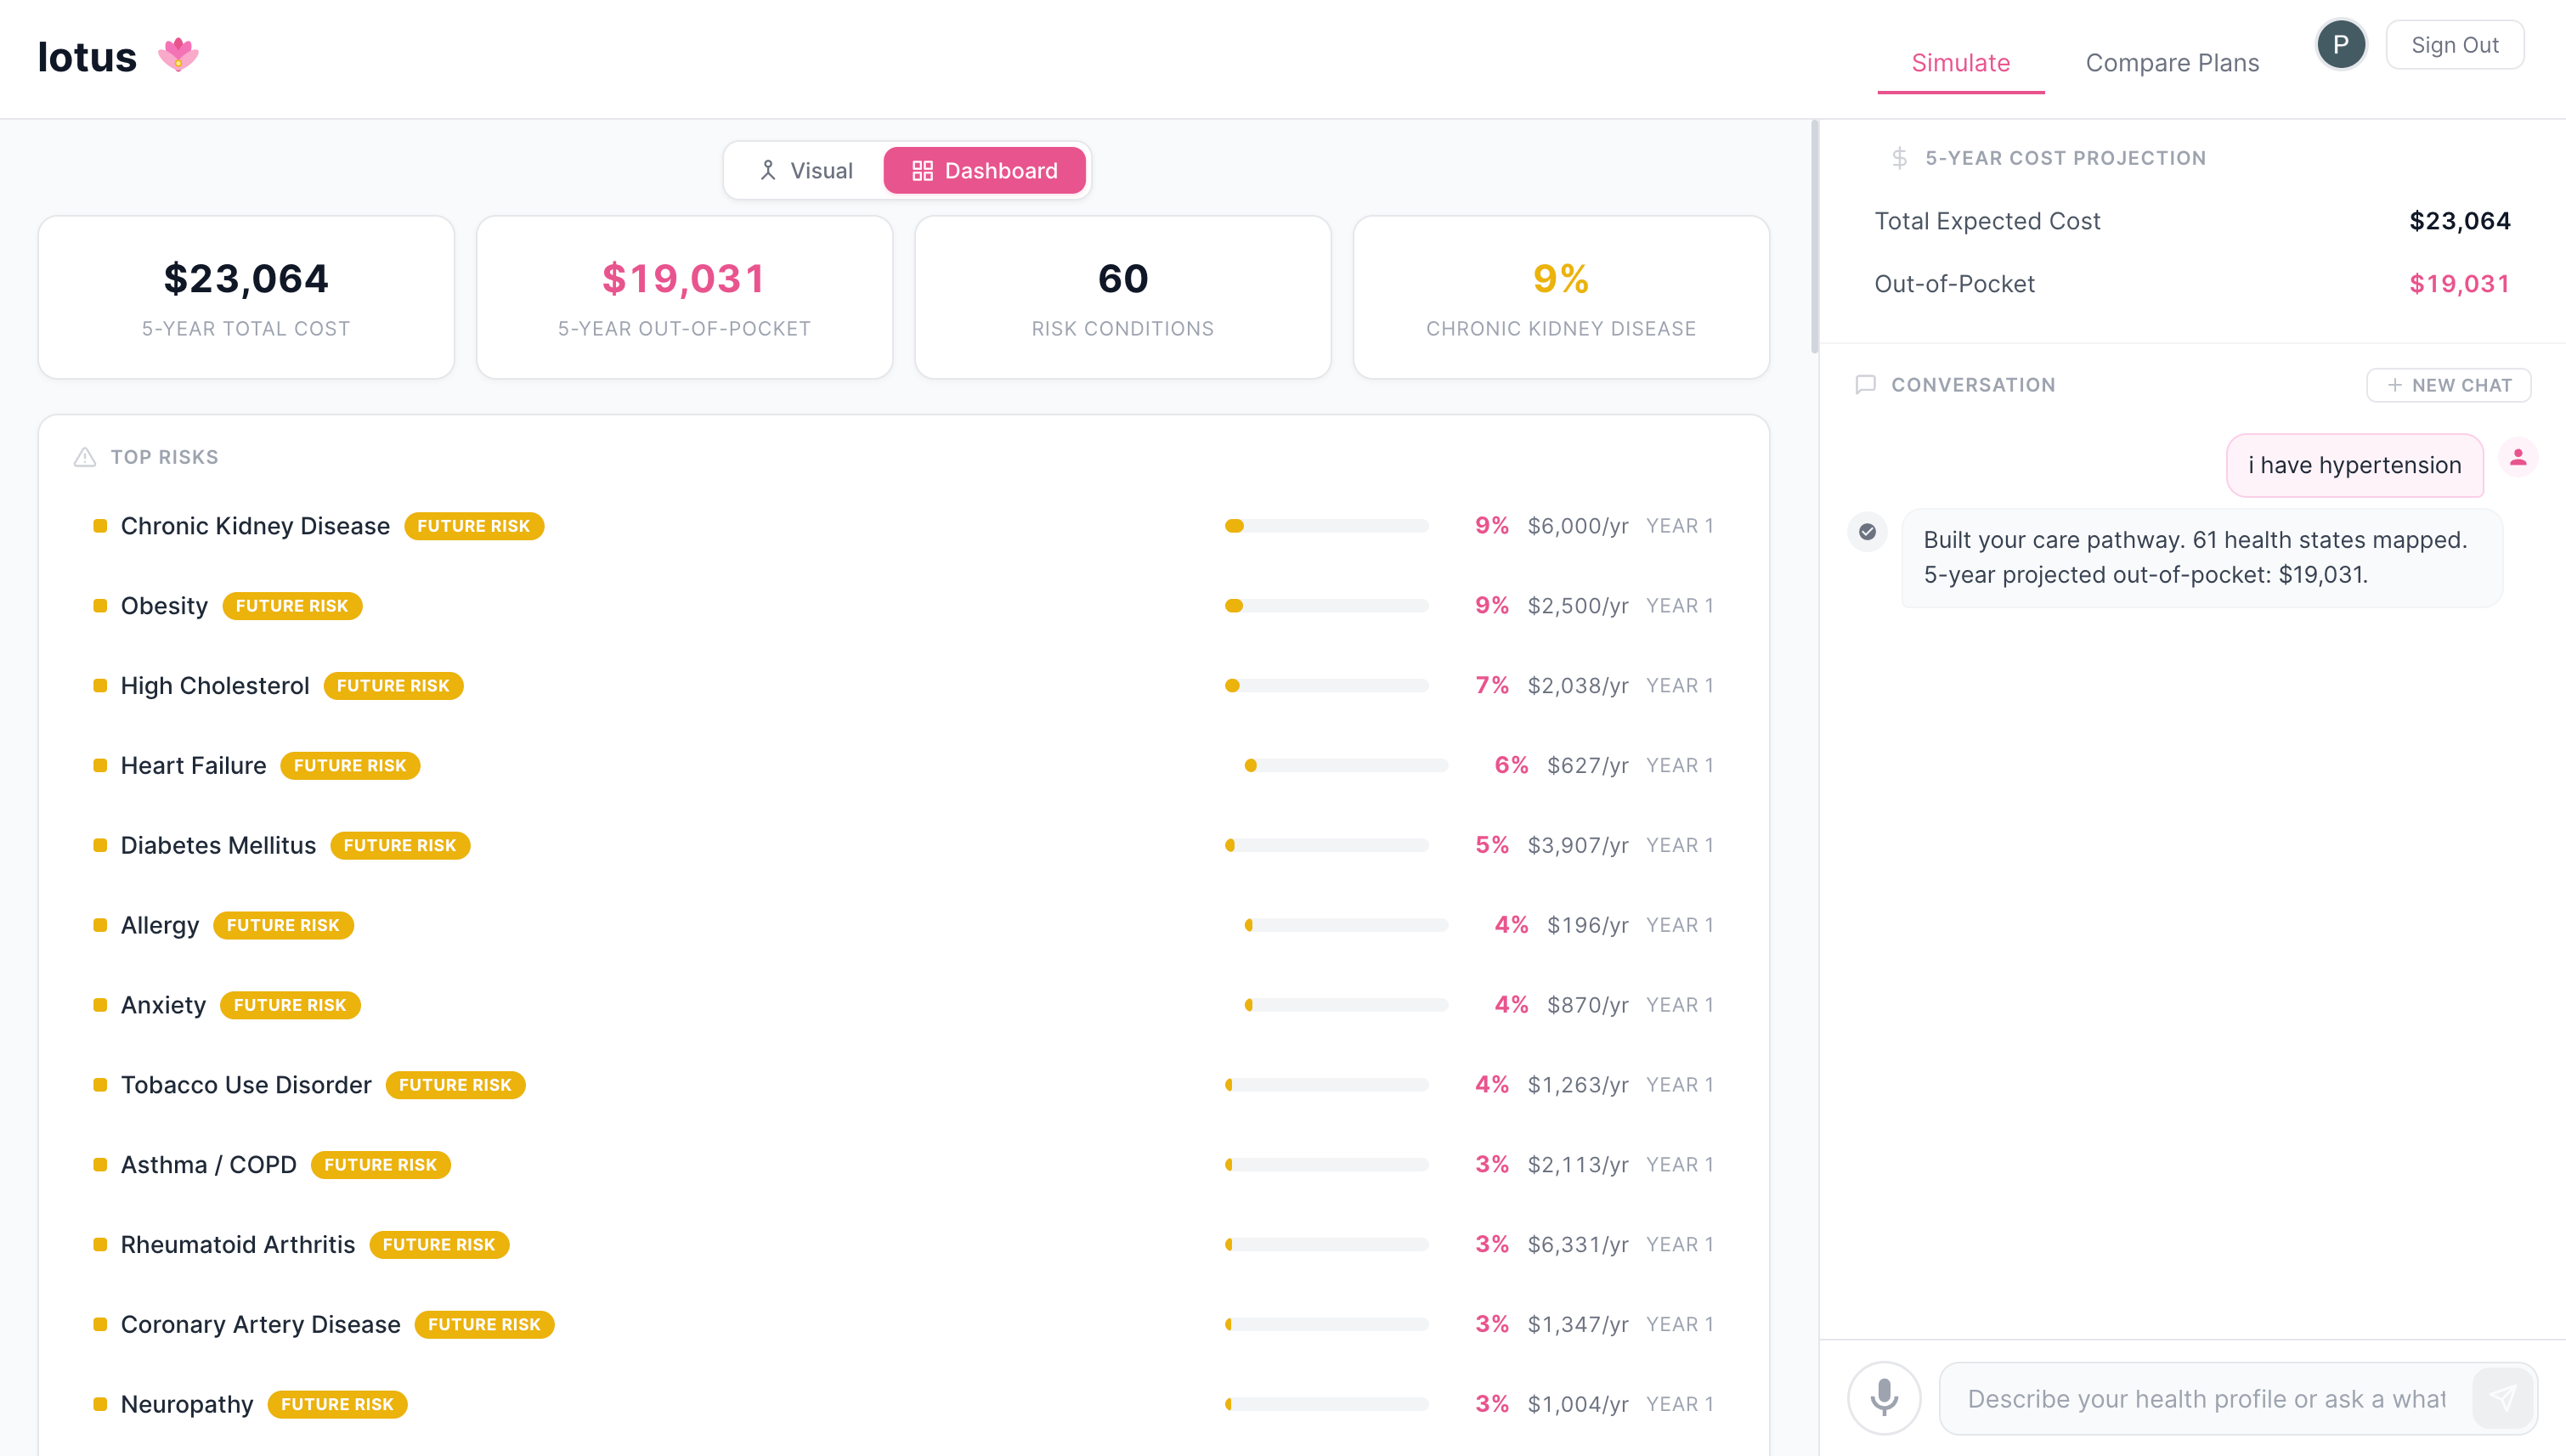
Lotus is an interactive disease progression cost map. You describe your health in plain language, either by voice or text, and Lotus builds a visual pathway showing every disease you might develop over the next five years. Each connection in the graph is weighted by real progression data and each node shows the annual cost based on federal healthcare expenditure records.
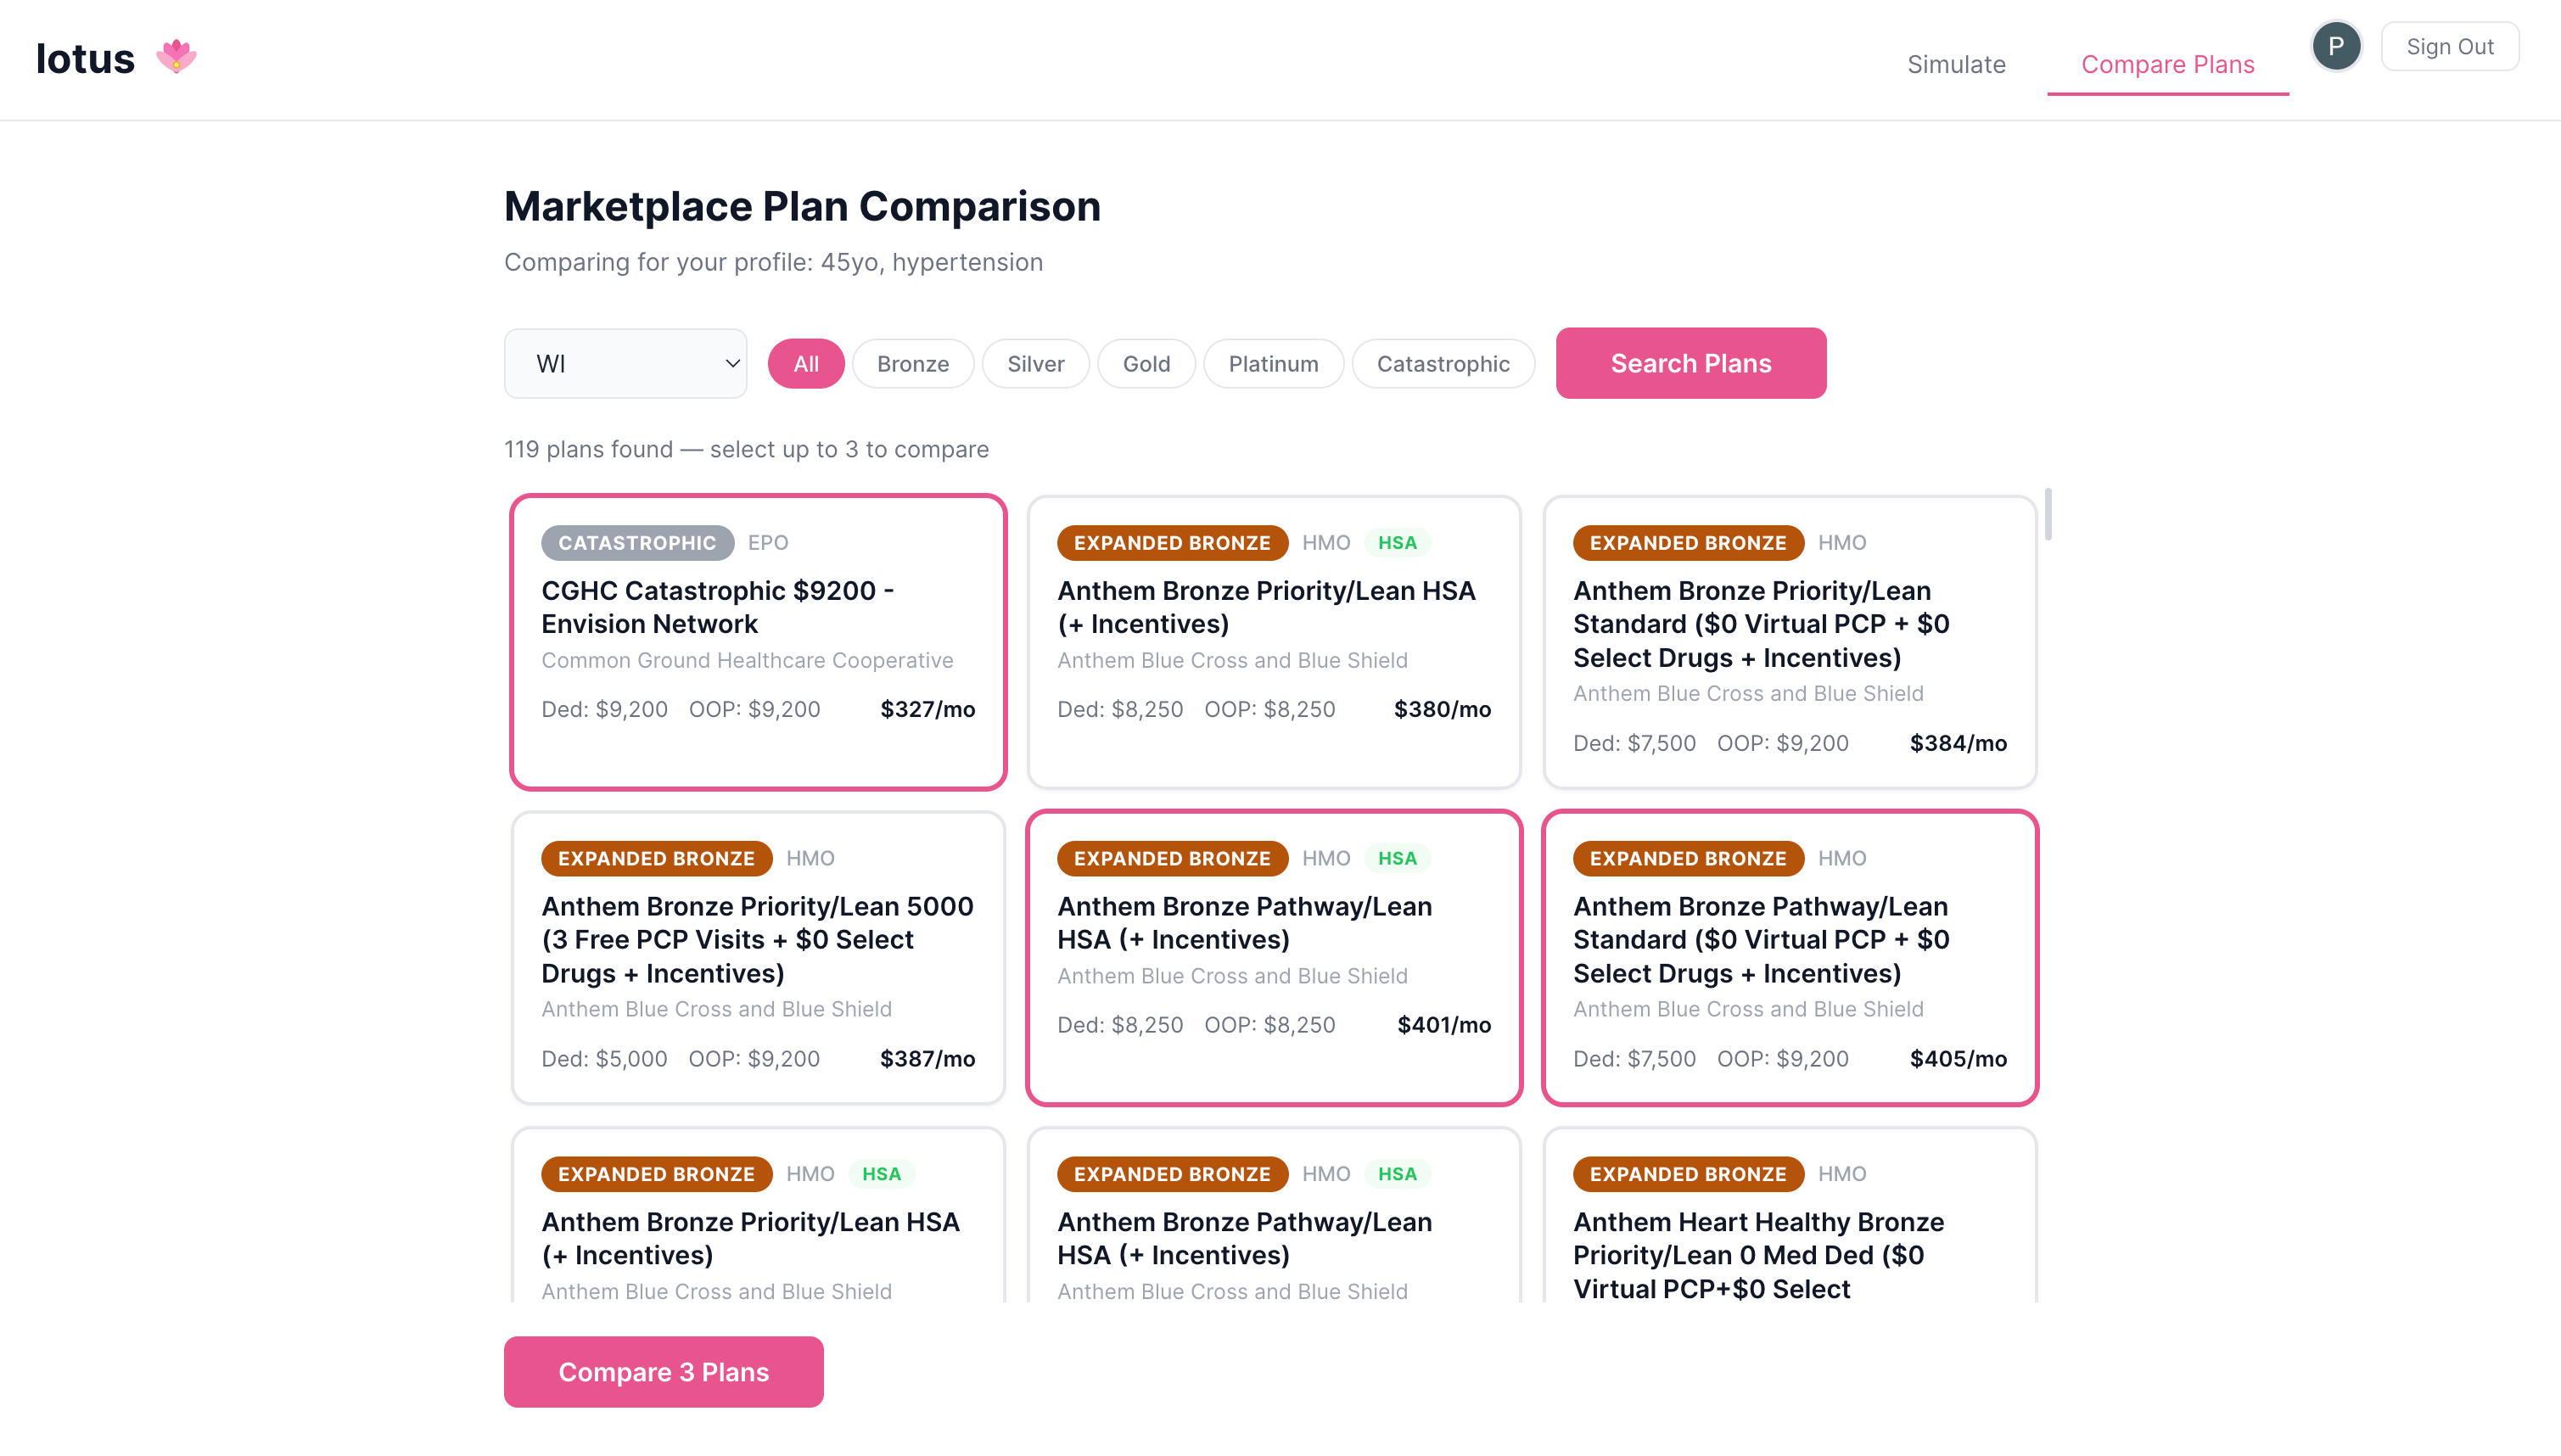
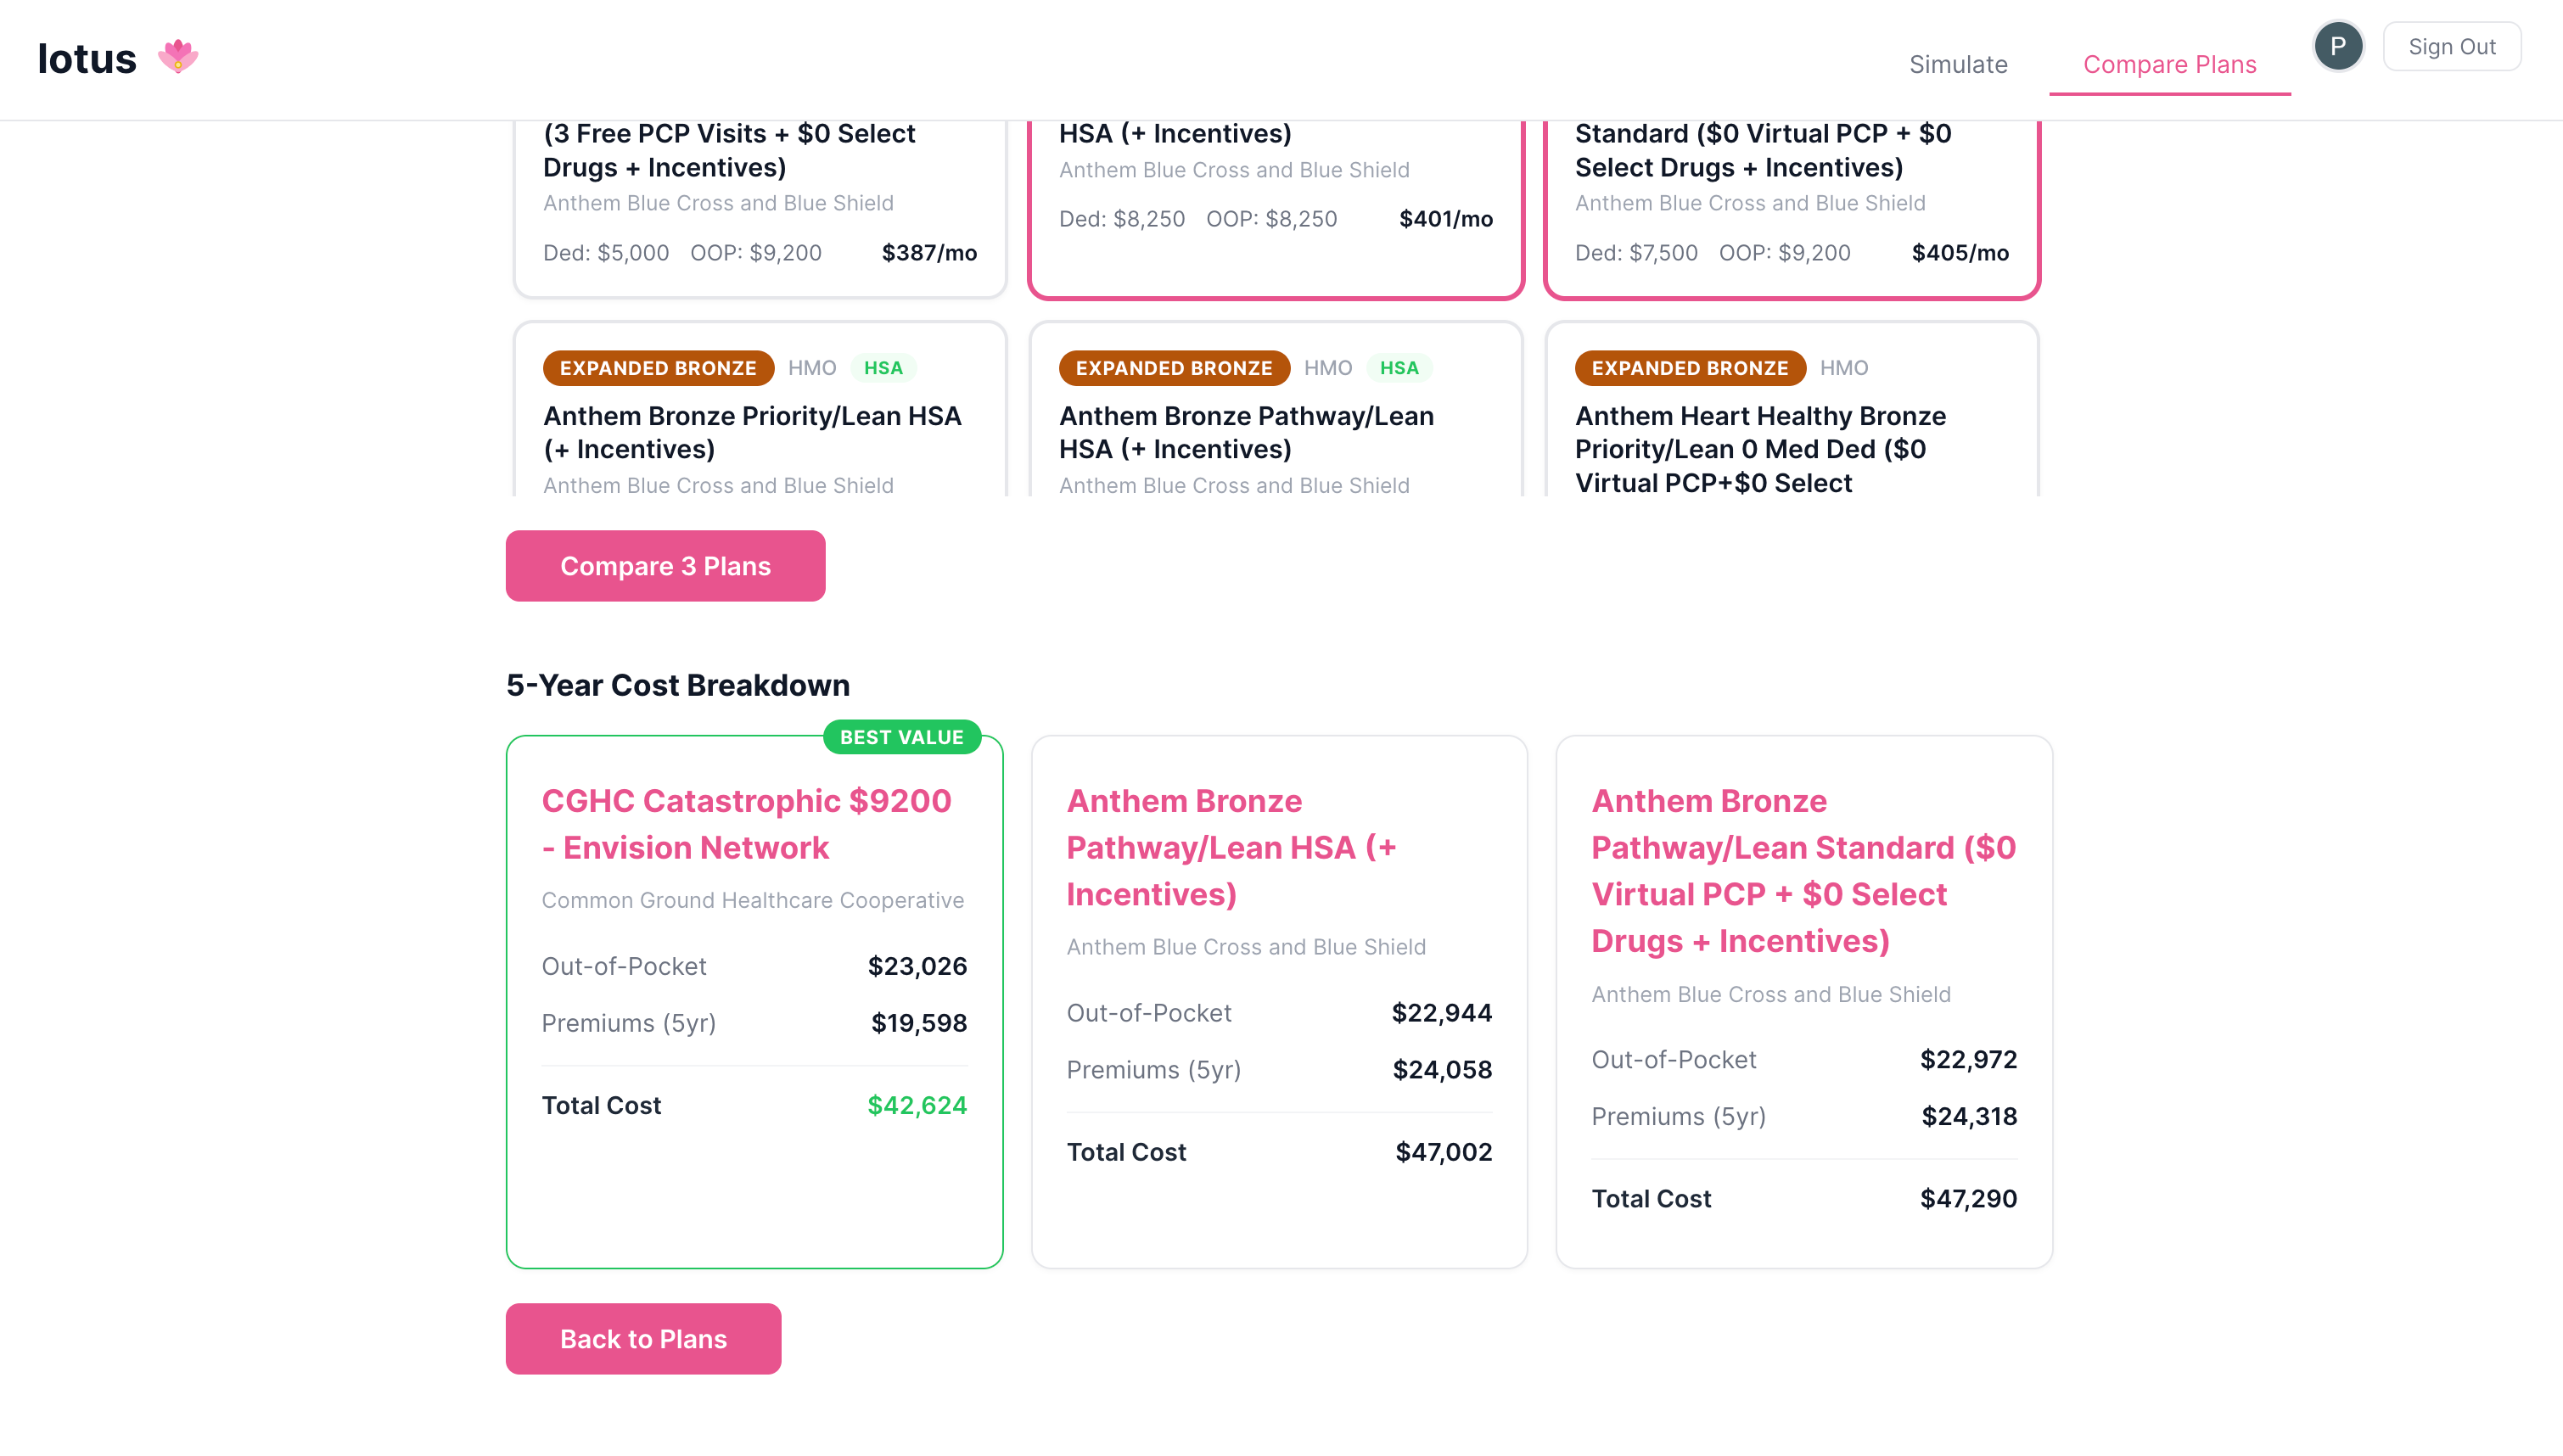
The system also includes insurance plan comparison. You can pull in real marketplace plans from your state and see what your specific health pathway would cost under each one. Same diseases, same progression, different insurance structures. It takes the guesswork out of choosing a health plan.
How we built it
We built Lotus in four main layers: data, simulation, interface, and intelligence. The data layer was the foundation. We pulled from multiple federal sources. The Medical Expenditure Panel Survey gave us real healthcare costs stratified by condition, age, sex, and insurance type. The comorbidity network dataset gave us disease-to-disease progression probabilities based on 1,080 ICD-10 codes across 8.9 million patients. The CMS marketplace files gave us real insurance plan details for every state. The simulation engine sits on top of that data. When you input your conditions, it builds a probabilistic graph by following the comorbidity network edges. Each edge has an odds ratio that tells us how much more likely someone with condition A is to develop condition B. We convert those odds ratios into annual transition probabilities and cap them at reasonable levels to prevent unrealistic spikes. Then we layer in costs from MEPS, adjusting for your specific demographics and insurance plan. The whole simulation runs in under two seconds. The frontend is built with React and Cytoscape.js for the graph visualization. We use a radial layout that puts your current conditions at the center and radiates outward by risk level. Nodes are color-coded by type and cost level. The graph is fully interactive. You can tap on any condition to see its details, likelihood, and cost breakdown. For the intelligence layer, we use Groq's Llama model for natural language parsing and conversation. The LLM's job is to translate what you say into structured data the simulation engine can use, and then translate simulation results back into plain language. Critically, the LLM never invents numbers. All costs and probabilities come from the data. The backend is FastAPI running on Python with async calls to keep everything responsive. We use Supabase for authentication and session management.
Challenges we ran into
One major challenge we faced was the lack of substantive data. Initially, we thought we could use the Medical Expenditure Panel Survey (MEPS) for everything, both costs and disease progressions. But MEPS is a cross-sectional dataset. It tells you who has what conditions in a given year, but it doesn't tell you how diseases progress over time. We spent days trying to extract progression rates from MEPS before realizing it just wasn't designed for that. After careful scouring, we were finally able to find the perfect dataset: the comorbidity network from a Nature Scientific Data paper published in February 2025. It contains pre-computed disease-to-disease odds ratios from 45 million hospital stays across 17 years. The data was split across 96 separate files stratified by age and sex. We had to write scripts to merge them all into a single unified network while preserving the statistical significance filters.
Accomplishments that we're proud of
We're proud that we built something genuinely useful, not just technically impressive. This isn't a toy demo. The cost numbers are real. The disease progressions are real. The insurance plans are real. A patient could actually use this to make better decisions about their health and their coverage. We're proud of the data foundation. Every number in Lotus is traceable to a federal dataset or a peer-reviewed study. We resisted the temptation to have the LLM fill in gaps with plausible-sounding numbers. If we don't have data for something, we fall back to broader averages.
What we learned
We learned that LLMs are great interfaces but terrible calculators. Using Groq to parse "I have diabetes and high blood pressure" into structured condition codes worked perfectly. Trying to have it estimate costs or probabilities was a disaster. The hybrid approach, where the LLM handles language and the simulation engine handles math, was the right architecture.
What's next for Lotus
The immediate next step is expanding the disease intelligence network. Right now we're working with 1,080 ICD-10 codes from the comorbidity dataset. We want to incorporate additional comorbidity networks from other registries, like the Danish Disease Trajectory Browser with 1,777 diseases across 7.2 million patients, and combine them to create a more comprehensive progression model. The goal is to cover rare diseases and cancer progressions that are underrepresented in our current data, and to improve accuracy by cross-validating patterns across multiple population datasets.
Built With
- cytoscape.js
- deepgram
- fastapi
- google-gmail-oauth
- groq
- react
- supabase
- vite


Log in or sign up for Devpost to join the conversation.