Inspiration
A control system can reach its target and still perform poorly along the way. Overshoot, oscillations, slow settling and steady-state error can affect process performance, yet these characteristics are not always easy to interpret from raw measurements alone.
We built LoopScope to make control-system response analysis clearer, more accessible and easier to understand.
What it does
LoopScope is a browser-based control-system response analysis and performance diagnostics tool.
Users can upload a CSV file containing time, setpoint and measured process values, or load the included sample dataset.
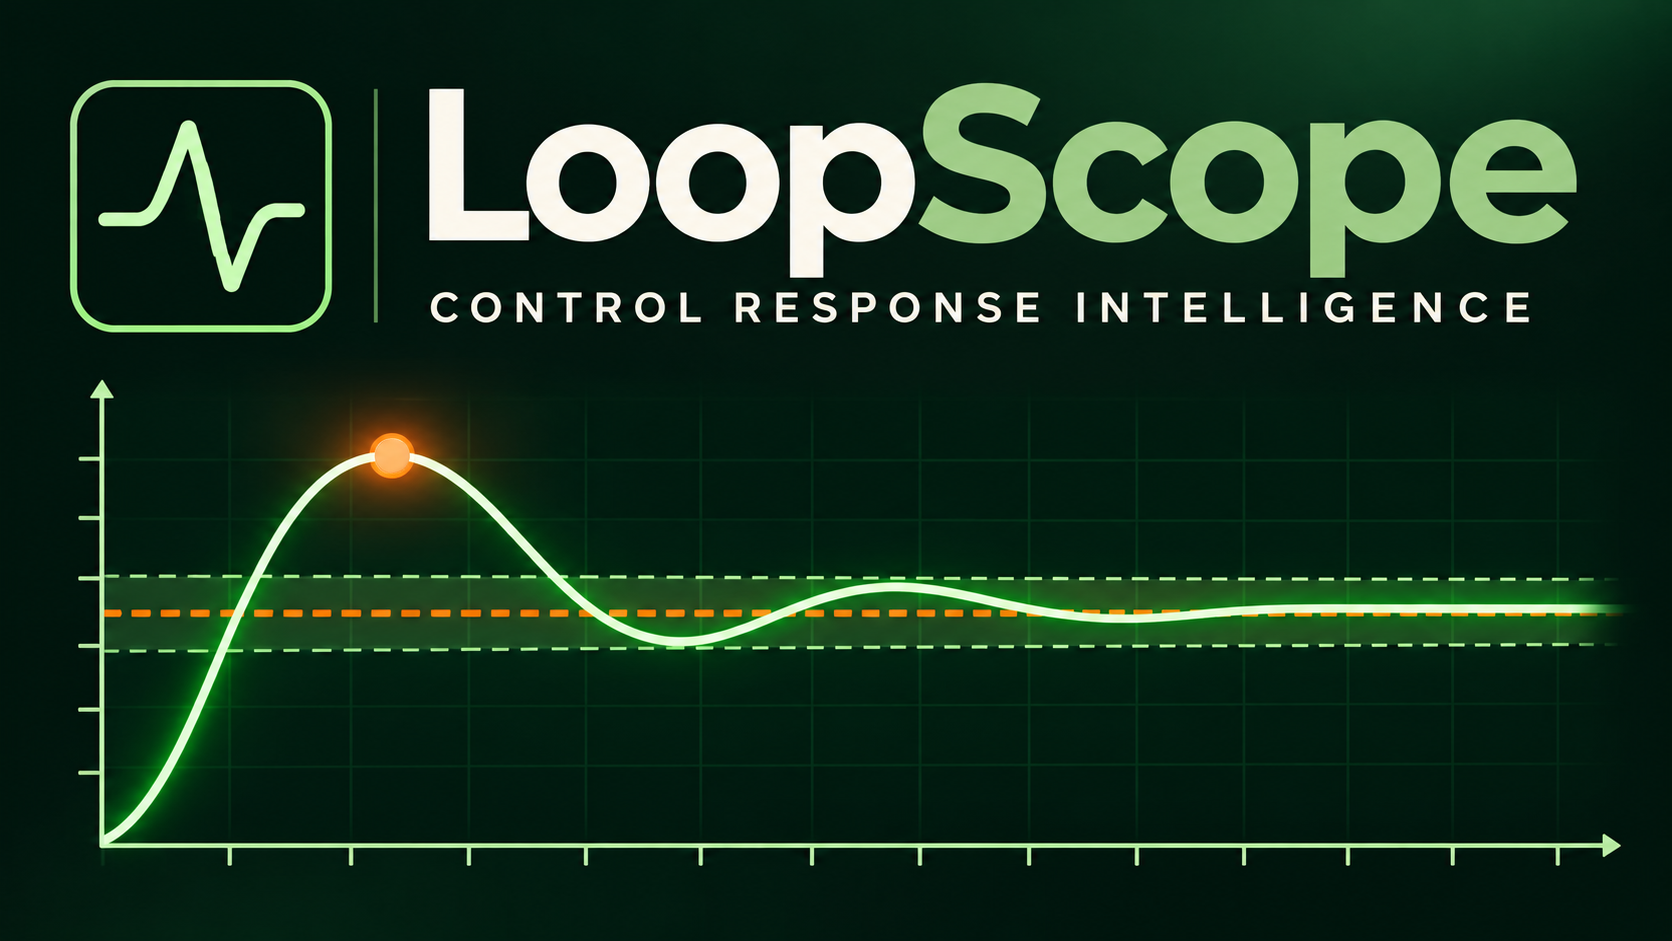
LoopScope calculates and visualizes key response characteristics:
- Peak response: The highest measured value after the step.
- Overshoot: How far the response exceeds the target.
- Settling time: How long the response takes to remain within the defined tolerance band.
- Steady-state error: The difference between the target and the mean of the final measurement window.
The application also provides a response graph, rule-based diagnostic findings, source data inspection and CSV export.
How we built it
LoopScope was developed using React, TypeScript and Vite, with JavaScript and CSS for application logic and presentation.
The application processes uploaded measurements locally in the browser. Its analysis engine calculates response characteristics and presents them alongside the measured response curve, setpoint and settling band.
This approach provides an integrated workflow from data import to visual analysis and report export.
Challenges we faced
One important challenge was translating control-system concepts into useful calculations and presenting the results in a way that is understandable without losing their engineering meaning.
We also needed to ensure that importing data, calculating metrics, displaying the graph and exporting results worked together as one coherent workflow.
What we're proud of
We built a working, publicly accessible prototype that can accept measurement data, calculate response characteristics, visualize system behaviour and present diagnostic observations in one workspace.
We are particularly proud of bringing the numerical analysis and its visual evidence together.
What we learned
We learned that engineering software should do more than display numbers. It should help users understand how those numbers relate to actual system behaviour.
We also learned the importance of transparent calculations, usable visualizations and a reliable end-to-end workflow.
What's next
Future development includes support for multiple setpoint changes, configurable tolerance bands, additional response metrics, comparison of multiple response profiles and more advanced diagnostic methods.
