-
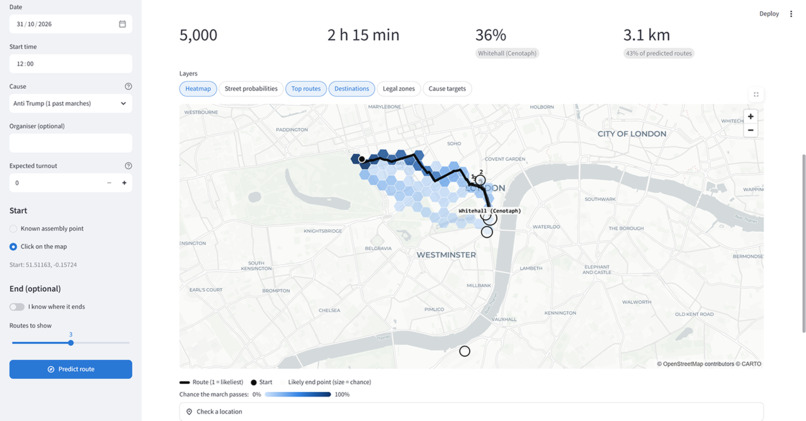
Route Prediction
-
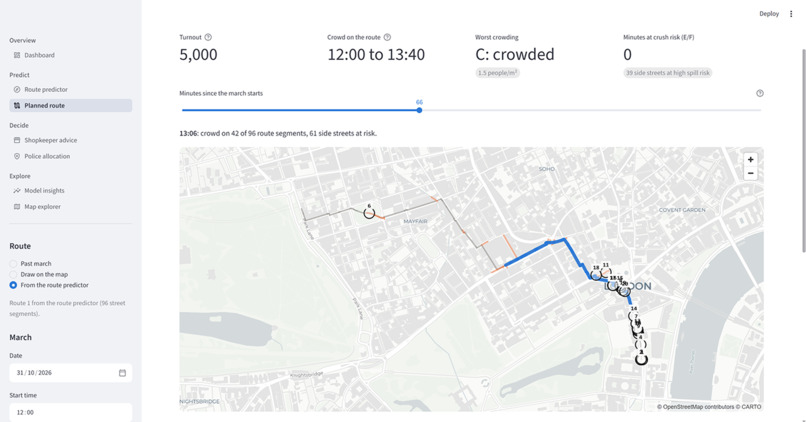
Overspill Calculation
-
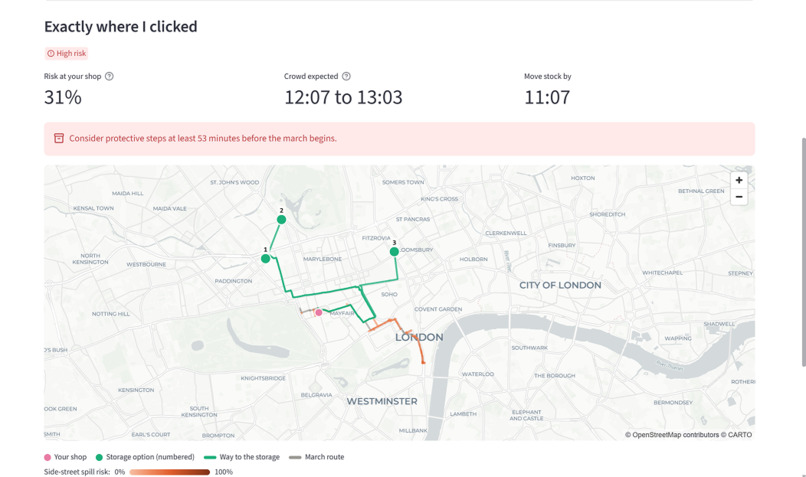
Shop keeper assistance
-
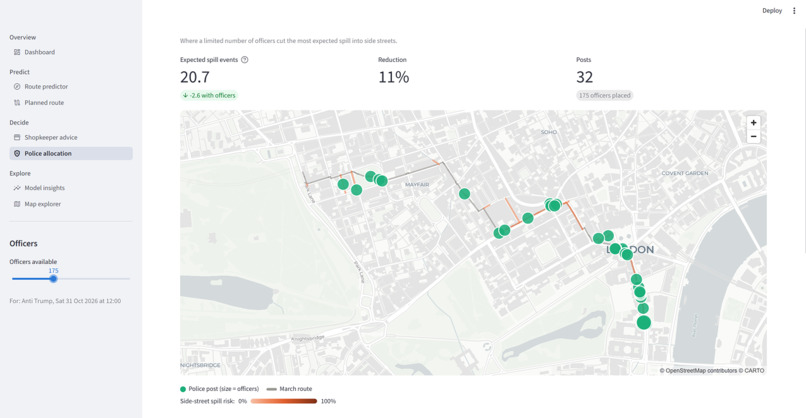
Police Resource Allocation
-
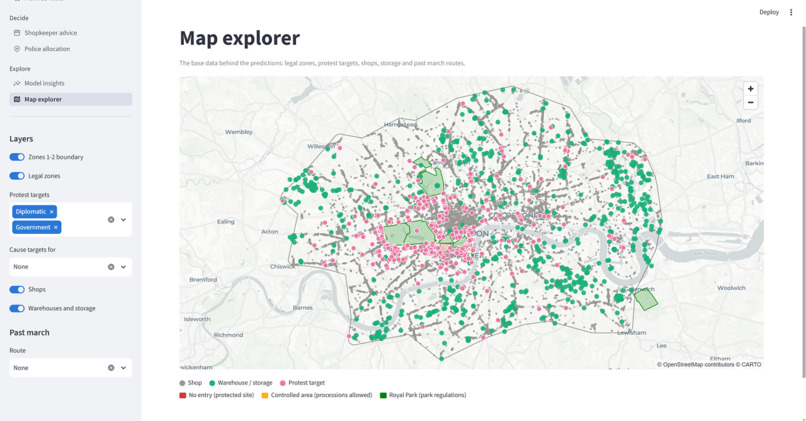
London Data Map
-
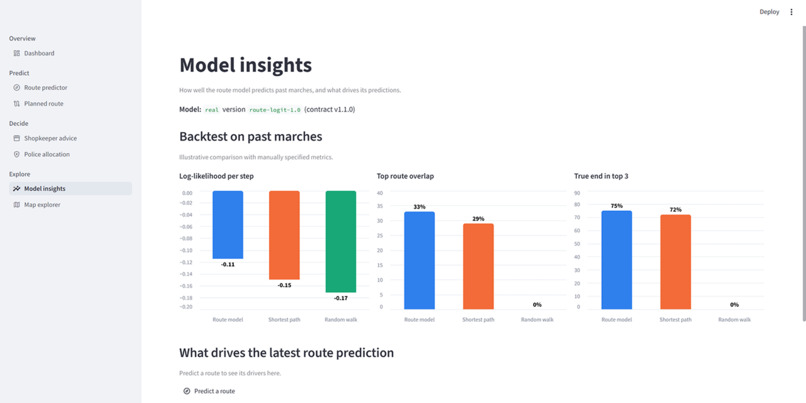
Model Insights
Inspiration
A march route is often decided days before the march, but the people affected rarely see it in time. Organisers announce plans late or change them, police conditions are published at short notice, and some marches never publish a route at all. Three groups pay for that uncertainty:
- Shopkeepers on Oxford Street, Whitehall or Kensington High Street, who lose stock and trade when a crowd arrives unannounced.
- Police planners, who have to place a limited number of officers before they know where pressure will build.
- Residents and commuters, who want to know whether their street, bus or station will be affected.
We wanted to show that public data, combined well, can answer "where will it go?" with honest probabilities rather than a single guess, and then answer "so what should I do?".
What it does
The app has five tools, each answering one question for one user.
| Tool | Question it answers | Output |
|---|---|---|
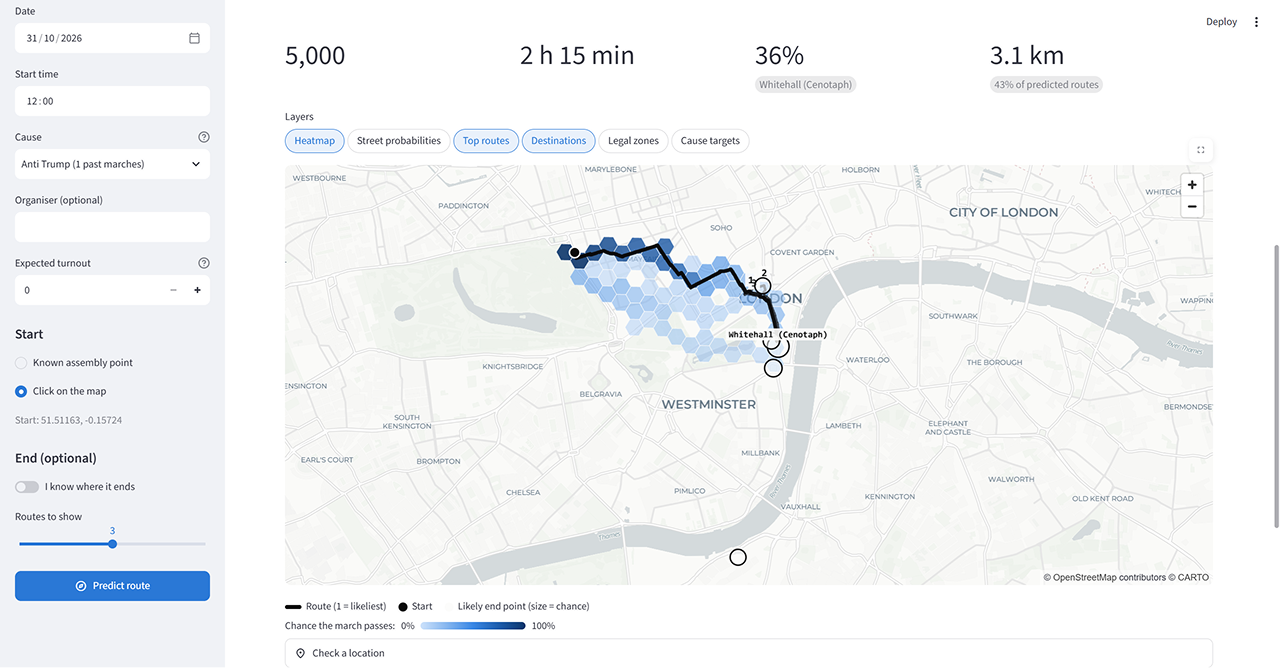
| Route predictor | Where will a march go from its start point? | Probability per street and per 200 m hexagon, the top 5 likeliest routes, likely end points, expected turnout and duration |
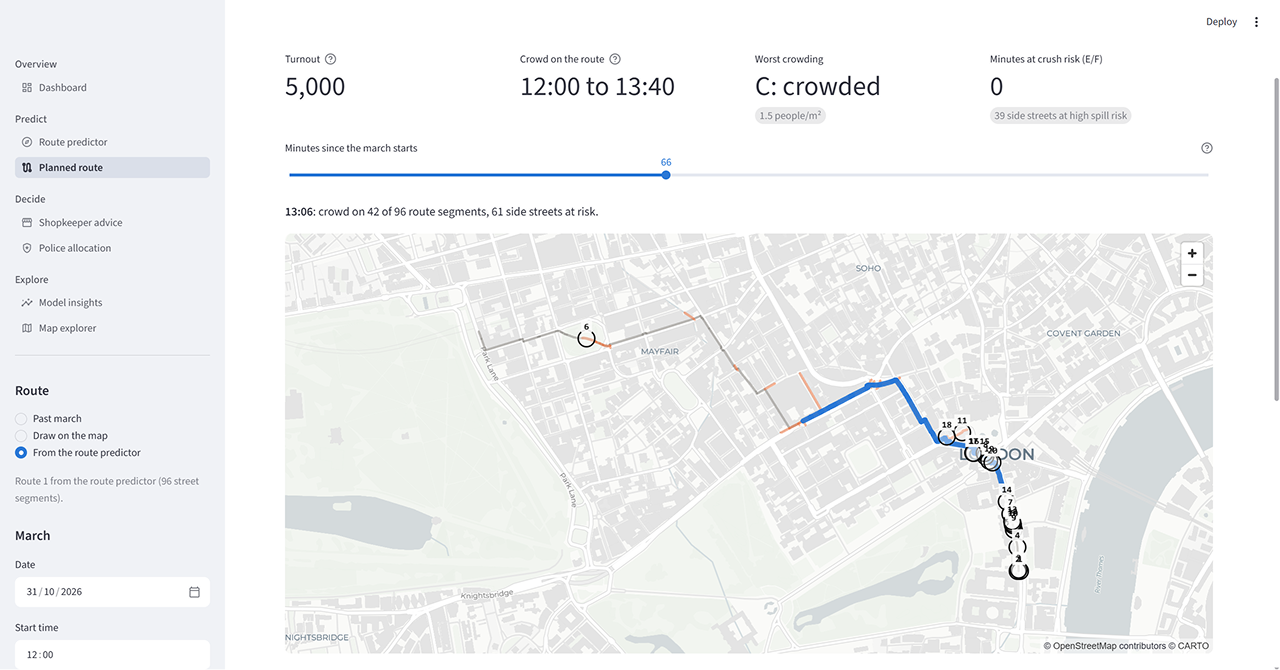
| Planned route | If the route is announced, where will the crowd spill over and when? | Crowd density per street over time, side-street spill risk, numbered hotspots |
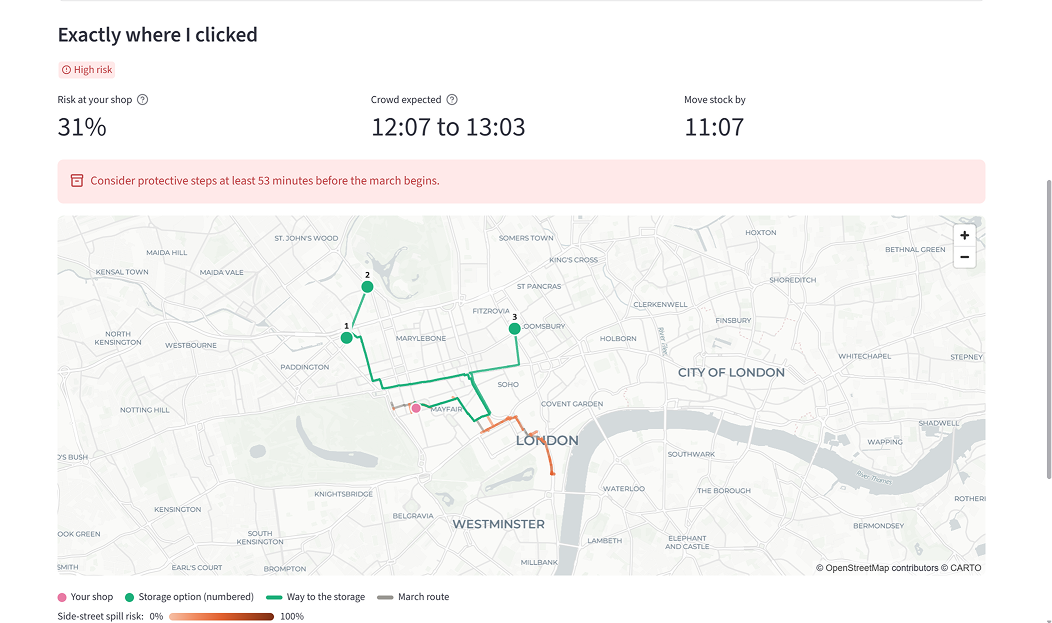
| Shopkeeper advice | Is my shop at risk, when, and where should I move stock? | Risk at the shop, the time window the crowd passes, an act-by time, ranked nearby storage |
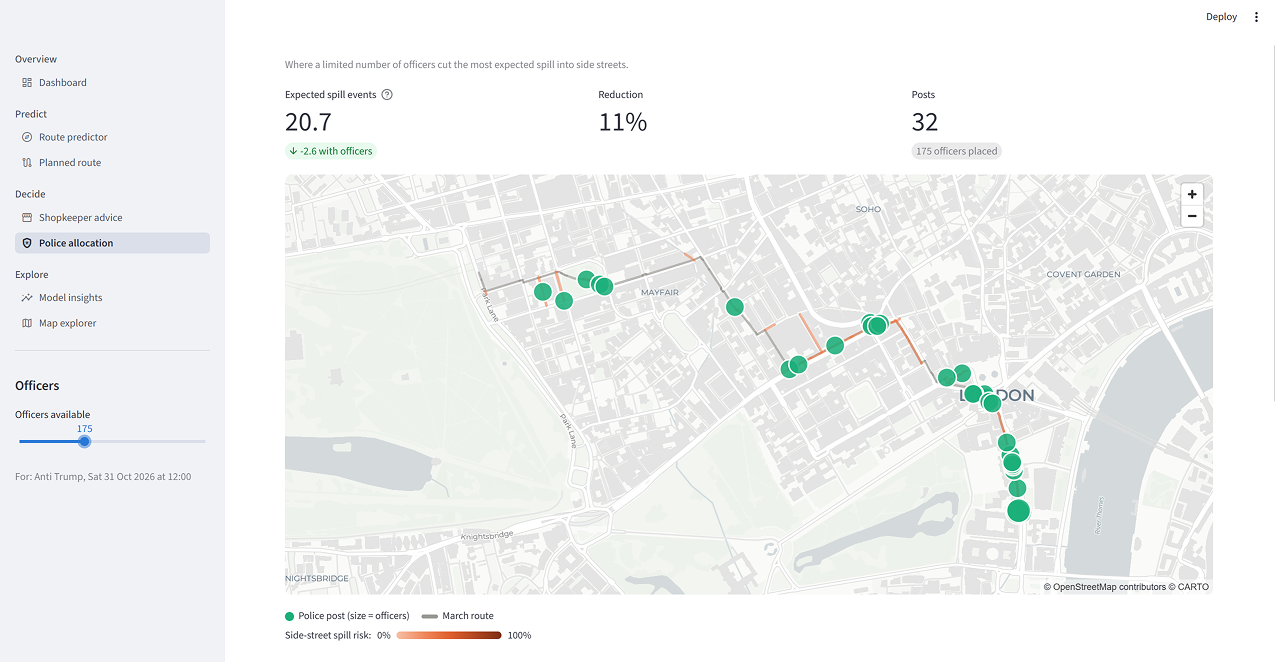
| Police placement | Where do N officers reduce the most risk? | Officer posts on the map and total spill risk before and after |
| Model insights | How good is the model, and why did it predict this? | Backtest against baselines, the drivers of the latest prediction |
Every prediction also shows a Conditions & effects panel. It lists what the model assumed about the day (weather, media attention, weekday, bank holiday, Ramadan, sunset) and what each factor changed. A rainy weekday march shows its turnout going down step by step; a march running into darkness shows its route leaning towards main, lit roads. Each effect is labelled learned from past marches or hand-set assumption, so users can see how far to trust it.
The data
We built one pipeline (python ingest.py) that pulls every source, cleans it and loads it into a single spatial DuckDB database. Each source is there because it changes a prediction or a decision.
| Source | What we take from it | Why it matters |
|---|---|---|
| Published march plans (Met Police notices, Marble Arch security updates, organiser announcements) | Start, waypoints and end of past marches, geocoded and snapped to streets | The labels the route model learns from |
| OpenStreetMap (via OSMnx) | Walk network and main roads inside TfL zones 1 to 2 | The streets a march can choose between |
| Derived street features | Usable width, crowd capacity, betweenness centrality, junction degree, bridges | Wide, central streets attract big marches; narrow ones cause crush risk |
| TfL station zones | Zones 1 to 2 boundary | Keeps the model to central London |
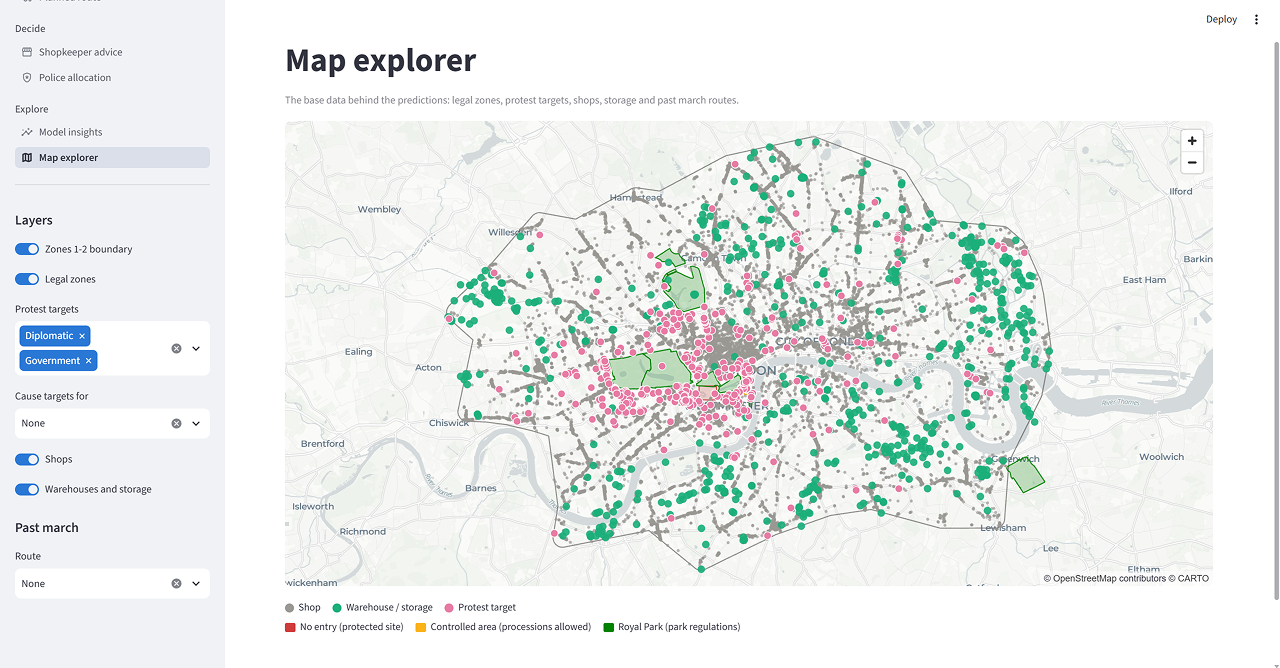
| OSM and Wikidata | Embassies (with country), government buildings, monuments, squares and parks with area, shops, warehouses | Where each cause marches to, rally capacity, who is at risk, where stock can go |
| Legal zones | No-entry sites, the Parliament Square controlled area, Royal Parks | Streets a march legally can't or rarely uses |
| Open-Meteo | Hourly weather: forecast, recorded, or monthly average | Rain and cold reduce turnout; rain may change routes |
| Wikipedia pageviews | Daily views of each cause's articles, before the march only | Media attention spikes predict bigger, more charged marches |
| UK bank holidays, Hijri calendar, sunset times | Weekday, holiday, Ramadan, daylight after the start | Turnout and darkness effects |
| Police.uk, TfL, ACLED | Public-order crime, road disruptions, wider protest events | Context on the map and for planners |
No single source can predict a route. The value comes from joining them on one street graph: a march plan becomes a sequence of street choices, and every choice can be explained by the street's width, the cause's targets, the weather and the day.
How we predict
A march is modelled as a walk through the street network: at every junction it picks the next street. We learn how it picks.
- Route choice: a conditional logit model. At each junction, the probability of taking street b from street a is a softmax over the candidate streets, using 12 features of each candidate: progress towards the destination, width, width × turnout, main road, centrality, turn angle, pull of the cause's targets, Royal Park, restricted zone, past use, rain × main road and darkness × main road. Weights are fitted by weighted maximum likelihood with L-BFGS, regularised towards small, sensible priors. Waypoints from published plans count fully; streets we interpolated between them count 0.3.
- Street probabilities: an absorbing Markov chain. The learned turn probabilities form a transition matrix. One sparse linear solve gives the expected number of visits to every street, not a single route. That is the heatmap.
- Top routes: Yen's k-shortest paths on −log(probability), so the top routes are the likeliest paths, each with its share.
- Destinations: candidate end points come from past marches for the same cause and the cause's targets (an embassy, Parliament, Downing Street), weighted by how often they were used.
- Turnout: the median of past marches for the cause, scaled by media attention, rain, cold or heat, a weekday daytime start and bank holidays.
- Overspill: crowd physics. Density on each street = crowd size against street width as the march moves at about 2.5 km/h. Fruin's levels of service (A to F) mark crush risk, and side streets get a spill probability from density, junction degree and nearby targets, raised by a rowdiness score.
$$ P(b \mid a) = \frac{\exp(\theta^\top x(a,b,c,d))}{\sum_{b' \in N(a)} \exp(\theta^\top x(a,b',c,d))} $$
Here x is the feature vector for moving from a to b given the march context c (turnout, rain, darkness, cause) and destination d. Context only matters when it interacts with a street feature, which is why rain, darkness and turnout enter as interactions.
From prediction to decision
A probability map is only useful if it changes what someone does. Each decision tool takes the model's probabilities as input and returns an action.
- Shopkeeper: is my shop at risk, and by when must I act? We take the chance the march passes within 50 m of the shop, and the time window the crowd's head and tail pass it. If the risk is 10% or more, the tool sets a move-stock-by time one hour before the crowd arrives.
- Shopkeeper: where should the stock go? The 15 nearest storage sites (warehouses, self-storage, industrial units from OSM) are scored as closeness × (1 − disruption risk) × floor area. Distance is walked along the street network, and disruption risk comes from the same prediction, so a warehouse on the route scores low.
- Police: where do N officers do the most good? Officers are placed in units of 5. Each unit goes where it removes the most expected spill risk, with diminishing returns per post (risk × e^(−0.05 × officers)). The tool reports total spill risk before and after, so a planner can see what 50 versus 100 officers buys.
- Anyone: check a location. Click any street or hexagon to get its chance of being on the route and a risk level.
The same prediction drives all of them, so the decisions are consistent: the street a shop is warned about is the street the police tool covers.
How we test it
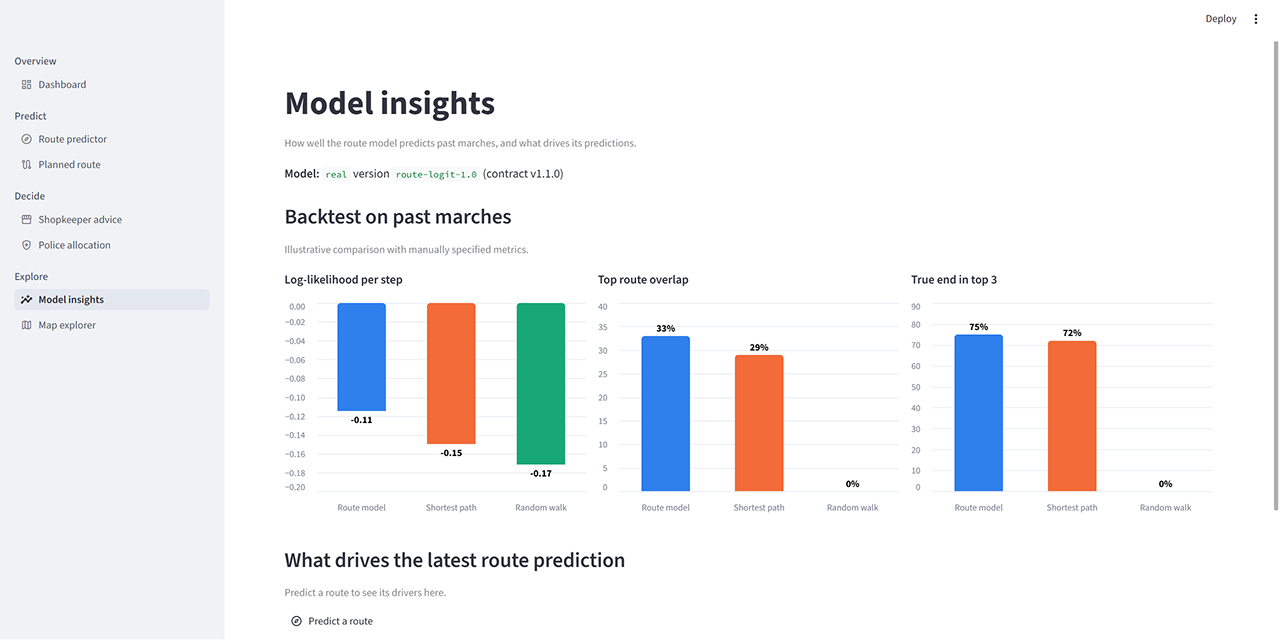
Every training run ends with a leave-one-march-out backtest, and the results are shown in the app, including any metric where the model loses. Each past march is hidden in turn. The model is refitted on the others, with the street-history feature rebuilt so the hidden march never leaks in, and then asked to predict it. We compare three predictors:
- Route model: our conditional logit.
- Shortest path: the shortest walk to the likeliest end point, which is what a planner would assume with no model.
- Random walk: an equal chance at every junction, the floor.
| Metric | What it measures | Route model | Shortest path | Random walk |
|---|---|---|---|---|
| Log-likelihood per step | Probability given to the turn the march actually took (higher is better) | -0.11 | -0.15 | -0.17 |
| Top route overlap | Share of the real route's streets on the predicted route | 33% | 29% | 0% |
| True end in top 3 | One of the top 3 end points is within 250 m of the real end | 75% | 72% | 0% |
If the route model doesn't beat shortest path, training prints a warning not to claim it does. Sanity checks also confirm that probabilities stay between 0 and 1, spill never lands on the march's own route, and police posts never exceed the officers available.
Why this is the best use of data for prediction and decision making
- It fuses sources nobody joins. March plans, a street graph, embassy locations, rally capacity, weather, Wikipedia attention, calendars and legal zones are each public. Nobody had put them on one street graph and asked one question of them.
- It predicts distributions, not guesses. Every street gets a probability and every route a share. A shopkeeper on a 15% street and one on a 70% street get different advice, which a single predicted line can't give.
- It explains itself. Every prediction shows the weather it assumed, the media spike it measured, and what each factor did to turnout, route and rowdiness. Each effect is labelled learned or assumed, so users know how far to trust it.
- It uses only information available before the march. Media attention is measured before the march date, weather is the forecast for future dates, and the backtest hides each march from its own training.
- It closes the loop to action. Predictions feed an act-by time for a shop, ranked storage sites and an optimal police deployment with risk before and after. The output is a decision, not a chart.
- It is tested against the alternative people already use. The model is benchmarked against the shortest path a planner would assume, and the results, wins and losses, are shown in the app.
- It is honest about its limits. Training routes are published plans, not GPS traces, so the model predicts planned routes. Overspill has no recorded events to learn from, so it uses crowd physics with stated coefficients. The app says so on the page.
How we built it
The system is five layers, and each one only reads from the layer above it.
- Public data sources: march plans, OpenStreetMap, TfL zones, Wikidata, Open-Meteo weather, Wikipedia pageviews, calendars, Police.uk, ACLED.
- Ingestion (
python ingest.py): download, geocode, snap routes to streets, derive street features, build the hexagon grid and per-march context. - DuckDB with the spatial extension: one database holding map, grid, events, routes and context tables, with distances measured in British National Grid metres.
- Models: conditional logit route choice, absorbing Markov chain, Yen top routes, turnout, crowd-physics overspill, shop and police decisions.
- Typed contract and Streamlit app: a contract and mock predictor let UI and model teams work in parallel; pydeck and Folium maps across five decision pages.
Stack: Python 3.12, DuckDB 1.5 with the spatial extension, OSMnx, NetworkX, SciPy (L-BFGS and sparse solves), Shapely, Streamlit 1.66, pydeck (deck.gl), Folium and Altair. Model and app teams agreed a typed contract up front: frozen dataclasses, a predictor protocol, a mock predictor and a self-test that checks both predictors return the same shapes.
Challenges we ran into
- No GPS traces exist for marches. We rebuilt routes from published plans, geocoded each waypoint, reviewed them by hand and joined them with shortest paths. Interpolated streets get less weight in training.
- Small, uneven history. Some causes march often and some rarely, so the model is deliberately small and regularised towards sensible priors. Effects the data can't support, such as rain when no training march had rain, fall back to stated priors and are labelled as such.
- Context cancels out in a choice model. Weather or the day of the week is the same for every street at a junction, so it has no effect on its own. We made it count by interacting it with street features: rain × main road, darkness × main road, turnout × width.
- Avoiding leakage. Media attention and street history are computed strictly from data before each march, including inside the backtest.
Accomplishments we're proud of
- One command builds the whole dataset, one trains the model, and one checks that the model and app agree.
- Model and interface teams worked in parallel against a fixed, typed contract with a mock predictor, so the app worked before the model was finished.
- Every number on screen can be traced back to its data or its assumption.
What we learned
The hard part of prediction is not the model; it is joining messy public sources on a common frame and being honest about what the data can and can't support. The step from probability to decision (act by when, store where, post officers where) is where the value lands.
What's next
- Live inputs: pull organiser and police announcements as they appear and update predictions before the march.
- Learn turnout and overspill from data as more events with counts and incident reports become available.
- A walk-forward backtest that only trains on marches before each test march.
- Alerts for shops and residents on streets above a risk threshold.
Built With
- python
- streamlit


Log in or sign up for Devpost to join the conversation.