-
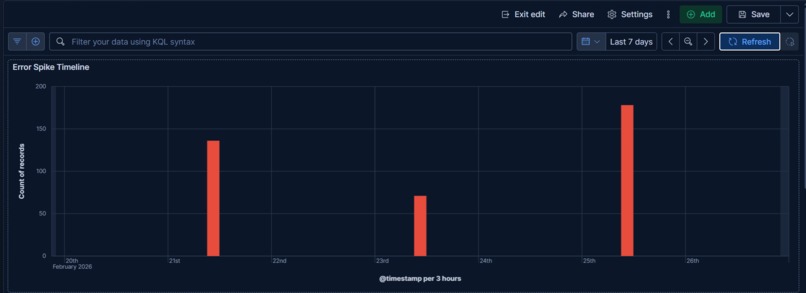
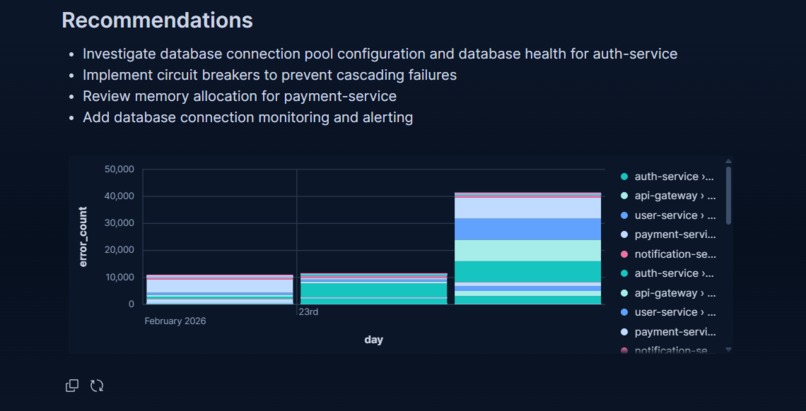
Error spike timeline showing distinct incident bursts across the week — each spike is a separate failure scenario detected by LogSage
-
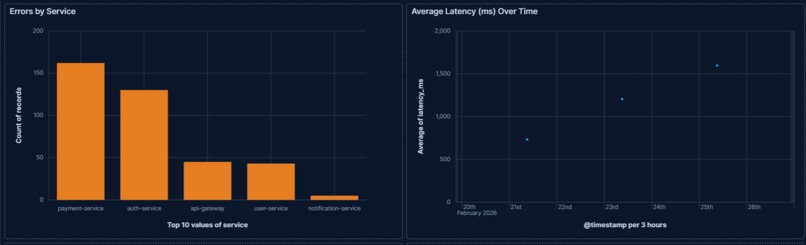
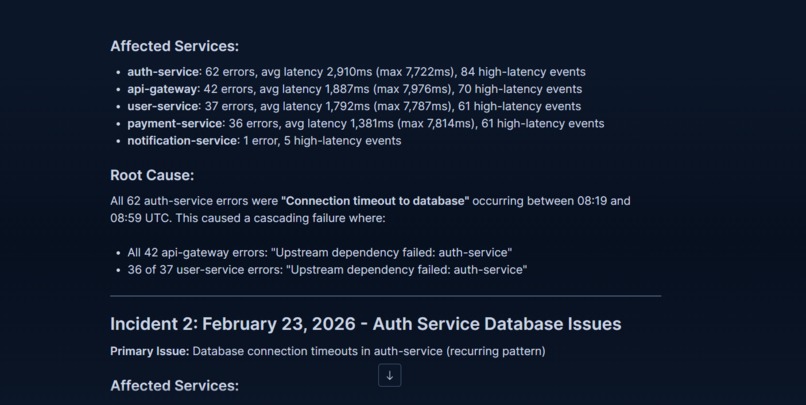
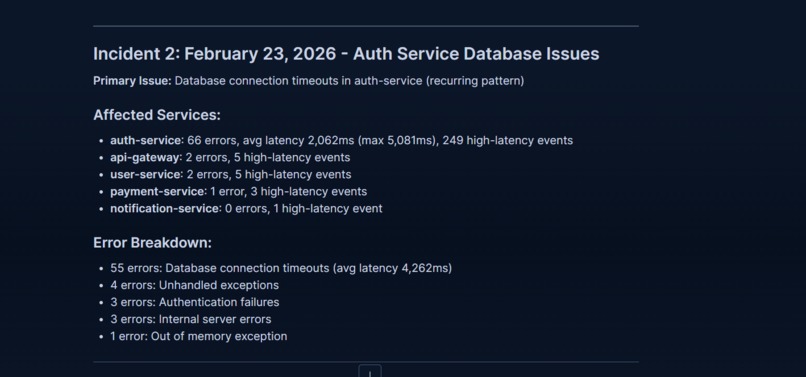
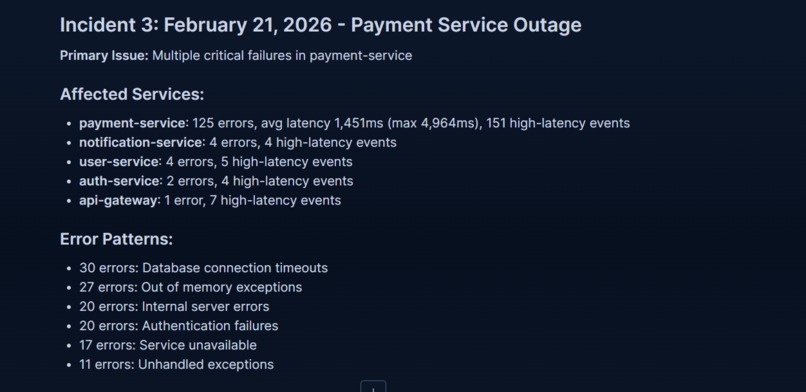
Per-service error breakdown and average latency trend showing which services are most affected and how degradation progresses over time
-

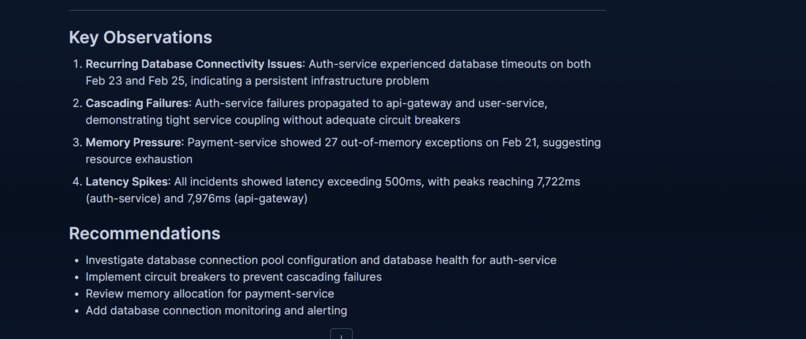
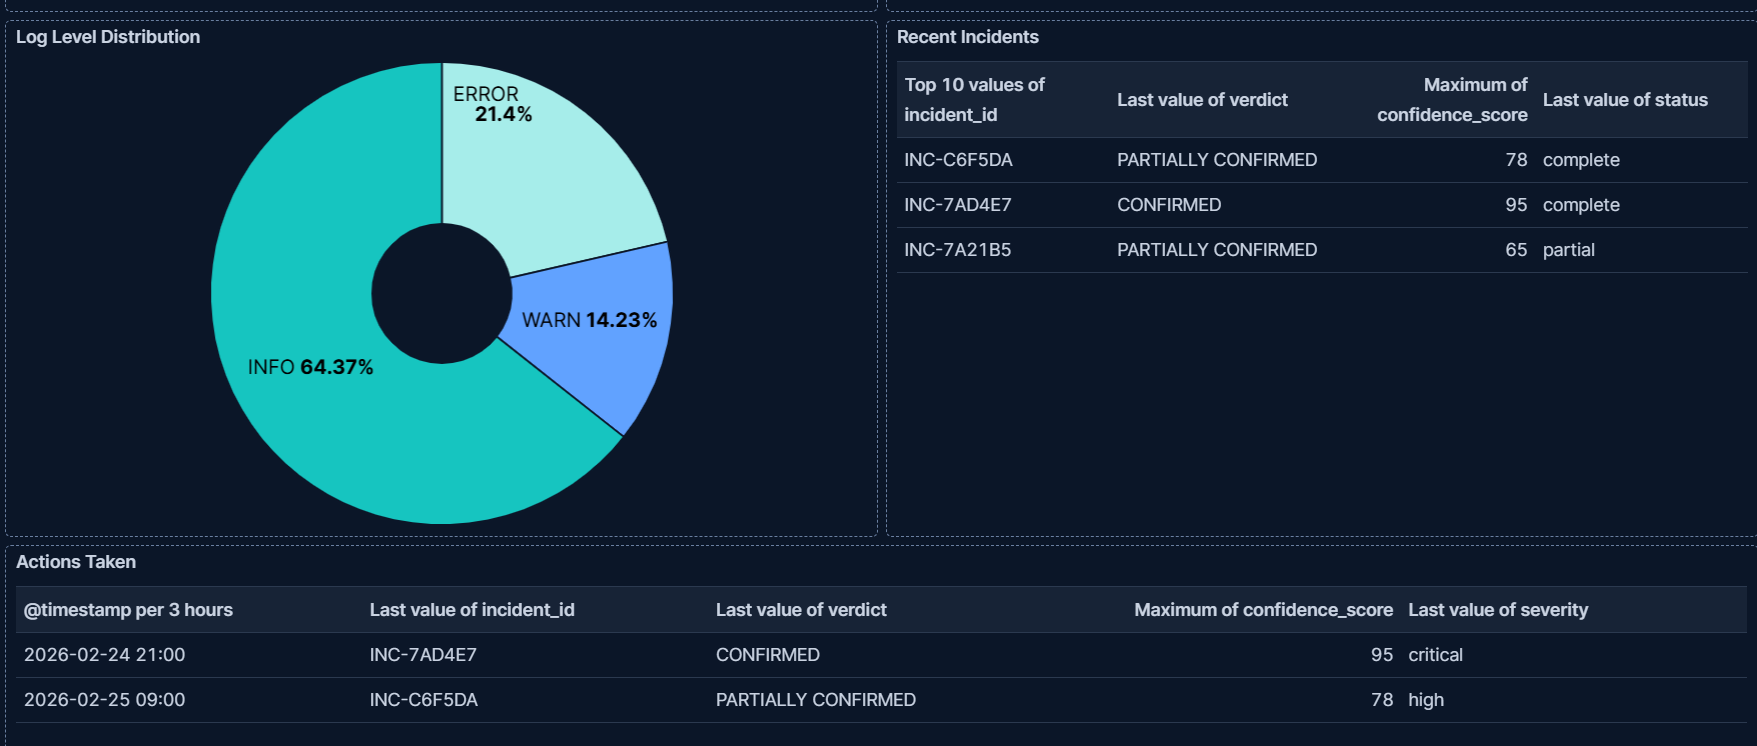
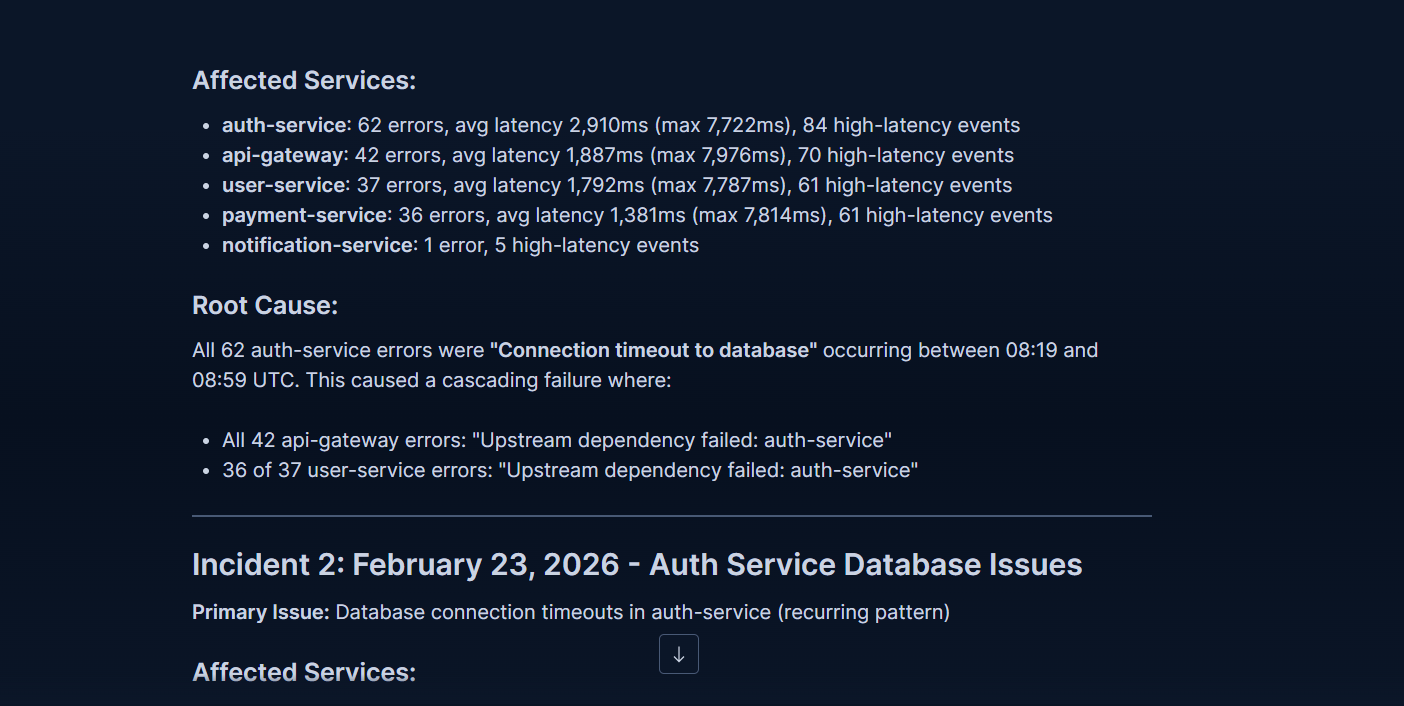
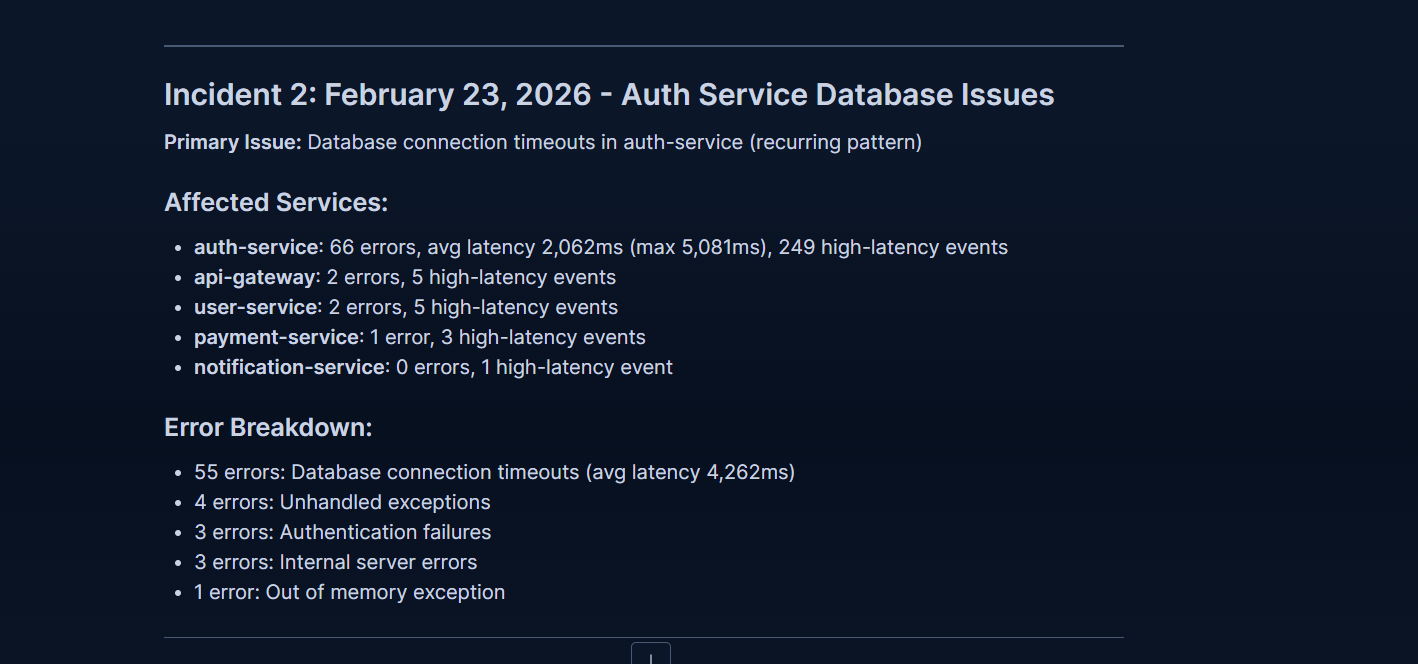
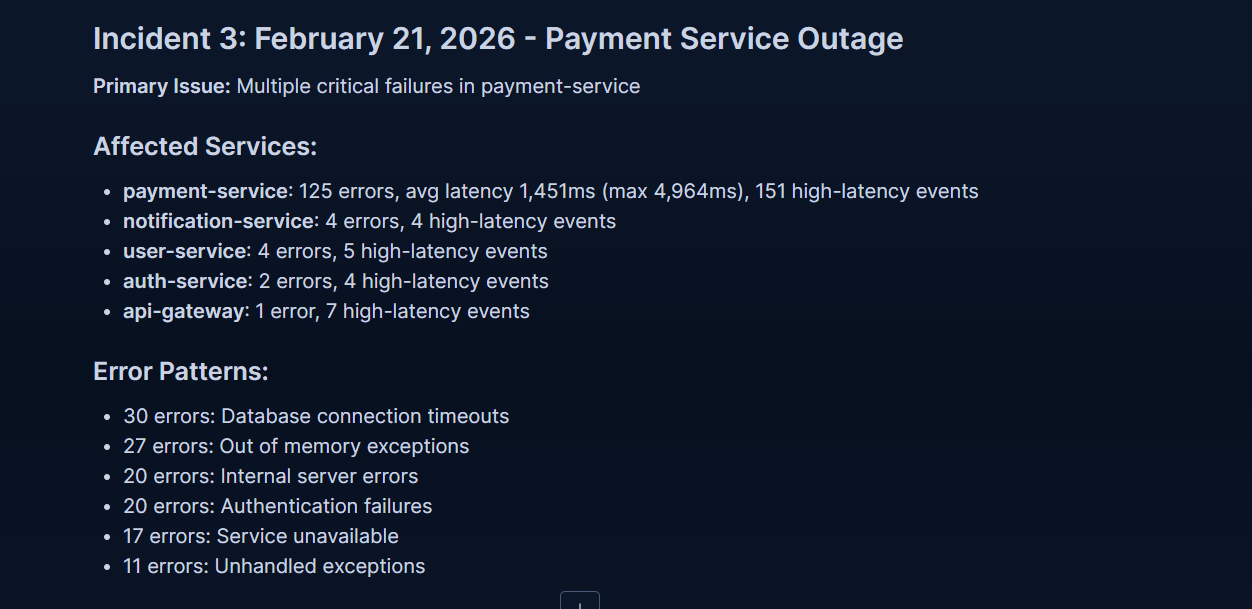
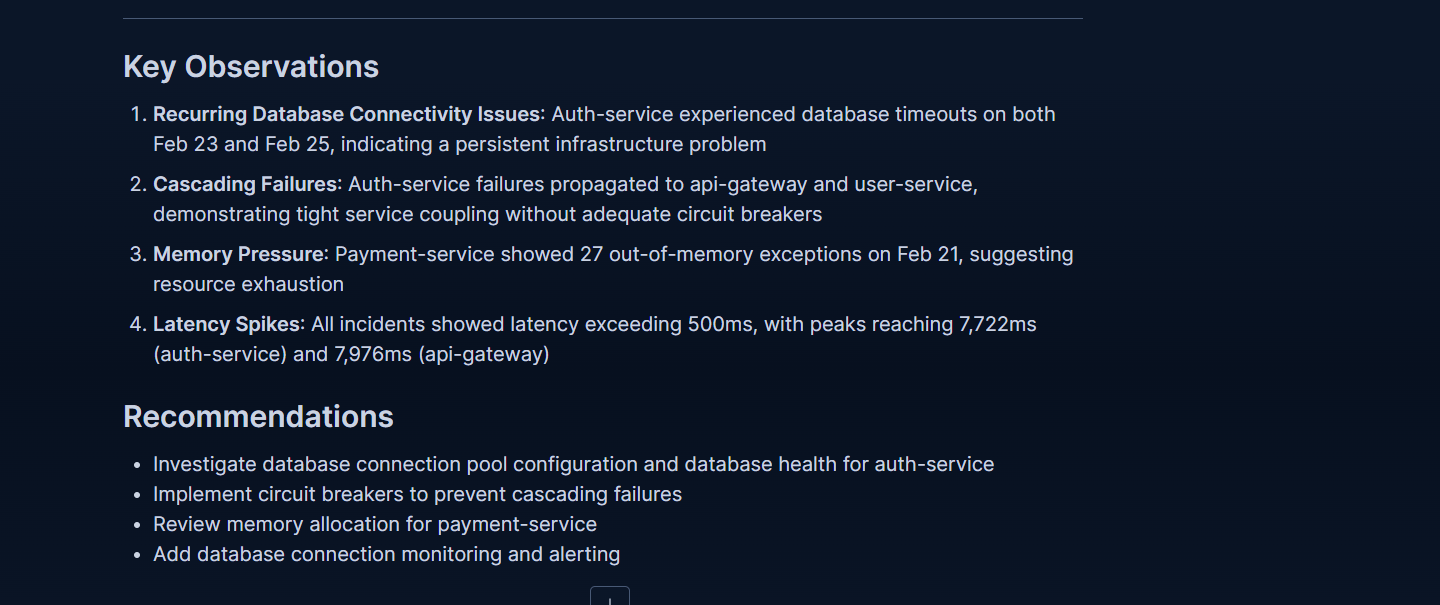
AI-generated incident reports with verdict and confidence score, plus escalation audit trail showing which incidents triggered Slack alerts
-
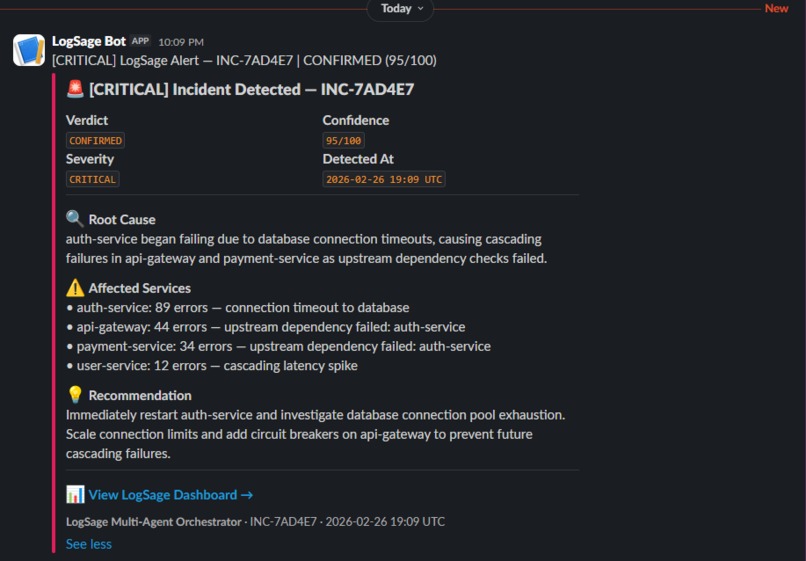
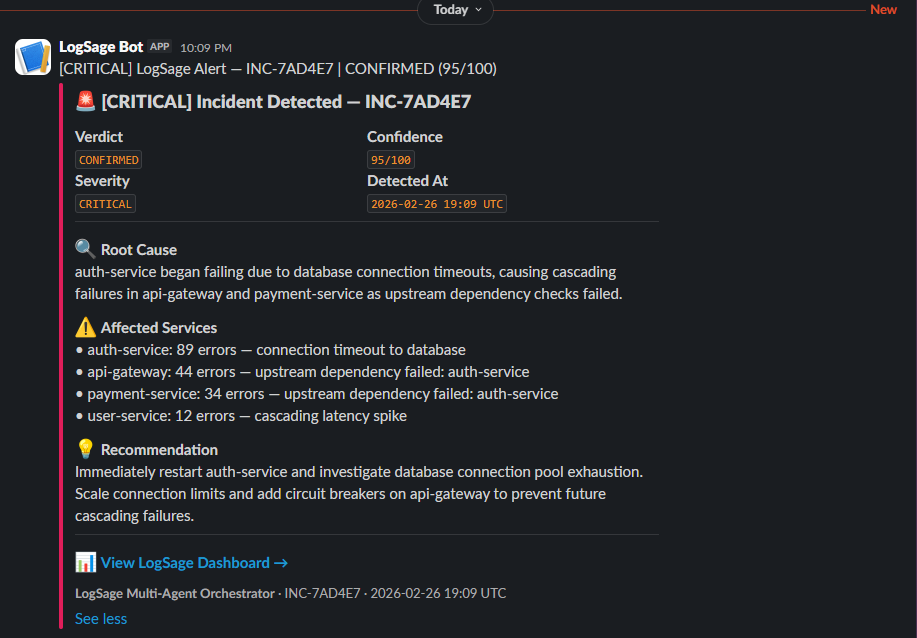
Slack Block Kit escalation alert — root cause, affected services, and recommendation delivered automatically when confidence ≥ 70
-
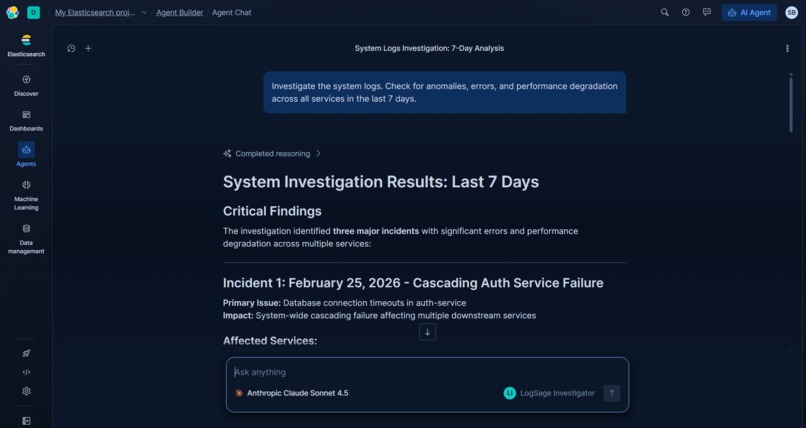
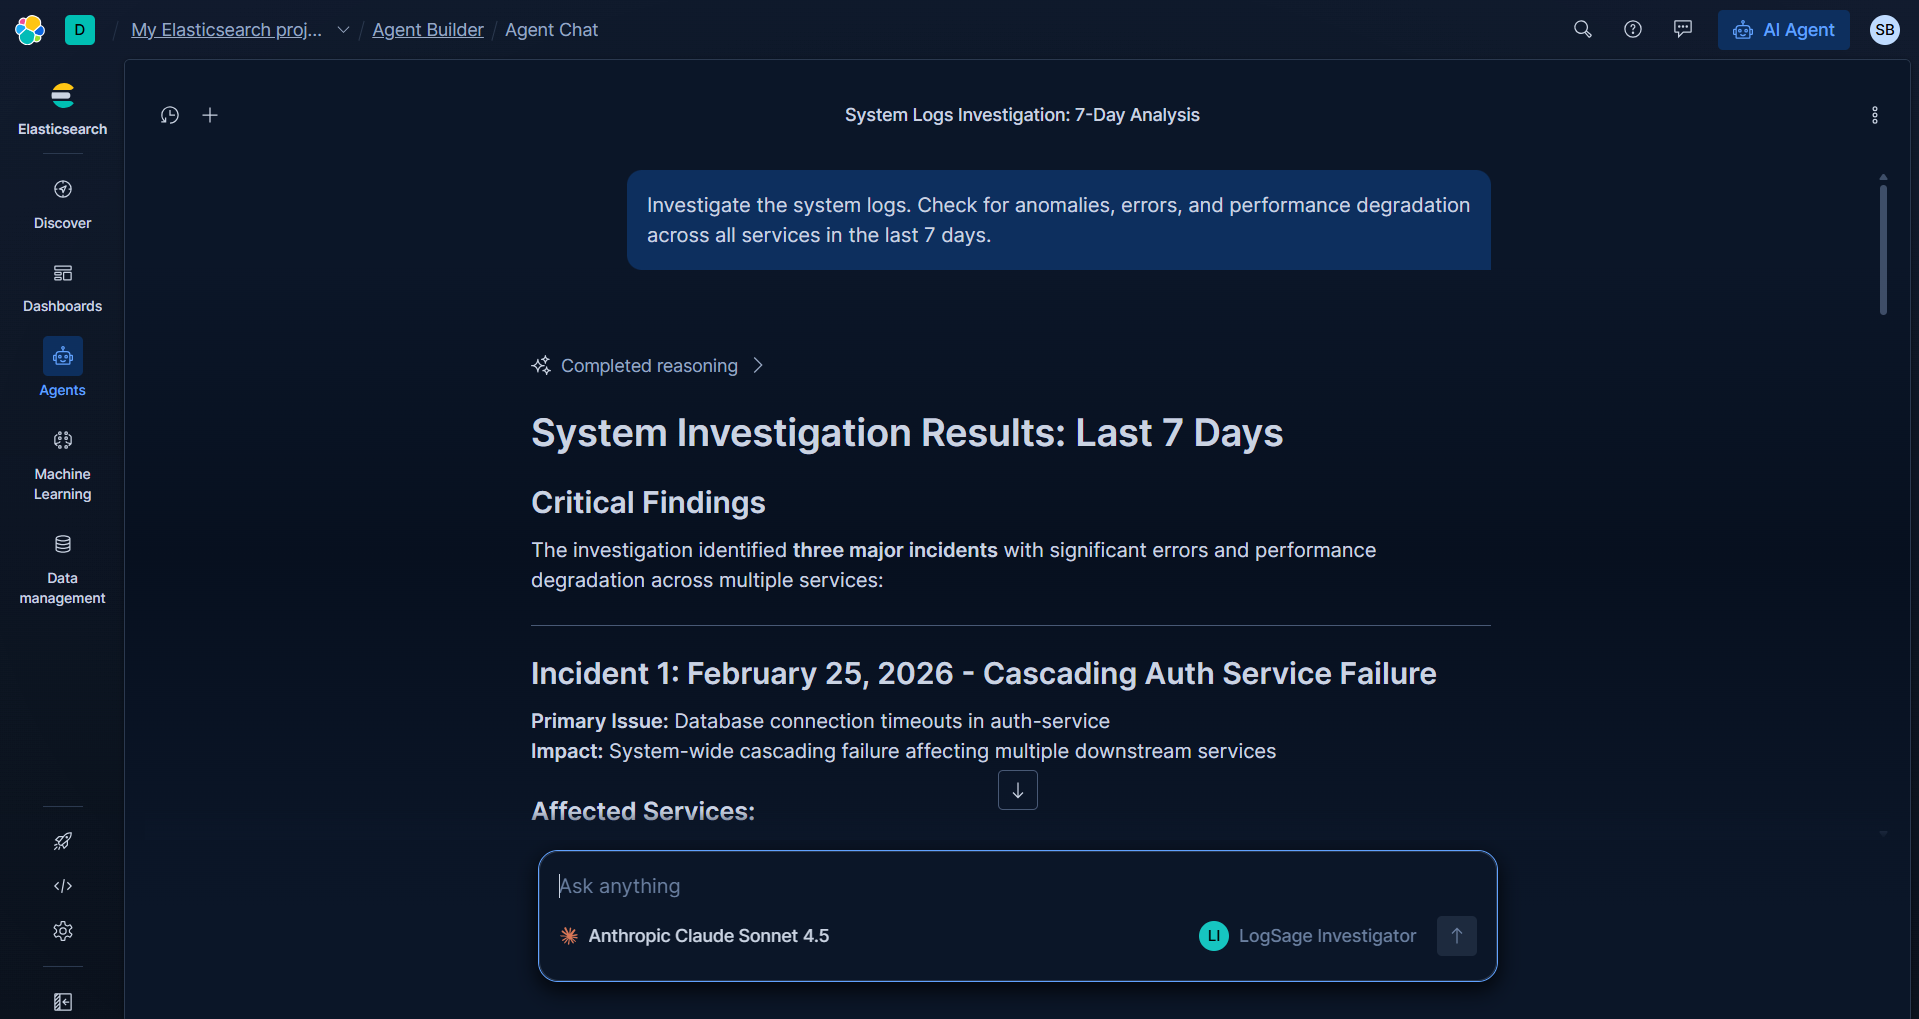
LogSage Investigator agent responding to an investigation query — using ES|QL tools to detect anomalies directly from Elasticsearch
-
-
-
-
-


Inspiration
Every engineering team knows the pain: it's 2 AM, an alert fires, and an on-call engineer spends the next hour manually correlating logs across five different services to figure out if it's real. Alert fatigue is real, and the cost of that manual triage — in time, sleep, and missed incidents — is enormous.
I wanted to build a system where AI agents do the investigation, not the engineer.
What It Does
LogSage is a 4-phase multi-agent pipeline built on Elastic Agent Builder:
- Investigator Agent — detects error spikes and latency anomalies across microservices using ES|QL time-series queries
- Analyst Agent — correlates events across services, establishes a failure sequence, and generates a root cause hypothesis
- Validator Agent — independently re-queries the data to verify the hypothesis and assigns a Verdict (CONFIRMED / PARTIALLY CONFIRMED / UNCONFIRMED) with a Confidence Score (0–100)
- Auto-Escalation — if Confidence ≥ 70, automatically writes an audit record to Elasticsearch and sends a rich Slack Block Kit notification with root cause, affected services, and recommendation
Every incident report is persisted to Elasticsearch. A 6-panel Kibana dashboard provides full observability across raw logs, AI-generated incidents, and escalation history.
How I Built It
The three agents are created in Kibana Agent Builder with ES|QL and Search
tools. A Python orchestrator (orchestrate.py) calls each agent sequentially
via the A2A (Agent-to-Agent) JSON-RPC 2.0 endpoint, passing context between
phases automatically. The Elastic Managed LLM handles all reasoning — no
external API keys or token budgets needed.
A separate setup_dashboard.py script provisions all Kibana data views,
Lens visualizations, and the dashboard automatically, making the project
fully reproducible from a single command.
Challenges
The A2A endpoint occasionally returned 502/503 errors under load, which required implementing exponential backoff retry logic (up to 5 attempts) to make the pipeline reliable.
The Kibana Cases API is not available on Elasticsearch Serverless projects
(only Security/Observability types), which led me to build a custom
logsage-actions Elasticsearch index as a more flexible and queryable audit
trail.
What I Learned
ES|QL is remarkably powerful for time-series anomaly detection — queries that would require complex multi-stage pipelines elsewhere are concise and fast. The Elastic Managed LLM made iteration extremely fast with zero configuration. Most importantly, the A2A protocol makes it straightforward to chain agents into real workflows rather than isolated chat sessions.
Built With
- a2a-protocol
- elastic-agent-builder
- elastic-managed-llm
- elasticsearch
- es|ql
- incoming
- kibana
- python
- slack
- webhooks

Log in or sign up for Devpost to join the conversation.