-
Cross Correlation can be combined with other vizualizations to help users understand historical patterns
-
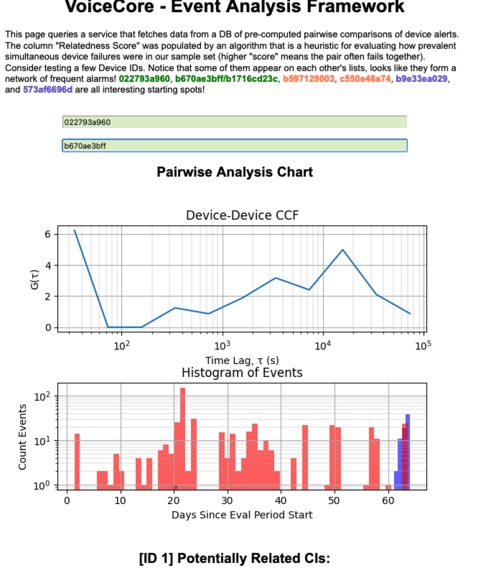
Dashboard - shows chart for a single pairwise comparison and 10 most "related" devices by 1D CCR
Inspiration
I just wanted to build something fast and explainable; didn't want to be up all night training a model. And I wanted to be able to get it up on the web in a few hours that handled usecase #2 in a unique way
What it does
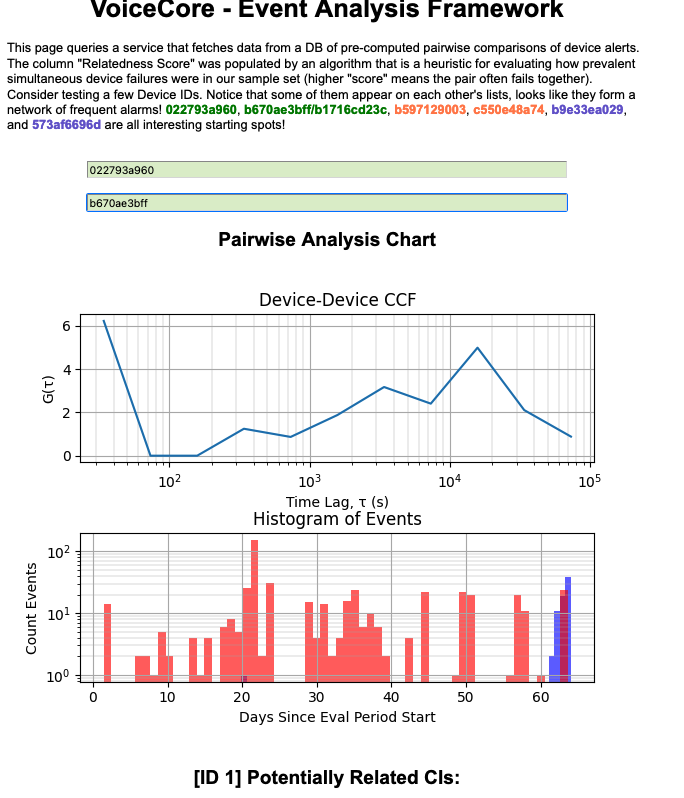
The webpage queries a service that fetches data from a DB of pre-computed pairwise comparisons of device alerts. The column "Relatedness Score" was populated by an algorithm that is a heuristic for evaluating how prevalent simultaneous device failures were in our sample set (higher "score" means the pair often fails together).
The metric is (roughly!) the weighted integral of the cross-correlation between pairs of devices alert times. Cross-correlations can be calculated on "uniformly-sampled" signals or on "point-processes"; in our case, we treat alert times as 1D point processes. This heuristic has several advantages over more complex methods:
Easy to Recalculate: Because this method uses closed-form signal processing/statistics, millions (or billions) of pairwise comparisons can be run quickly on commodity hardware. This method parallelizes very well, so even as the cardinality of devices increases, (re)calculation can be implemented with a small footprint
Flexibility (Part 1): The cross-correlation of 1D series can be calculated over lags covering several orders of magnitude. This gives a developer the ability to tweak the evaluation period (e.g. in this example I consider events up to within ~3hrs of one another)
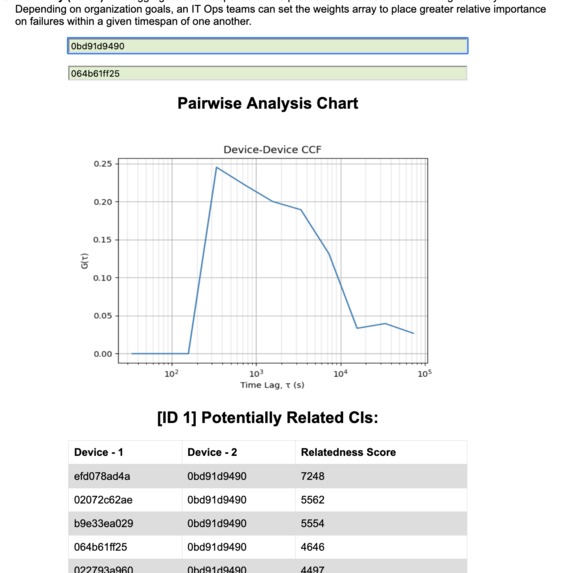
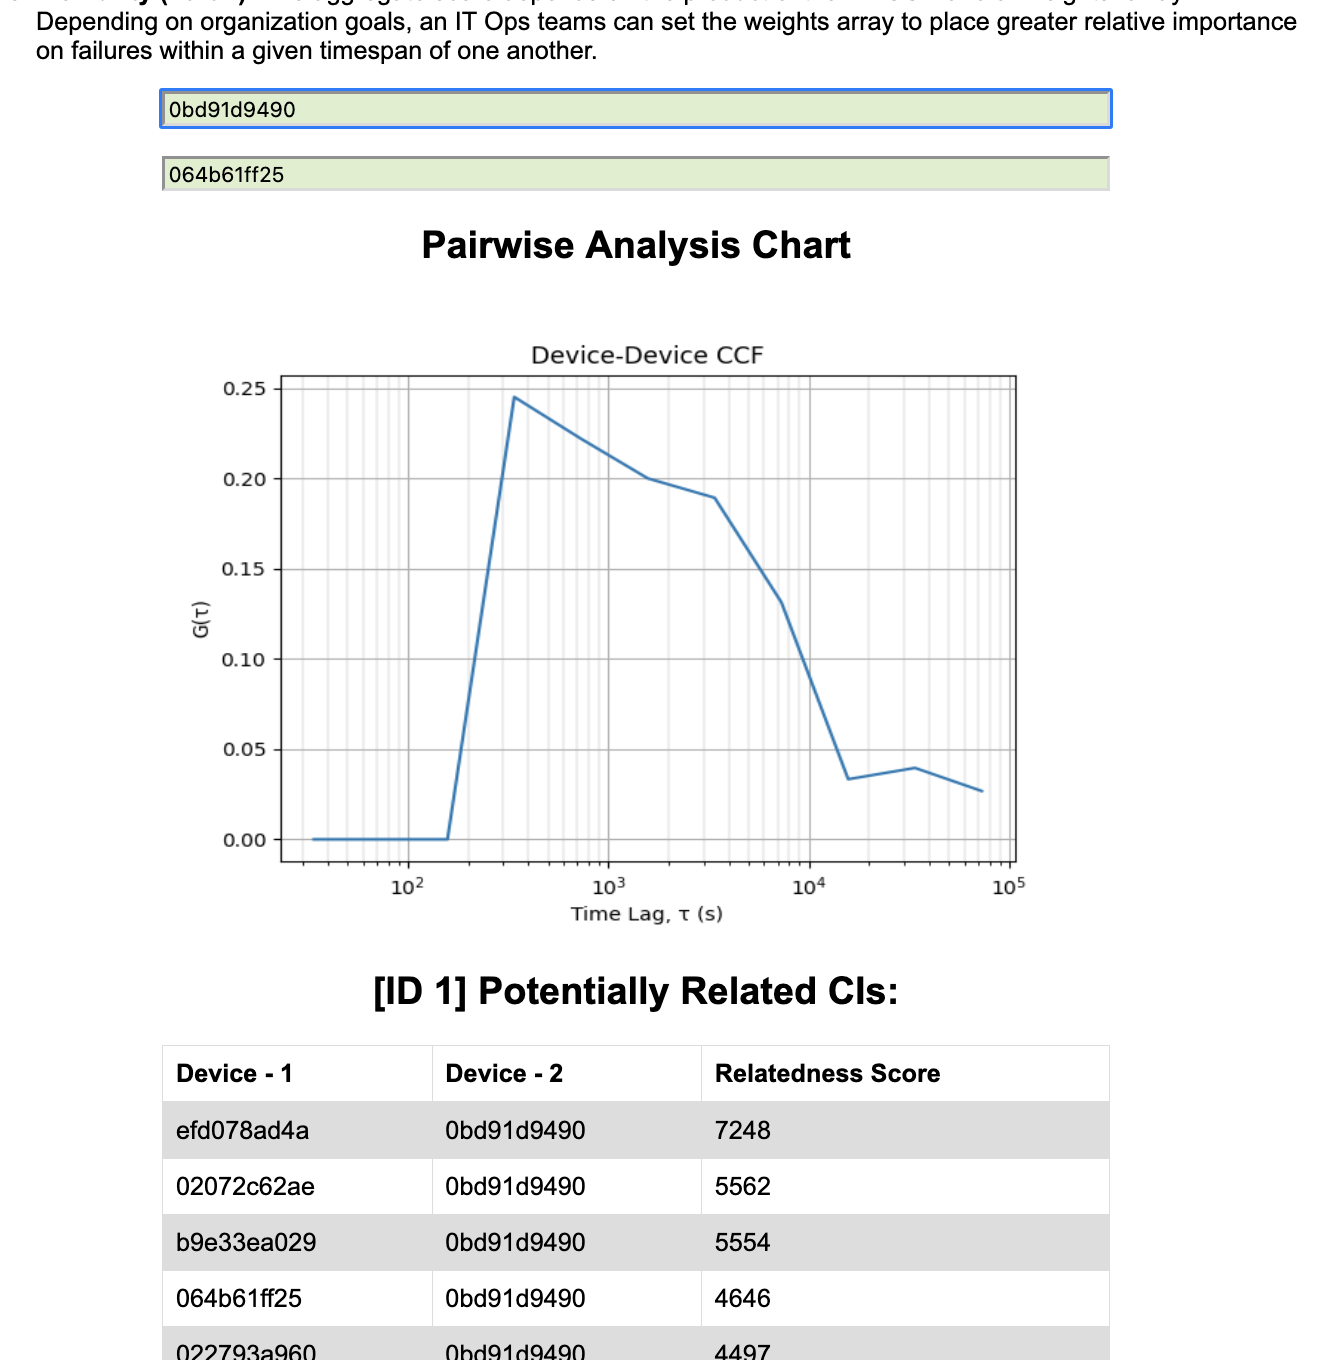
Flexibility (Part 2): The aggregate score depends on the product of the 1D CCR and a
weightsarray. Depending on organization goals, an IT Ops teams can set the weights array to place greater relative importance on failures within a given interval.
How we built it
Flask API pointing at a DB with 1D correlation materialized in the DB. API call for "most related devices" is fast since it's just a lookup against static data, nothing on the fly.
Same API, different endpoint can be used to render an image of the CCR chart on the fly (unfortunately, rather slow)
Challenges we ran into / Accomplishments that we're proud of / What we learned
The math behind this is pretty foreign to me. I had seen something like this before, but I don't remember as much of it as I should. I dove right in and hoped it would come back to me, It didn't really. I'd be a bit more confident If I could have tinkered with parameters BEFORE having time to re-familiarize myself with the math.
Pairwaise 1D correlations can be a very fast operation, but on my super small machine, my original estimate was something like 5 hours for 200,000 comparisons. Made some changes to how I stored arrays, how arrays were accessed, and added multi-processing, and the job ran in < 2 minutes
What's next for Logs Event Correlation
Check the math, consider extending the API to do pairwise comps on the fly. Given more time It would have been nice to tinker with graph vizualisation, but not in the cards for today.


Log in or sign up for Devpost to join the conversation.