-
-
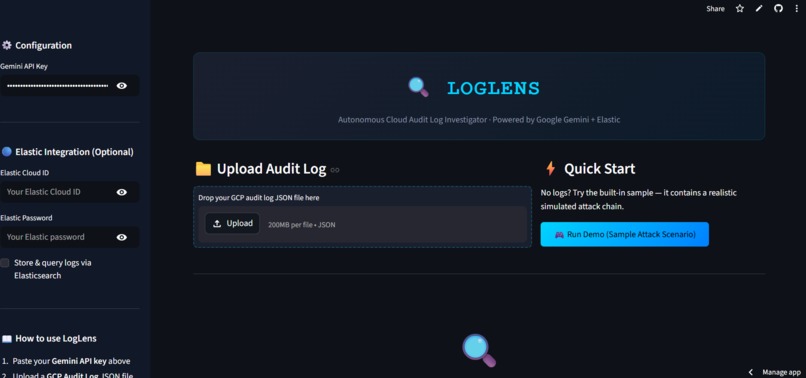
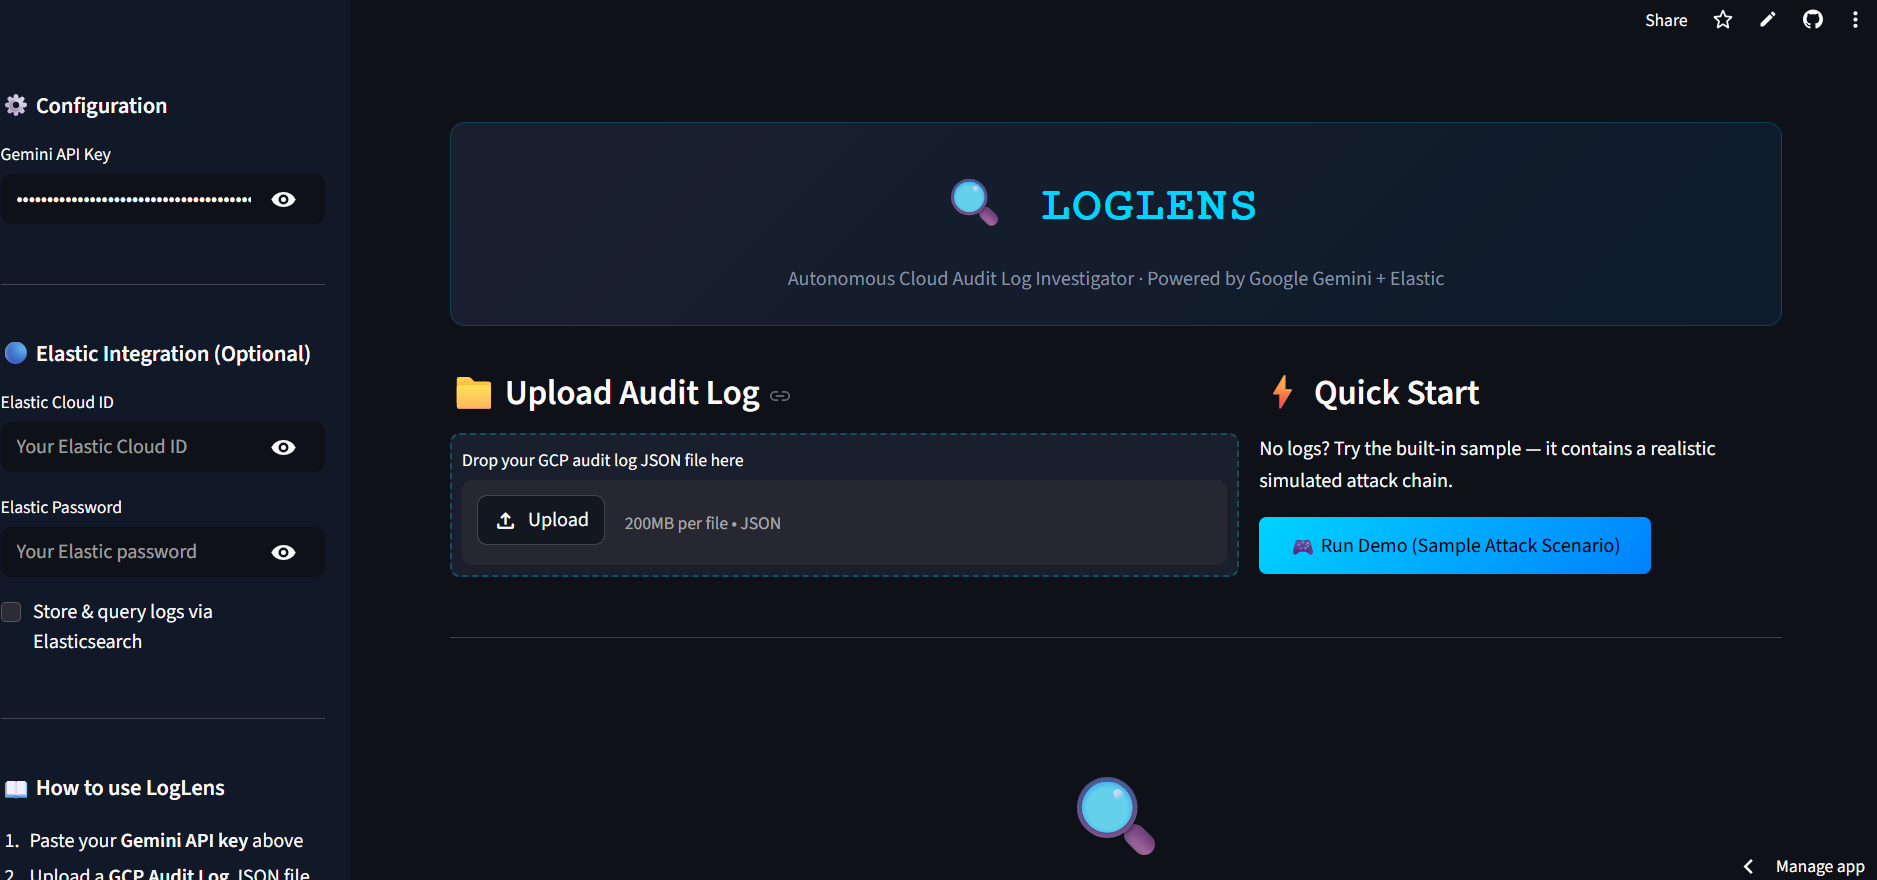
Home page UI
-
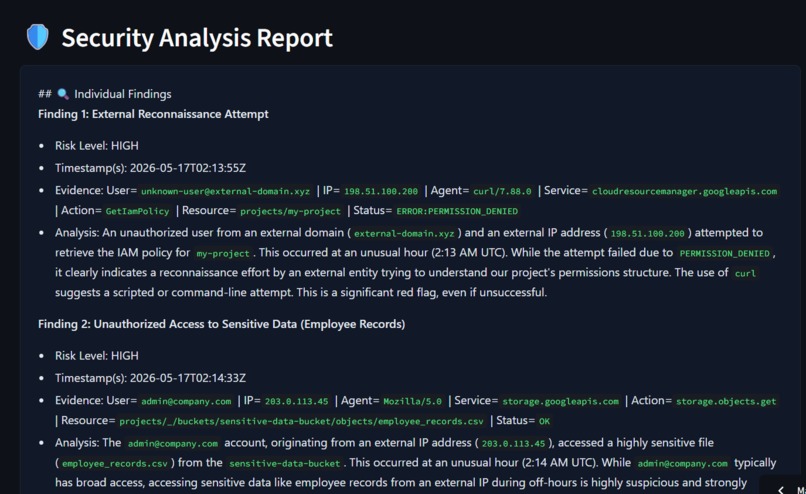
Threat Report Output - Security Analysis Report
-
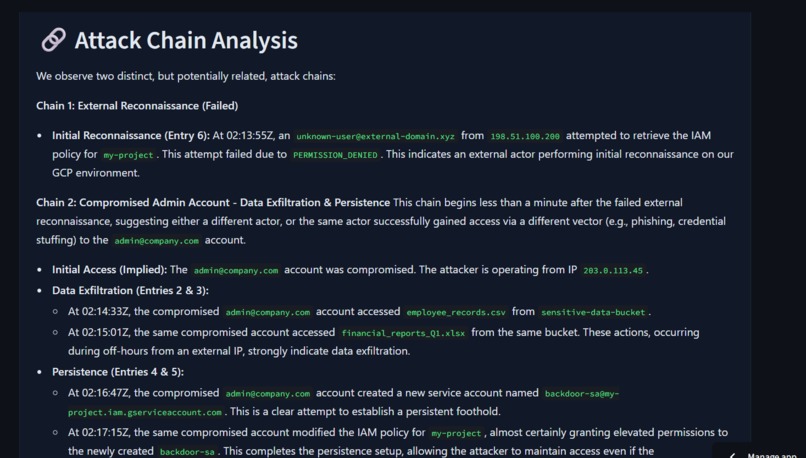
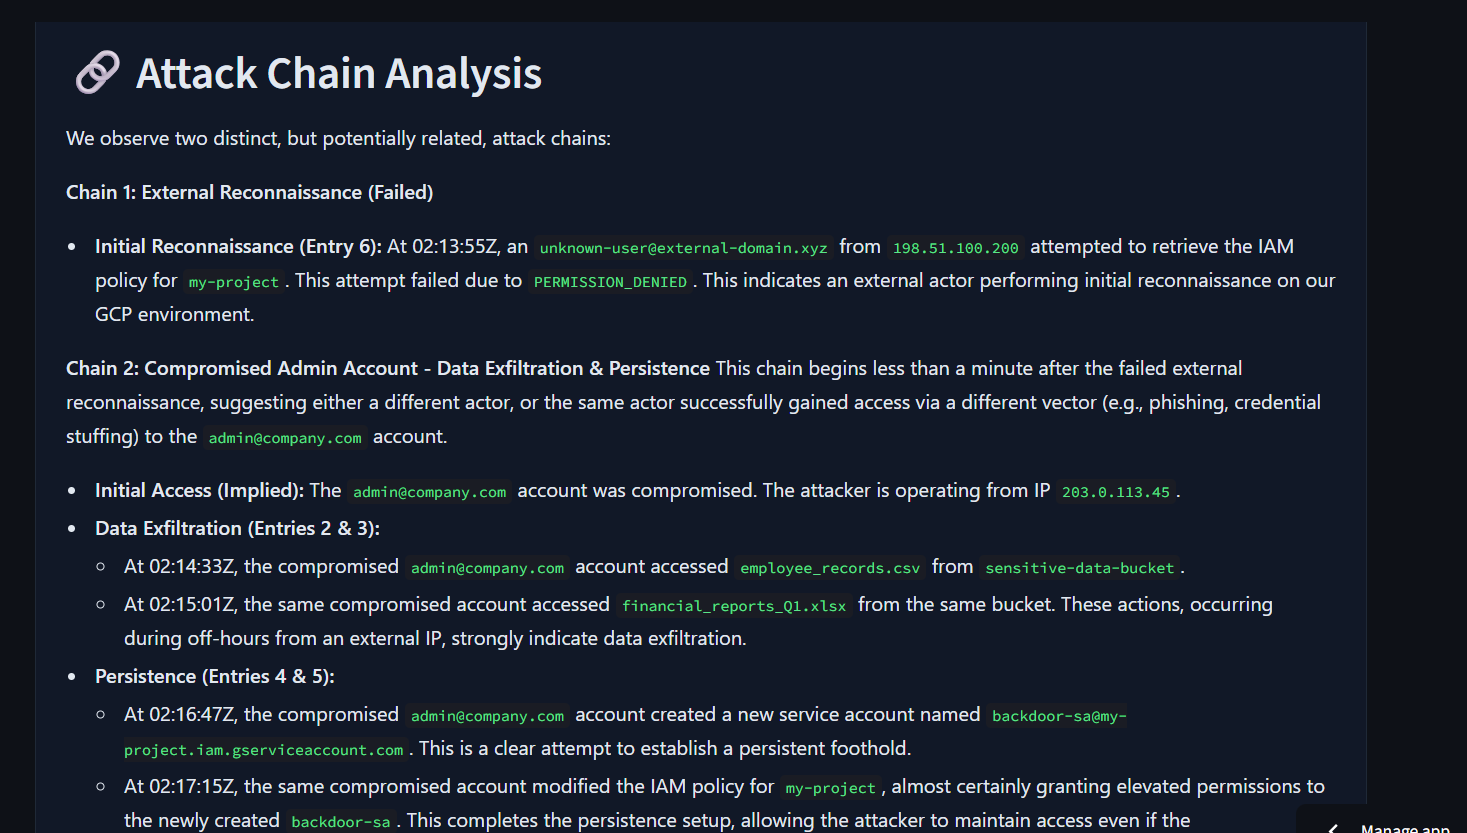
Threat Report Output - Attack Chain Analysis
-
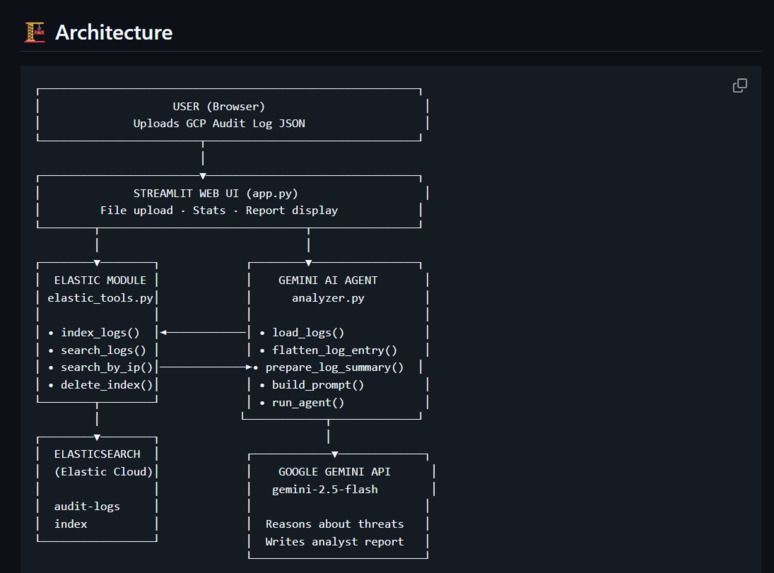
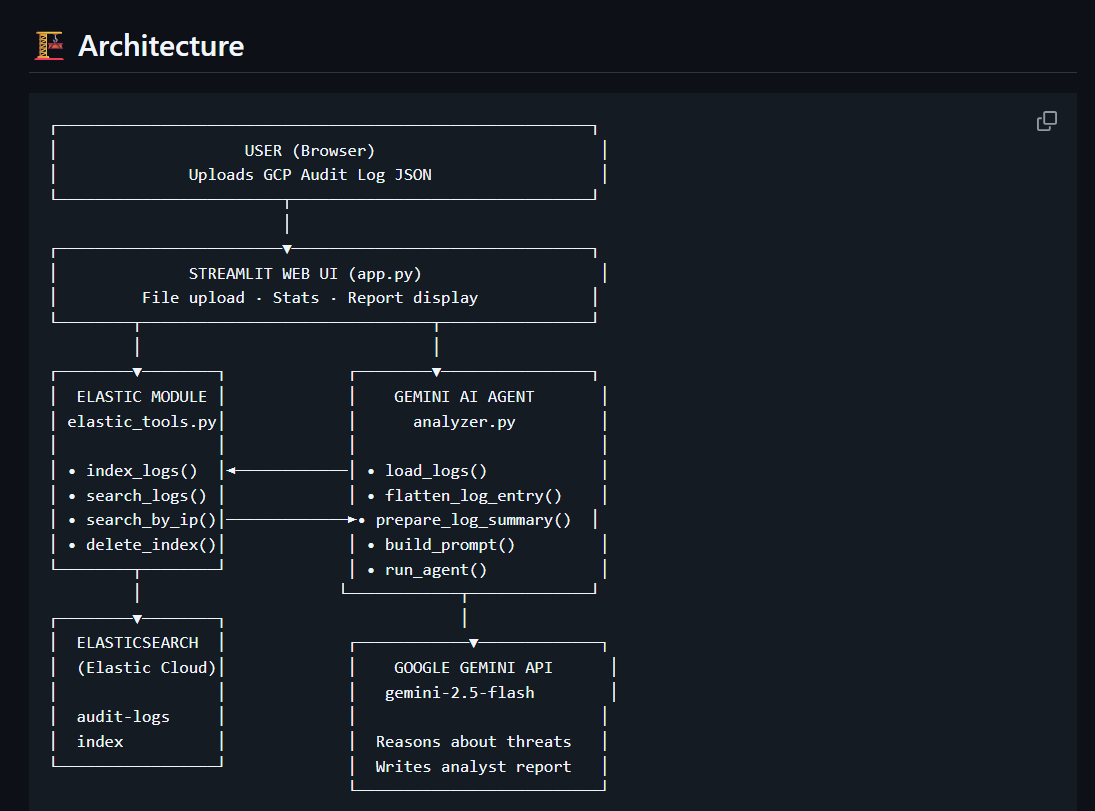
Architecture

Inspiration
Security teams at cloud-native companies are drowning in audit logs. A single GCP project can generate thousands of log entries per day — IAM changes, storage access, compute events, authentication activity. Investigating a suspected breach means manually reading through hundreds of entries, cross-referencing timestamps, IPs, and user identities to piece together what happened.
Most tools just display logs. None of them think about what the logs mean.
LogLens was built to change that. Instead of a human analyst spending hours triaging a log dump, LogLens reads the entire set autonomously and produces a structured threat report in under a minute — identifying attack chains, assigning risk levels, and writing an executive summary that a non-technical manager can act on immediately.
What it does
LogLens is an autonomous cloud security agent. You upload a Google Cloud Platform audit log JSON file. LogLens:
- Parses and flattens all log entries into analyst-readable format
- Optionally indexes them into Elasticsearch for scalable storage and querying
- Sends the full log context to Google Gemini with a structured analyst prompt
- Gemini reasons about each event — not just describing what happened, but explaining why it is or isn't suspicious
- Groups related events into attack chains (e.g., recon → data theft → privilege escalation)
- Assigns a risk level to each finding: CRITICAL / HIGH / MEDIUM / LOW / BENIGN
- Produces a full security report with individual findings, attack chain narrative, and executive summary
- Lets the user download the report as a Markdown file
The Elastic integration means logs are indexed in Elasticsearch before analysis — enabling search_by_ip(), search_by_user(), and search_errors() queries, and making the architecture scalable to real production log volumes.
How I built it
Core AI Agent (agent/analyzer.py)
The agent uses the google-genai Python SDK to call Gemini 2.5 Flash. Each log entry is flattened into a structured one-liner preserving all key fields (timestamp, user, IP, service, action, resource, status). All entries are compiled into a single context block and sent to Gemini with a detailed analyst prompt that specifies the exact output format — individual findings, attack chains, and executive summary.
Elastic Integration (agent/elastic_tools.py)
The Elasticsearch integration uses the official elasticsearch Python client connected to Elastic Cloud. When enabled, logs are indexed into an audit-logs index before analysis, and retrieved back via search_logs(). This adds search_by_ip(), search_by_user(), and search_errors() as callable tools — making LogLens a true agent that can query its data store rather than just reading a static file.
Web Interface (app.py)
Built with Streamlit. Features include: file upload with JSON validation, a Run Demo button with a bundled sample attack scenario, live stats cards (entry count, services touched, error count), raw log preview, the Elastic credentials panel, and a download button for the generated report.
Tech Stack:
- Google Gemini 2.5 Flash (AI reasoning)
- Elasticsearch / Elastic Cloud (log storage and search)
- Streamlit (web UI)
- Python 3.11
- Hosted on Streamlit Community Cloud
Challenges I ran into
Prompt engineering for structured output: Getting Gemini to reliably produce the exact report structure (individual findings → attack chains → executive summary → benign activity) required several iterations of the prompt. The key was being very explicit about what "reasoning" means versus just "describing" — early versions were too descriptive and not analytical enough.
Log flattening without losing context: GCP audit logs are deeply nested JSON. Flattening them into one-liners for Gemini while preserving all the fields that matter (caller IP, user agent, resource name, status code) took careful engineering to avoid losing the signal in the noise.
Elastic + Streamlit file handling: Streamlit's file uploader returns bytes, not a file path — which meant we couldn't use a simple open() call. Switching to json.loads(file_bytes.decode("utf-8")) and passing a list of dicts (rather than a filepath) through the entire pipeline required refactoring the agent's function signatures.
Module structure on deployment: Deploying to Streamlit Cloud exposed a nested folder issue (an agent/agent/ structure created during development) that worked locally but broke imports on the cloud. Resolved by ensuring a single flat agent/ module directory.
Accomplishments that I'm proud of
- The agent genuinely reasons about threats rather than just classifying them — the output reads like something a human analyst wrote, not a rules-based alert
- The attack chain detection works end-to-end on the sample scenario: Gemini correctly identifies the 02:13–02:17 AM window as a coordinated intrusion involving recon, data theft, backdoor creation, and privilege escalation — without being told to look for those specific patterns
- The Elastic integration turns a file-reading tool into a proper data-backed agent with queryable log storage
- Full end-to-end pipeline in under 200 lines of core agent code — clean and readable enough for a judge or professor to understand in minutes
What I learnt
- How to structure prompts for AI agents that need to produce consistent, parseable output across varying input sizes
- How Elasticsearch indexing and retrieval works in practice — the difference between indexing a document and querying it back, and why
refresh()matters for immediate searchability - How Model Context Protocol (MCP) architecture works: separating the "tool layer" (Elastic) from the "reasoning layer" (Gemini) mirrors how production agentic systems are designed
- How to build a full AI-powered web app from scratch — from raw API calls to a deployed, publicly accessible URL
What's next for LogLens - Autonomous Cloud Audit Log Investigator
- Real-time log streaming: Connect directly to GCP's Cloud Logging API so LogLens ingests and analyses logs as they happen, not from a static file
- Multi-cloud support: Extend beyond GCP to AWS CloudTrail and Azure Activity Logs using the same agent architecture
- Autonomous follow-up queries: Let the agent issue follow-up Elasticsearch queries based on its own findings — e.g., after flagging a suspicious IP, automatically search for all other actions from that IP
- Alert integration: Push CRITICAL findings to Slack or PagerDuty automatically
Built With
- elastic-cloud
- elasticsearch
- google-cloud
- google-gemini
- python
- streamlit

Log in or sign up for Devpost to join the conversation.