-
-

Retrieve All Nodes with Year 2023
-
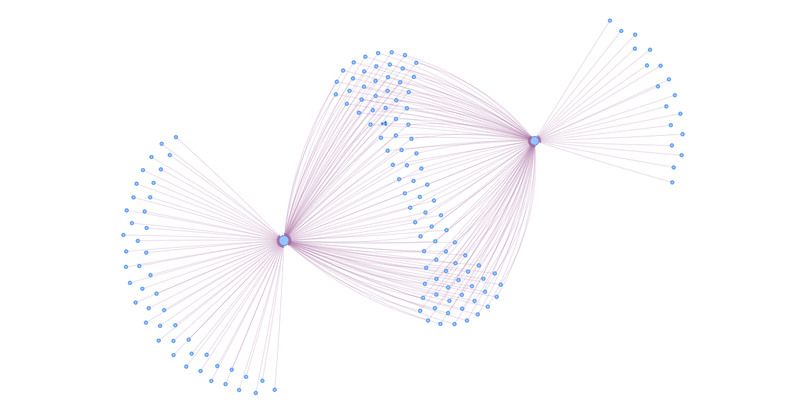
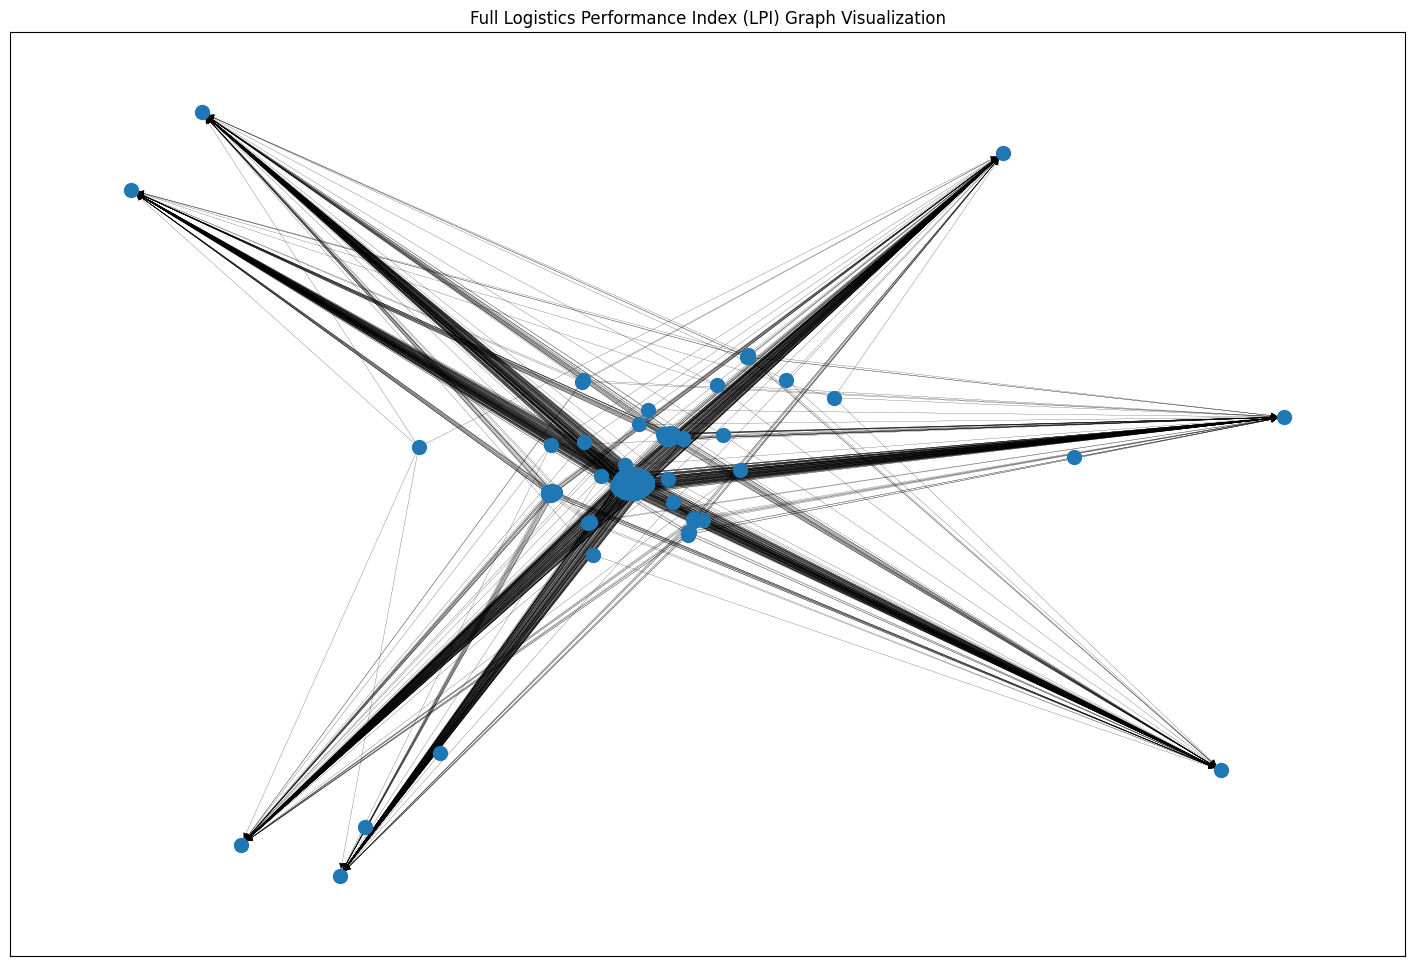
LPI Graph
-

LPI Graph 1


Inspiration
I’ve always been passionate about leveraging data science to solve real-world challenges especially in the logistics and supply chain domain. The complexity of global trade and the critical importance of efficient logistics inspired me to explore the Logistics Performance Index (LPI) dataset. I saw an opportunity to transform this rich dataset into a graph structure to reveal hidden patterns and network dynamics among countries, which could then be used to drive better decision-making in logistics operations.
What it Does
The LPI Agentic Application converts the LPI dataset into a graph where:
- Country nodes represent individual countries along with their logistics performance attributes.
- Year nodes capture the temporal aspect of the data.
- Edges connect countries to years (or to each other via trade relationships) and store detailed LPI metrics such as LPI Score, Customs Score, Infrastructure Score, and more.
This graph-based approach enables:
- Efficient querying using AQL in ArangoDB.
- Advanced analytics (using NetworkX/cuGraph) like PageRank, community detection, and shortest path calculations.
- Dynamic natural language query processing to deliver insights based on user intent.
How We Built It
Dataset Processing:
- I preprocessed the LPI dataset using Pandas, standardizing column names and handling missing values.
- The dataset spans from 2007 to 2023 and includes key logistics metrics (e.g., Customs, Infrastructure, International Shipments).
Graph Conversion:
- I converted the cleaned dataset into a graph using NetworkX.
- Countries and years are added as nodes, and edges are created to connect a country with its performance in a specific year, capturing all relevant LPI metrics.
Persistence with ArangoDB:
- The graph was persisted into ArangoDB, with nodes and edges stored in separate collections.
- I used AQL queries to traverse and query the graph data efficiently.
Graph Analytics & Visualization:
- I implemented advanced analytics using NetworkX and cuGraph (for GPU acceleration) to compute centrality measures, detect communities, and find shortest paths.
- Visualization was achieved using Matplotlib and interactive tools like Gradio for real-time demos.
Agentic Application:
- I developed a dynamic agent that processes natural language queries.
- The system selects the appropriate query method (Simple AQL, Complex Analytics, or Hybrid) based on intent, providing robust and context-rich answers.
Challenges We Ran Into
Data Cleaning & Standardization:
Handling missing values and inconsistent column names required careful preprocessing to ensure data integrity.Graph Conversion:
Converting the multi-dimensional dataset into a graph without losing important attribute details was complex.Integration with ArangoDB:
Persisting the graph in ArangoDB and optimizing AQL queries for efficient retrieval was challenging.Performance Optimization:
Balancing the performance between Python-based analytics (NetworkX/cuGraph) and database querying required significant tuning.Dynamic Query Processing:
Designing the agent to interpret and process natural language queries accurately, and choose the correct processing path (AQL vs. analytics), was a non-trivial task.
Accomplishments That We're Proud Of
End-to-End Integration:
Successfully built a complete pipeline from data preprocessing, graph conversion, persistence in ArangoDB, to dynamic natural language query processing.Robust Analytics:
Implemented advanced graph algorithms (PageRank, community detection, shortest path) to extract deep insights from the data.Interactive Visualization:
Deployed an interactive Gradio interface that allows real-time querying and visualization of graph insights.Scalable Solution:
Created a flexible, scalable system that can be extended with additional data or further advanced analytics.Agentic Query Handling:
Developed an intelligent query agent that dynamically selects the optimal query processing method based on user intent.
What We Learned
Graph Modeling:
Transforming multi-dimensional logistics data into a graph revealed hidden relationships and provided deeper insights.Tool Integration:
Combining ArangoDB, NetworkX, and cuGraph (when available) taught me how to build robust hybrid analytics systems.Optimization Techniques:
I learned various techniques to improve performance, such as using.itertuples(), bulk data cleaning, and parallel processing.Natural Language Query Processing:
Designing an agent to interpret free-form queries and map them to specific analytics functions was a key learning experience.Iterative Development:
The process reinforced the importance of iterative refinement, extensive testing, and adaptability in solving complex problems.
What's Next for the Logistics Performance Index (LPI) Agentic Application
Enhance Real-Time Data Integration:
Integrate live data feeds to update the graph dynamically and reflect the latest global logistics trends.Expand Analytics:
Incorporate additional metrics such as GDP, trade volume, and environmental factors for a more comprehensive analysis.Advanced Visualization:
Develop more sophisticated visualization tools (e.g., using Gephi or D3.js) for interactive exploration of the graph.Improve NLP Capabilities:
Refine the natural language processing components to improve query interpretation and response accuracy.Scalability:
Optimize the solution for larger datasets and explore distributed graph processing for global-scale analytics.
This is accompanying explanation summarize the development process, challenges, and achievements of the LPI Agentic Application. I look forward to your feedback and questions!


Log in or sign up for Devpost to join the conversation.