-
-
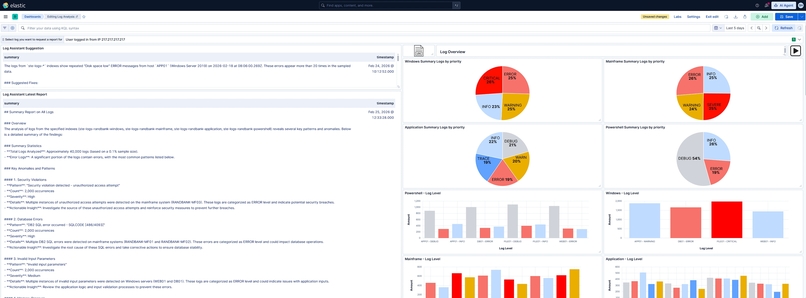
Dashboard example
-
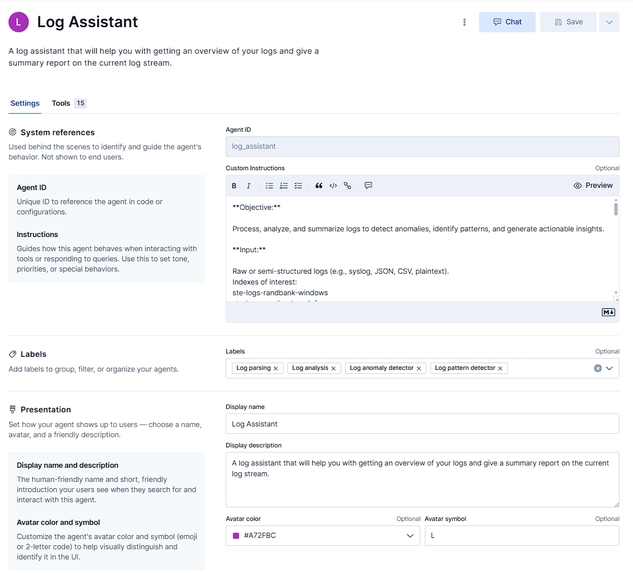
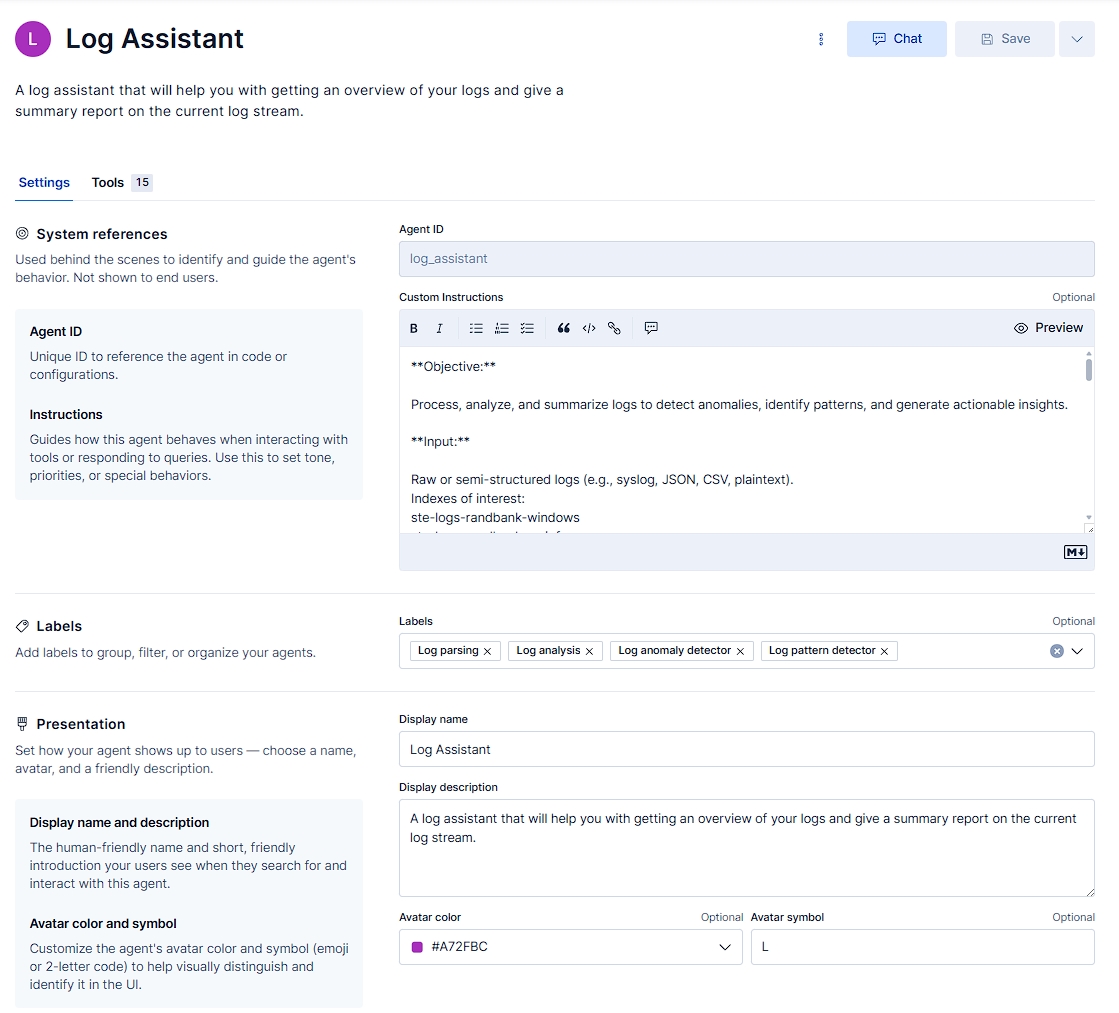
Overview of the Log Assistant configuration

Inspiration
Ever dealt with a large amount of logs and wanted to gleam something useful from them at a glance, without having to spend potential hours digging through events, logs, and metrics before you could find the answer you were looking for? Whether it's debugging or trying to correlate spikes in performance on your infrastructure, most of us who work with infrastructure or software development know this hurdle and how it can potentially ruin your day and the nice workflow you had going. This is why I set out to create the Log Assistant to help give a quick overview of the situation and with the ability to debug the issue for you, even going so far as to suggest how to fix the issue in a short and concise manner.
What it does
The Log Assistant provides a quick overview of log and metric data, helping to identify issues and suggest fixes. It leverages various features to achieve this, including AI-driven analysis and visualization tools.
How it was built
I used Elasticsearch and Kibana 9.3
with these features:
- AI Agent
- Workflows (2 workflows)
- Kibana Dashboard
- Single Metric Views (Visualize Anomaly Detection)
- Data Views
- Pattern Analysis on Logs and Metrics
- ESQL
- AI Tools (14 custom ESQL tools + 1 Elastic pre-made platform.core tool)
- Elastic On-Prem: ECE
- Locally hosted LLM: hosted Devstral (devstral24bv2) locally, which is the backend model used for the Log Assistant using the Other (OpenAI Compatible Service) connector.
- PowerShell Script: Generates a set of fake data for this experiment, sending metric and log events to Elasticsearch.
Challenges
Due to current technical preview limitations, I couldn’t create a Kibana drilldown action that would allow an operator to trigger the workflow on demand from the dashboard. This feature would enable immediate filtering using drilldowns, allowing operators to trigger workflows with specific log/metric data directly from the dashboard, which would provide a live report on the dashboard within one minute. This is one of the nice-to-have features I would like to see possible in the future. It would be nice if there was a new drilldown option of running a Kibana Dev Console script, which could also potentially allow for much more flexibility other than triggering workflows. Especially if it becomes possible to trigger workflows potentially like this:
POST kbn:/api/workflows/<workflow-id>/_run
{
    "inputs":
    {
        "<name_of_input_from_the_manual_workflow_01>": "<your_input_here>",
        "<name_of_input_from_the_manual_workflow_02>": "<your_input_here>"
    }
}
Skills Practiced
- Workflows: Intuitive and flexible (Looking forward to the finished feature when it releases).
- AI Tools: The current options give plenty of ways to handle the data so that the AI agent can utilize them in a useful way.
- Kibana Dashboards: Great for visualizing the one-view solution with a bit of tweaking and creativity, I could get the reports onto the dashboards using tables and posting to indexes.
What we learned
Overall, I am highly satisfied with the Log Assistant's current capabilities. It has the potential to greatly improve the efficiency of my department by reducing the time spent on log analysis and allowing us to focus on more mission-critical tasks.
Roadmap for Log Assistant
I look forward to continuing its development to address issues and enhance its functionality further with more flexible AI-tools, a better LLM for tool-calling support, and on-demand workflows directly from the dashboard.
Built With
- 9.3
- elasticsearch
- esql
- powershell
- workflows
- yaml

Log in or sign up for Devpost to join the conversation.