Inspiration
60% of Australian small businesses fail
within three years and most of them
signed a lease before they had any real
data. The decision of where to open is
often made on gut feel, Google Maps
searches, and word of mouth. Meanwhile,
McDonald's, Starbucks, and major retail
chains spend millions on location
intelligence consultants to answer the
exact same question before they commit to a
site.
We wanted to build the tool that gives any
entrepreneur the person opening their
first café, their first gym, their first
Japanese restaurant access to the same
data-driven location analysis, in under 5
minutes, before they sign anything.
What it does
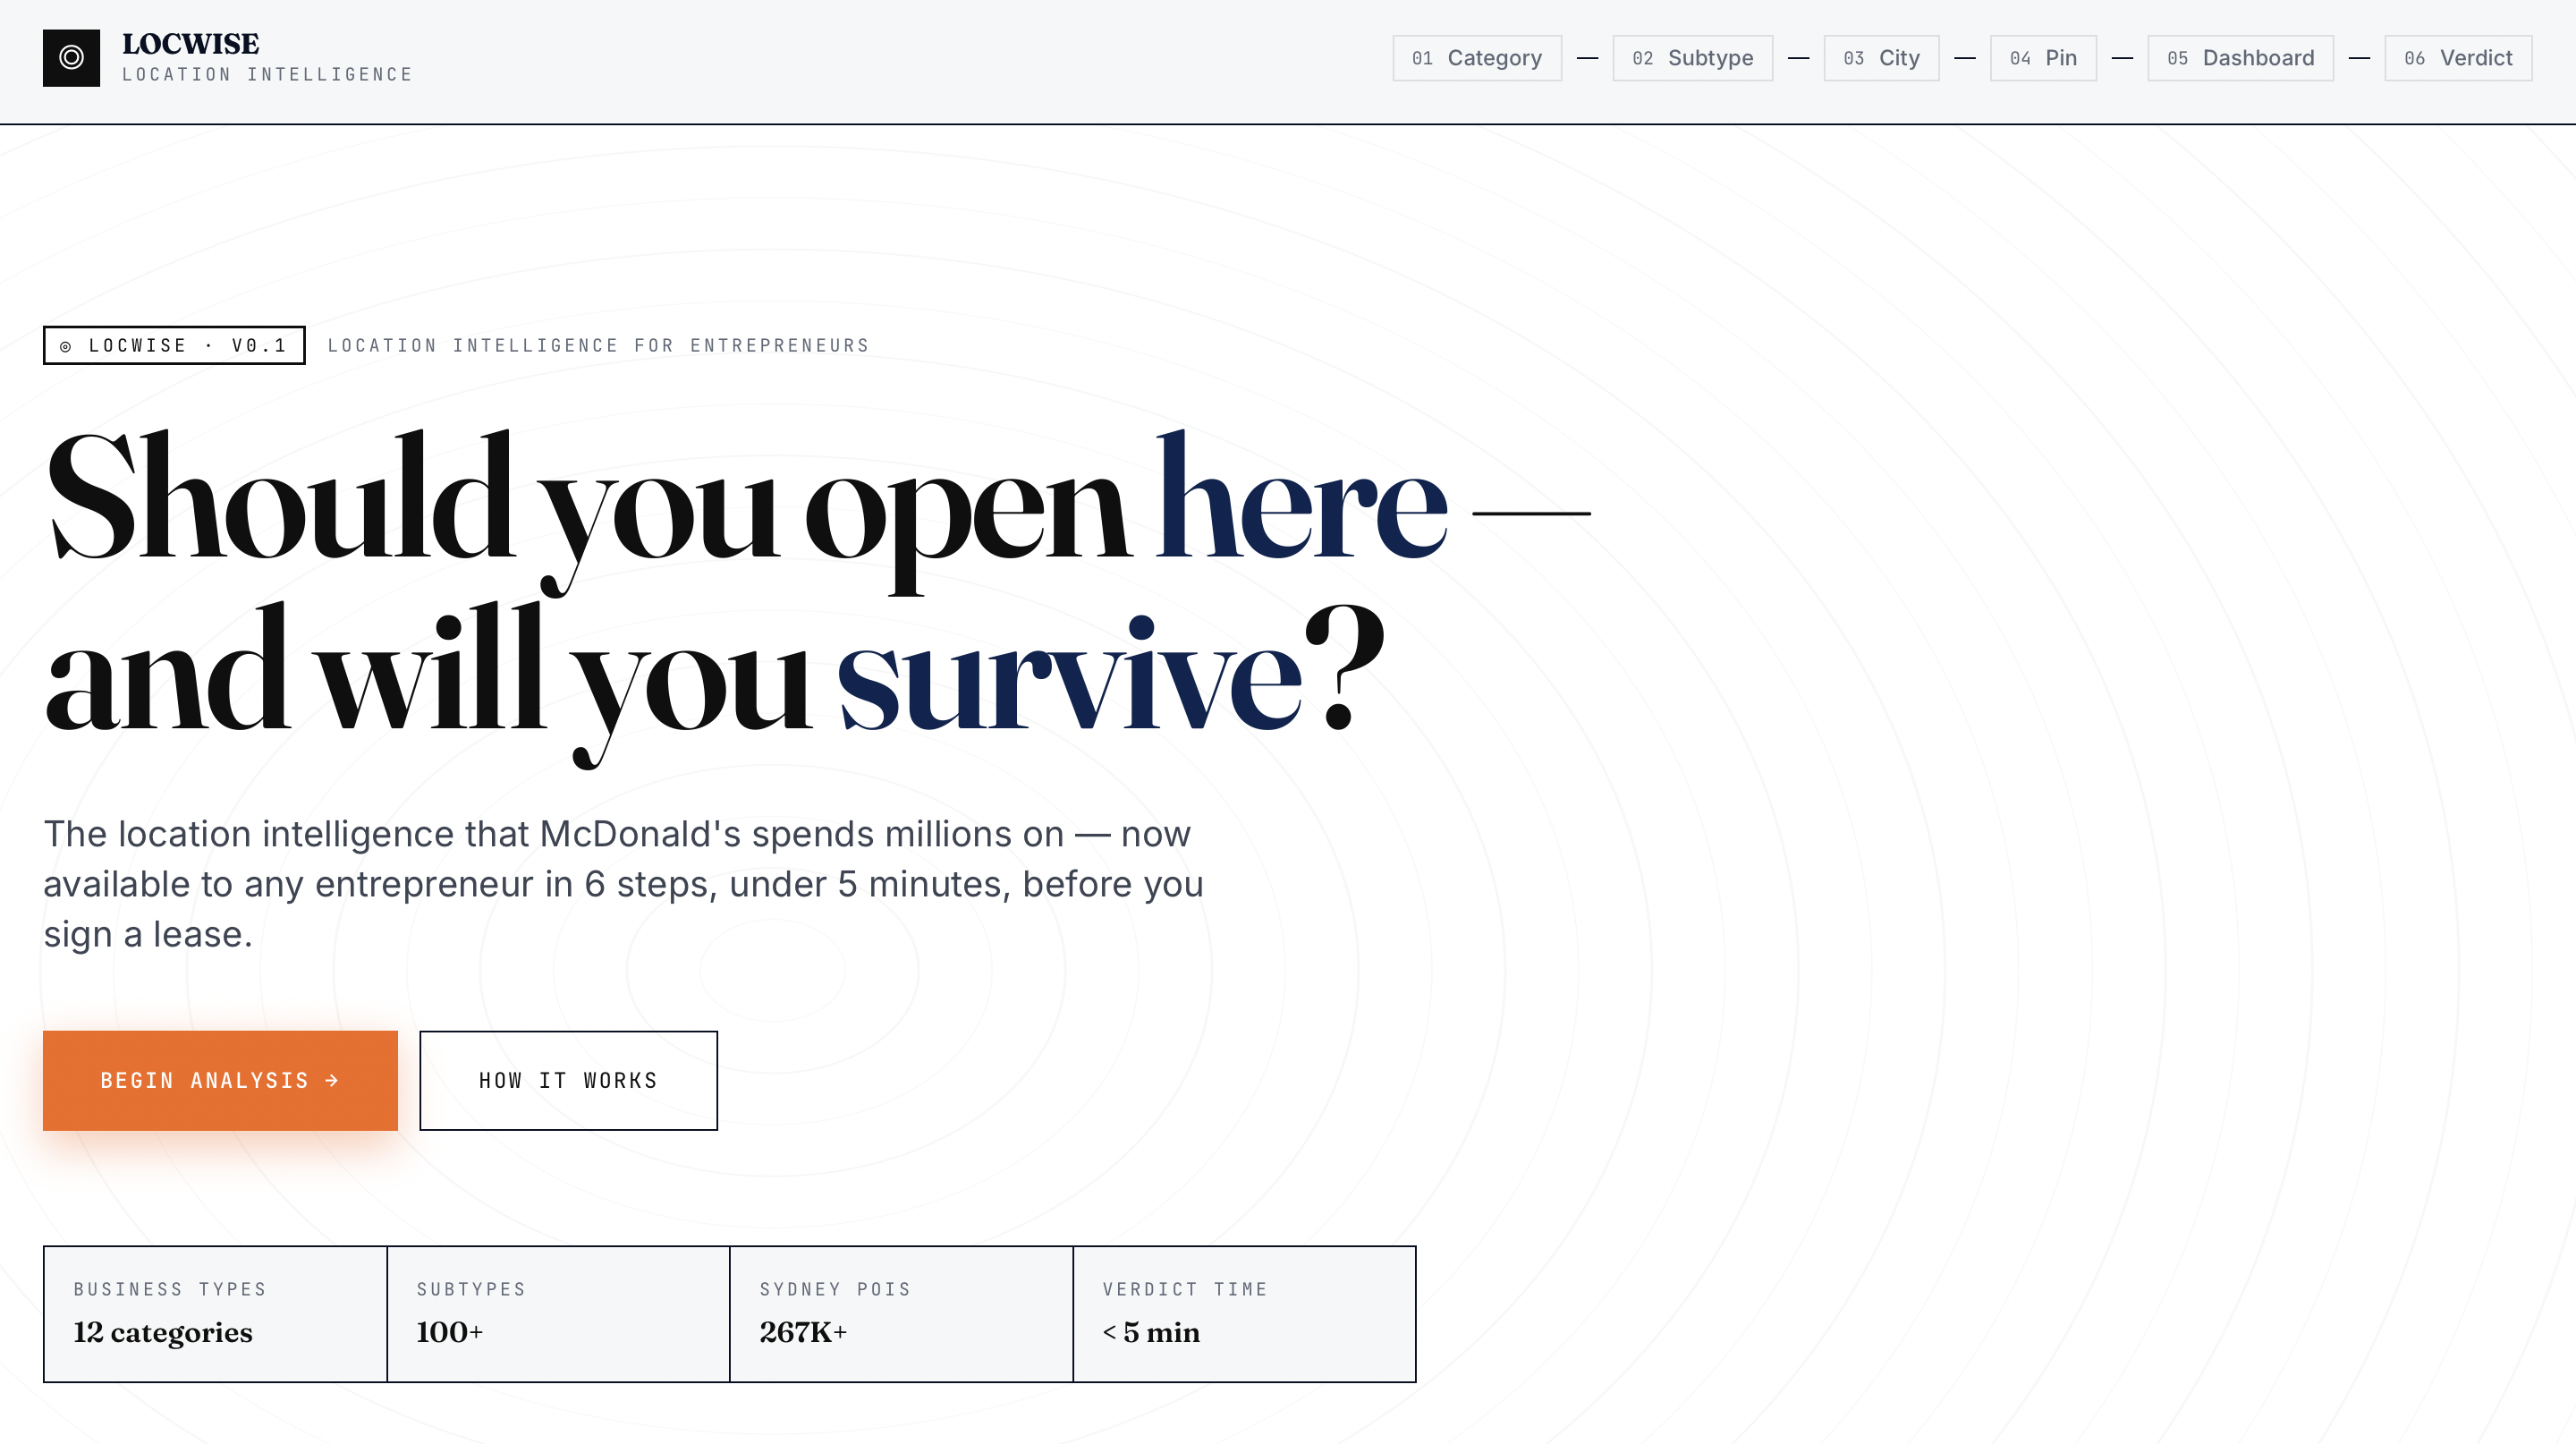
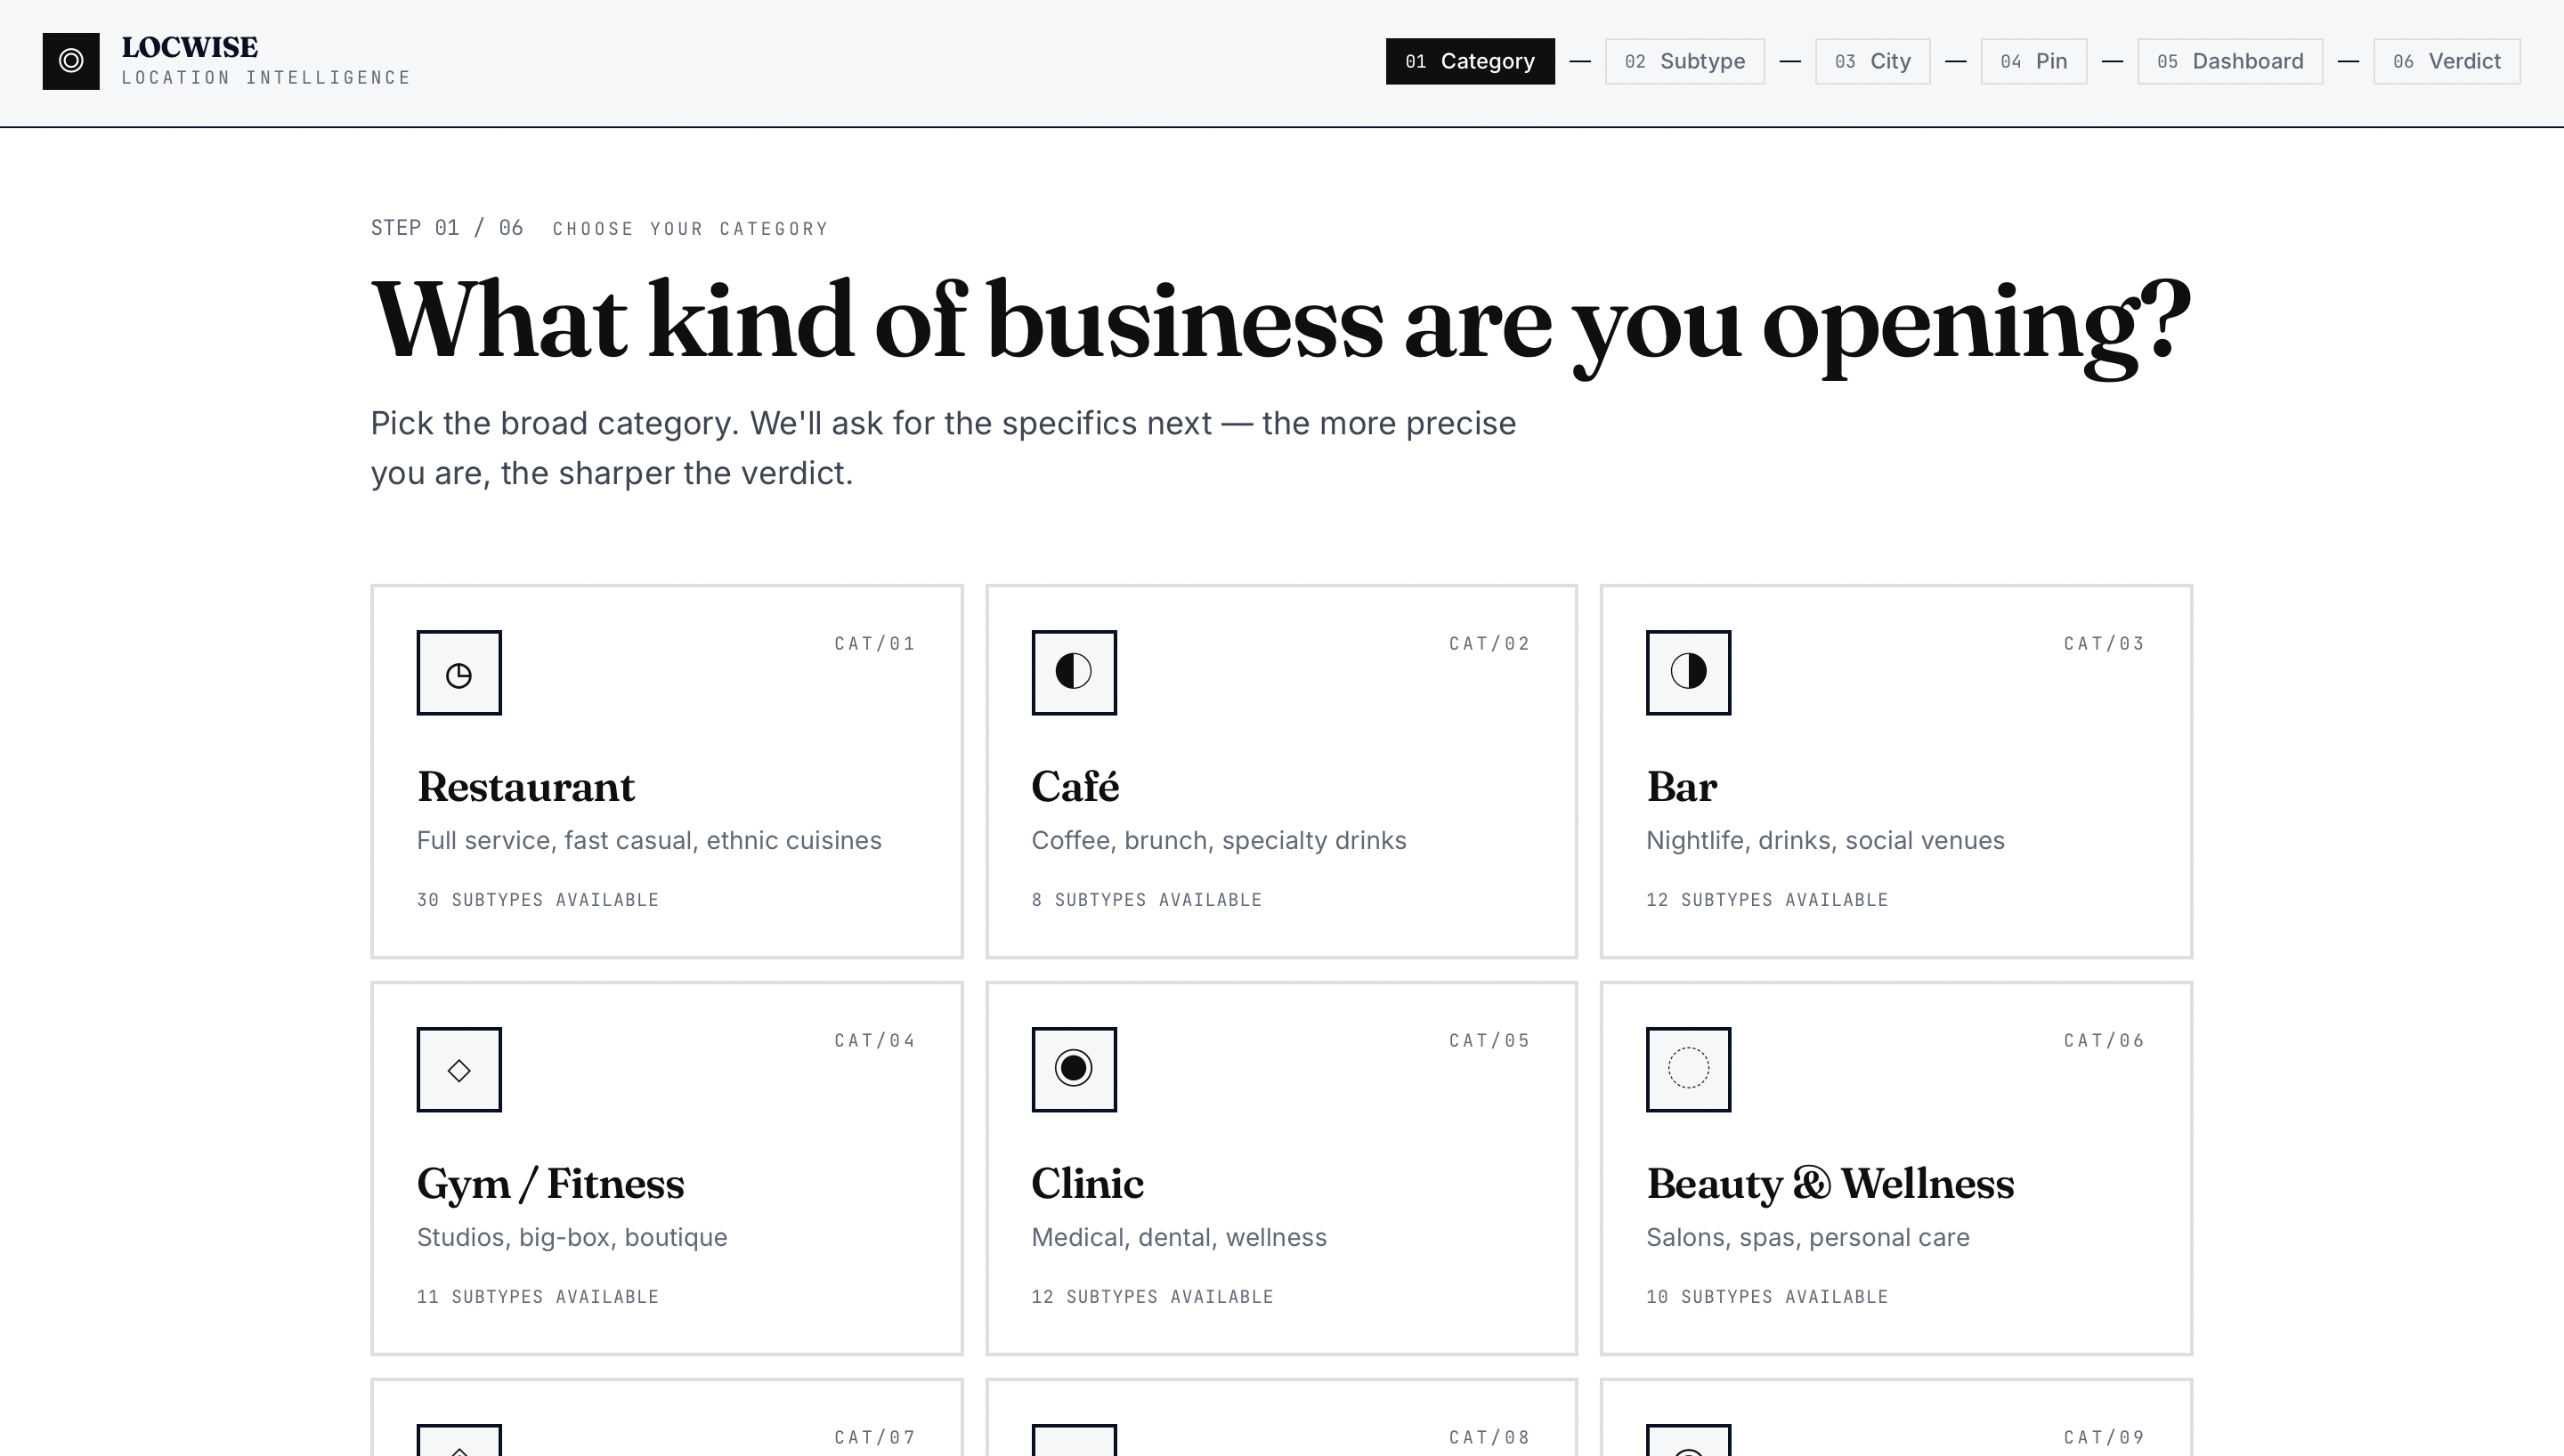
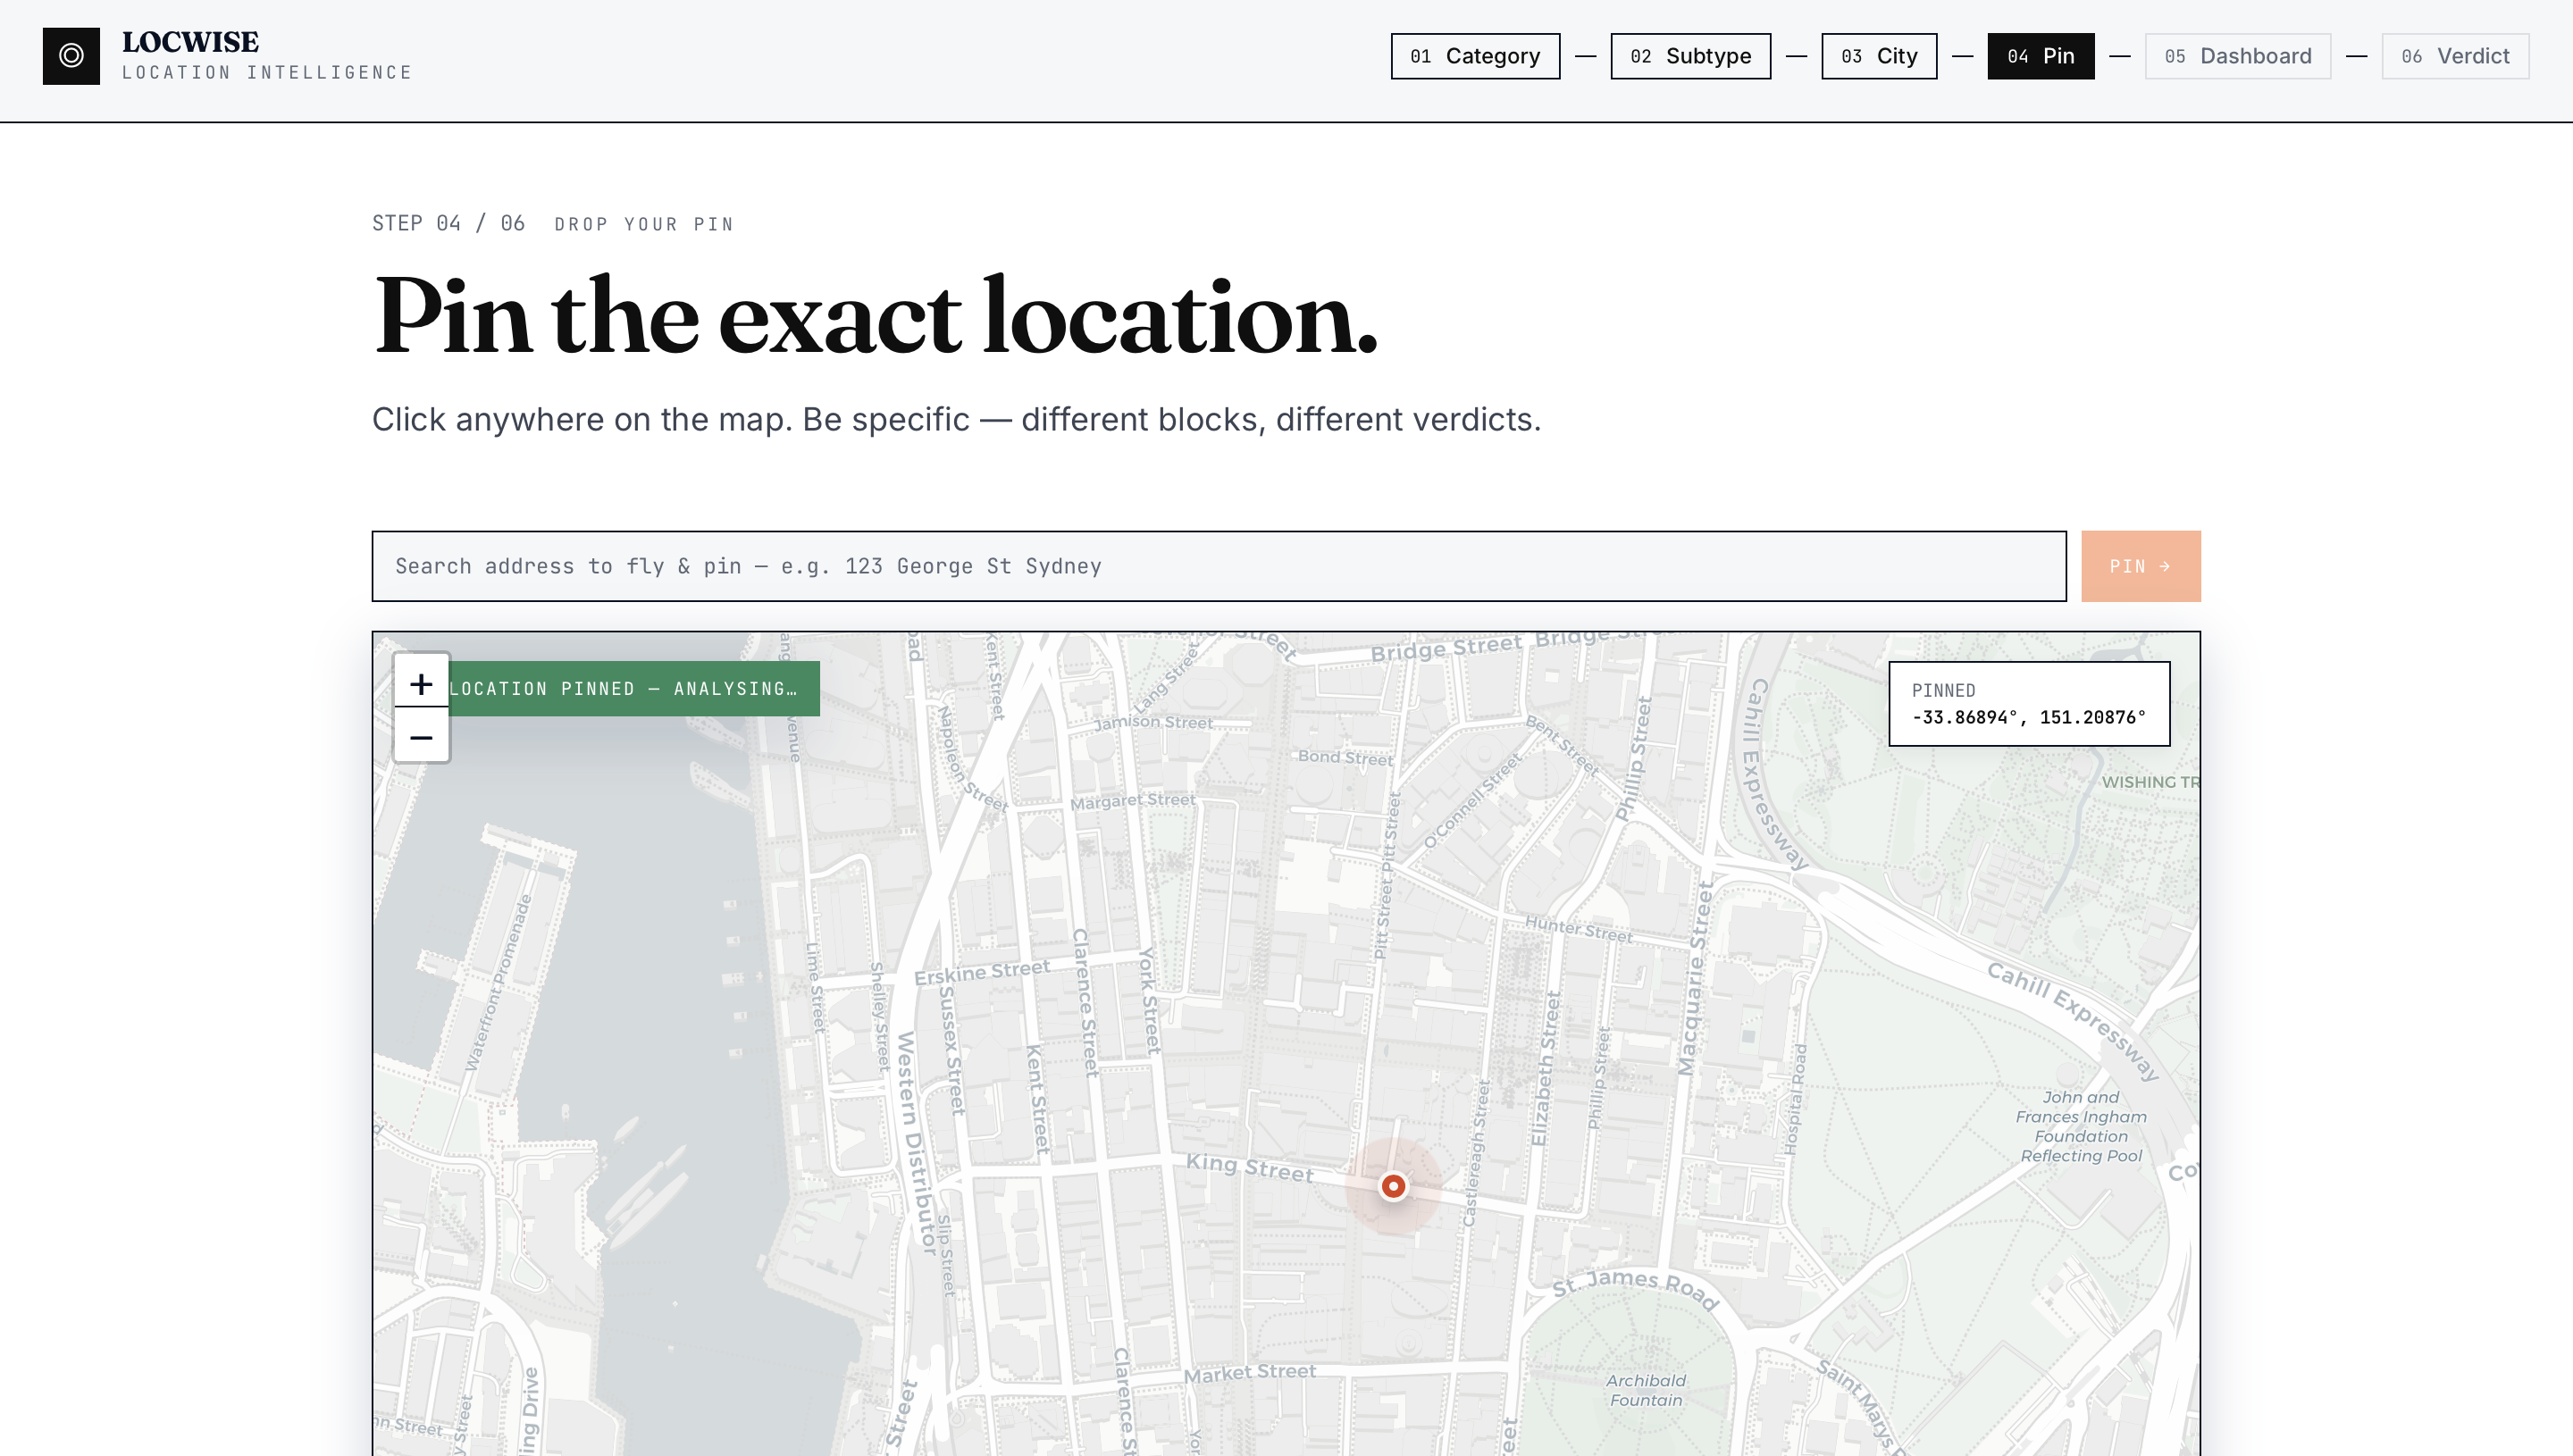
LOCWISE is a 6-step location intelligence
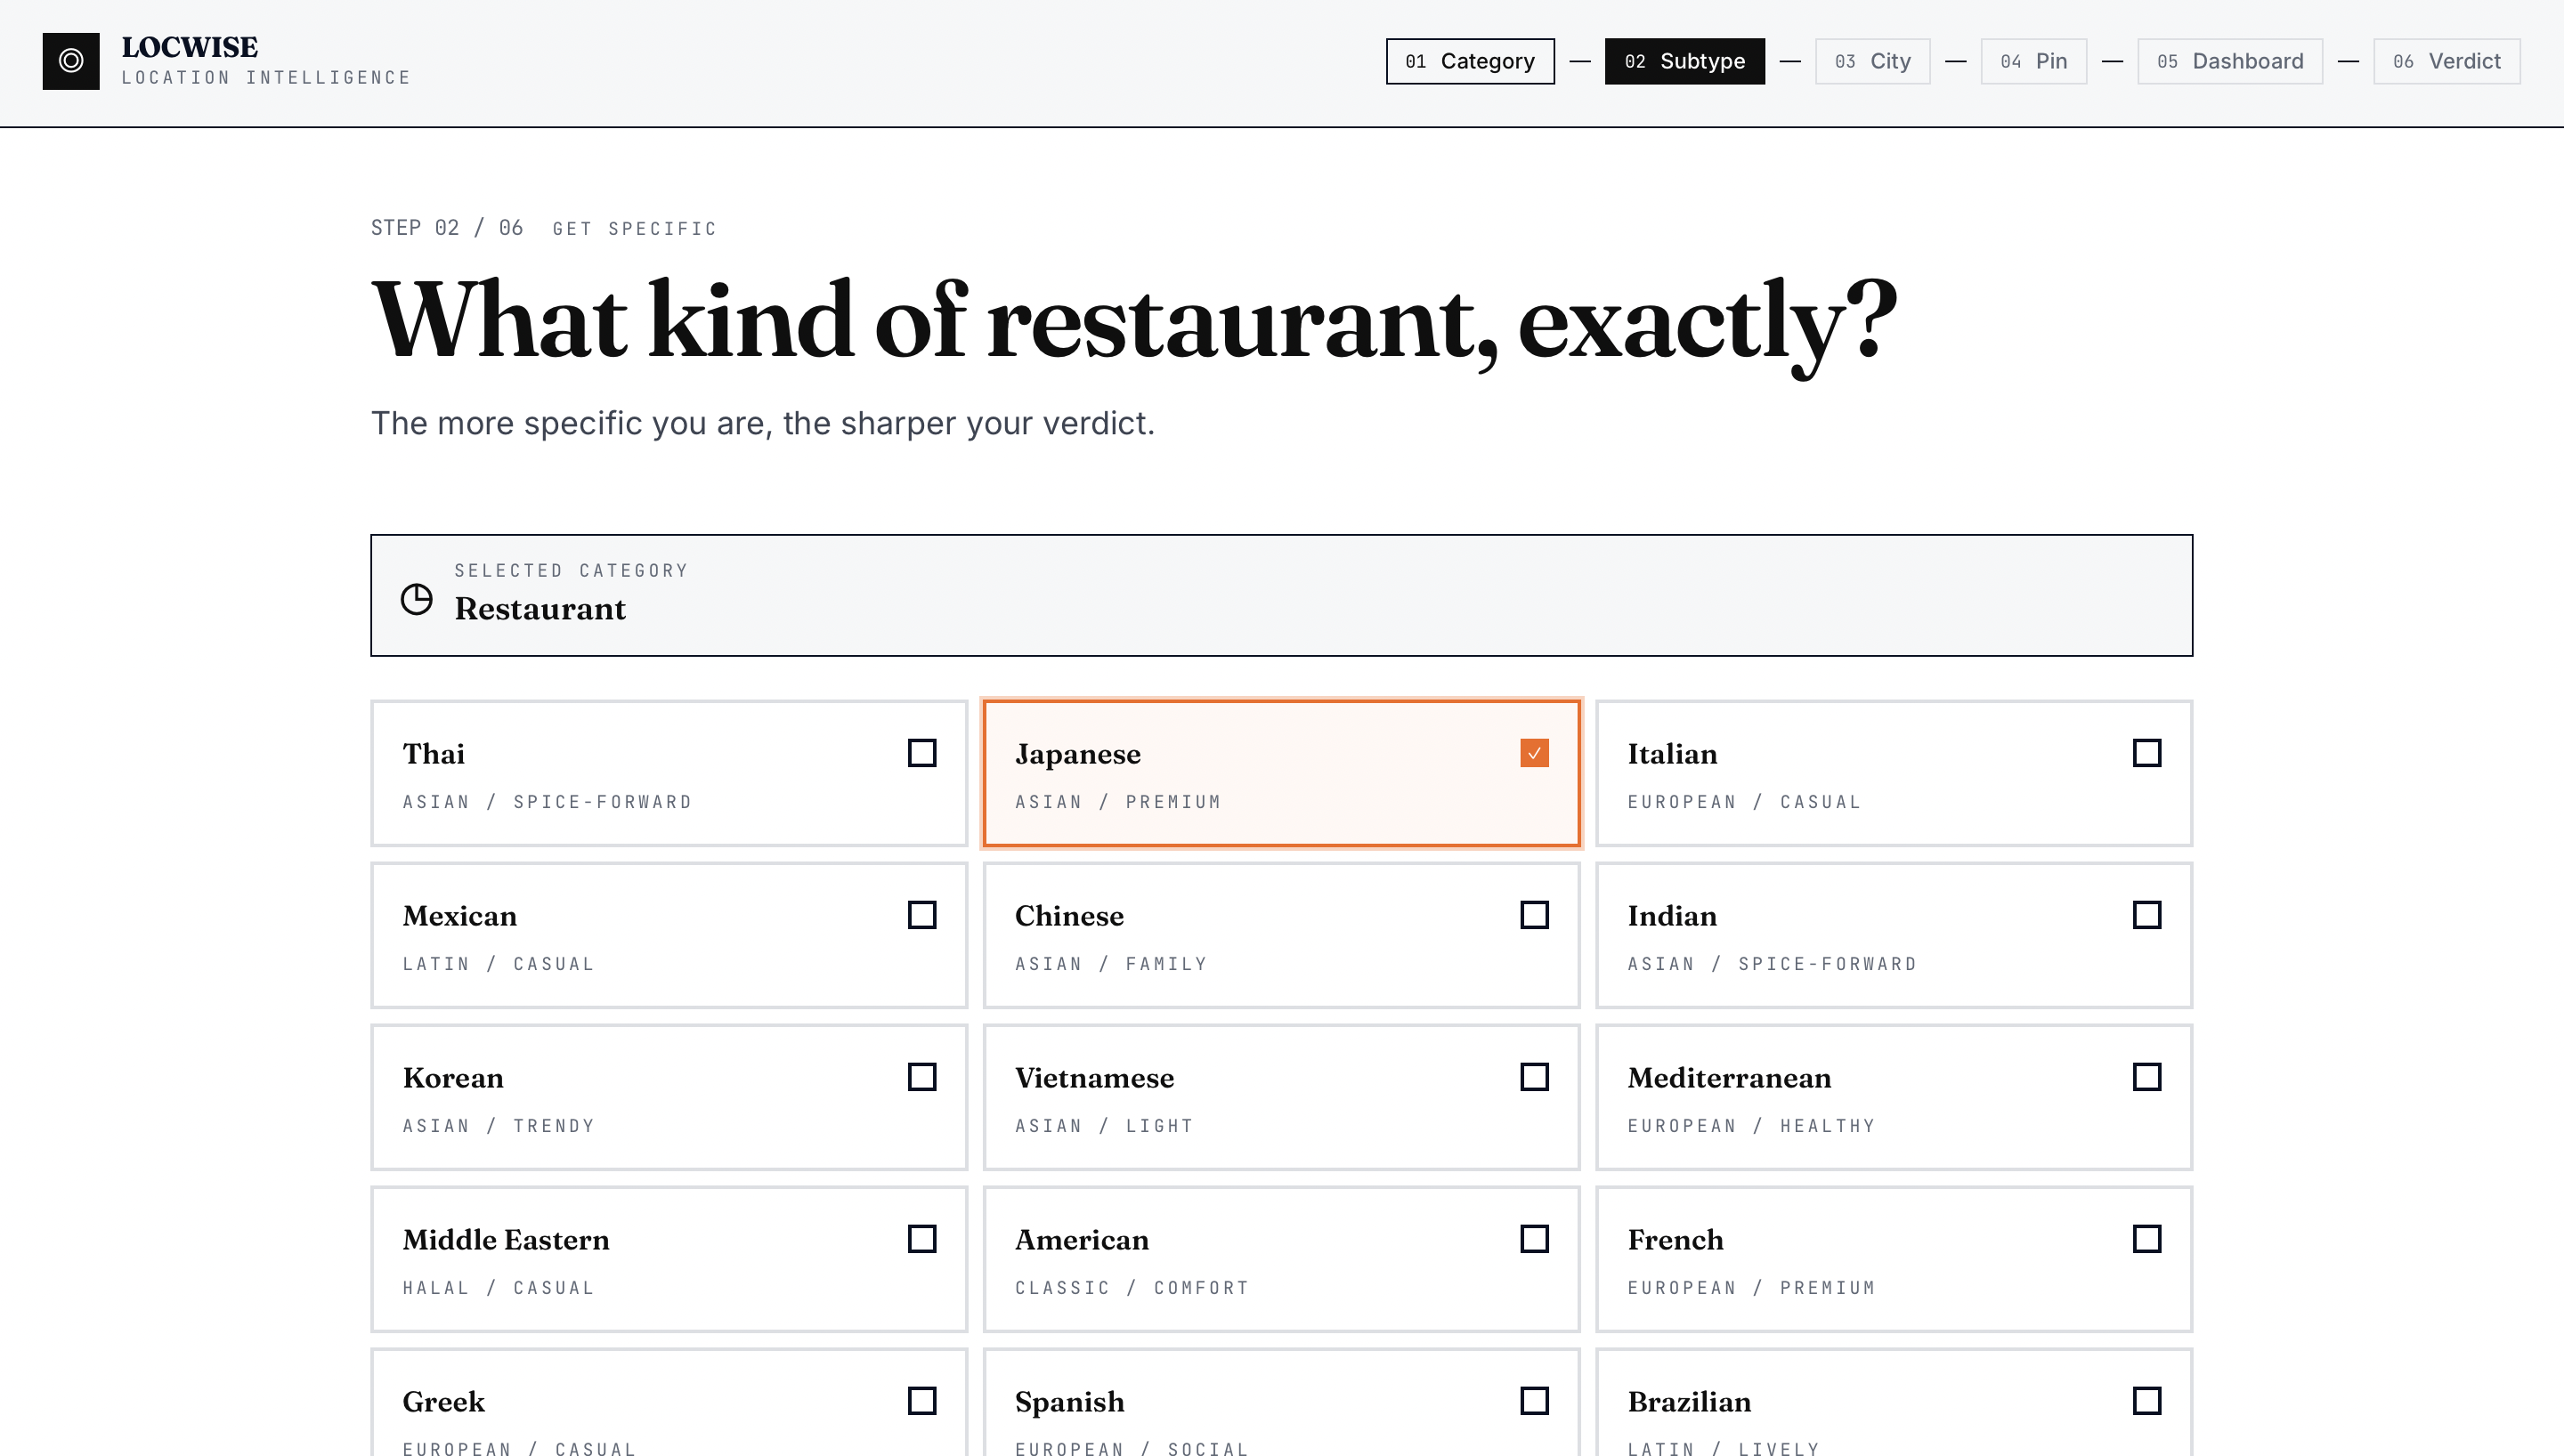
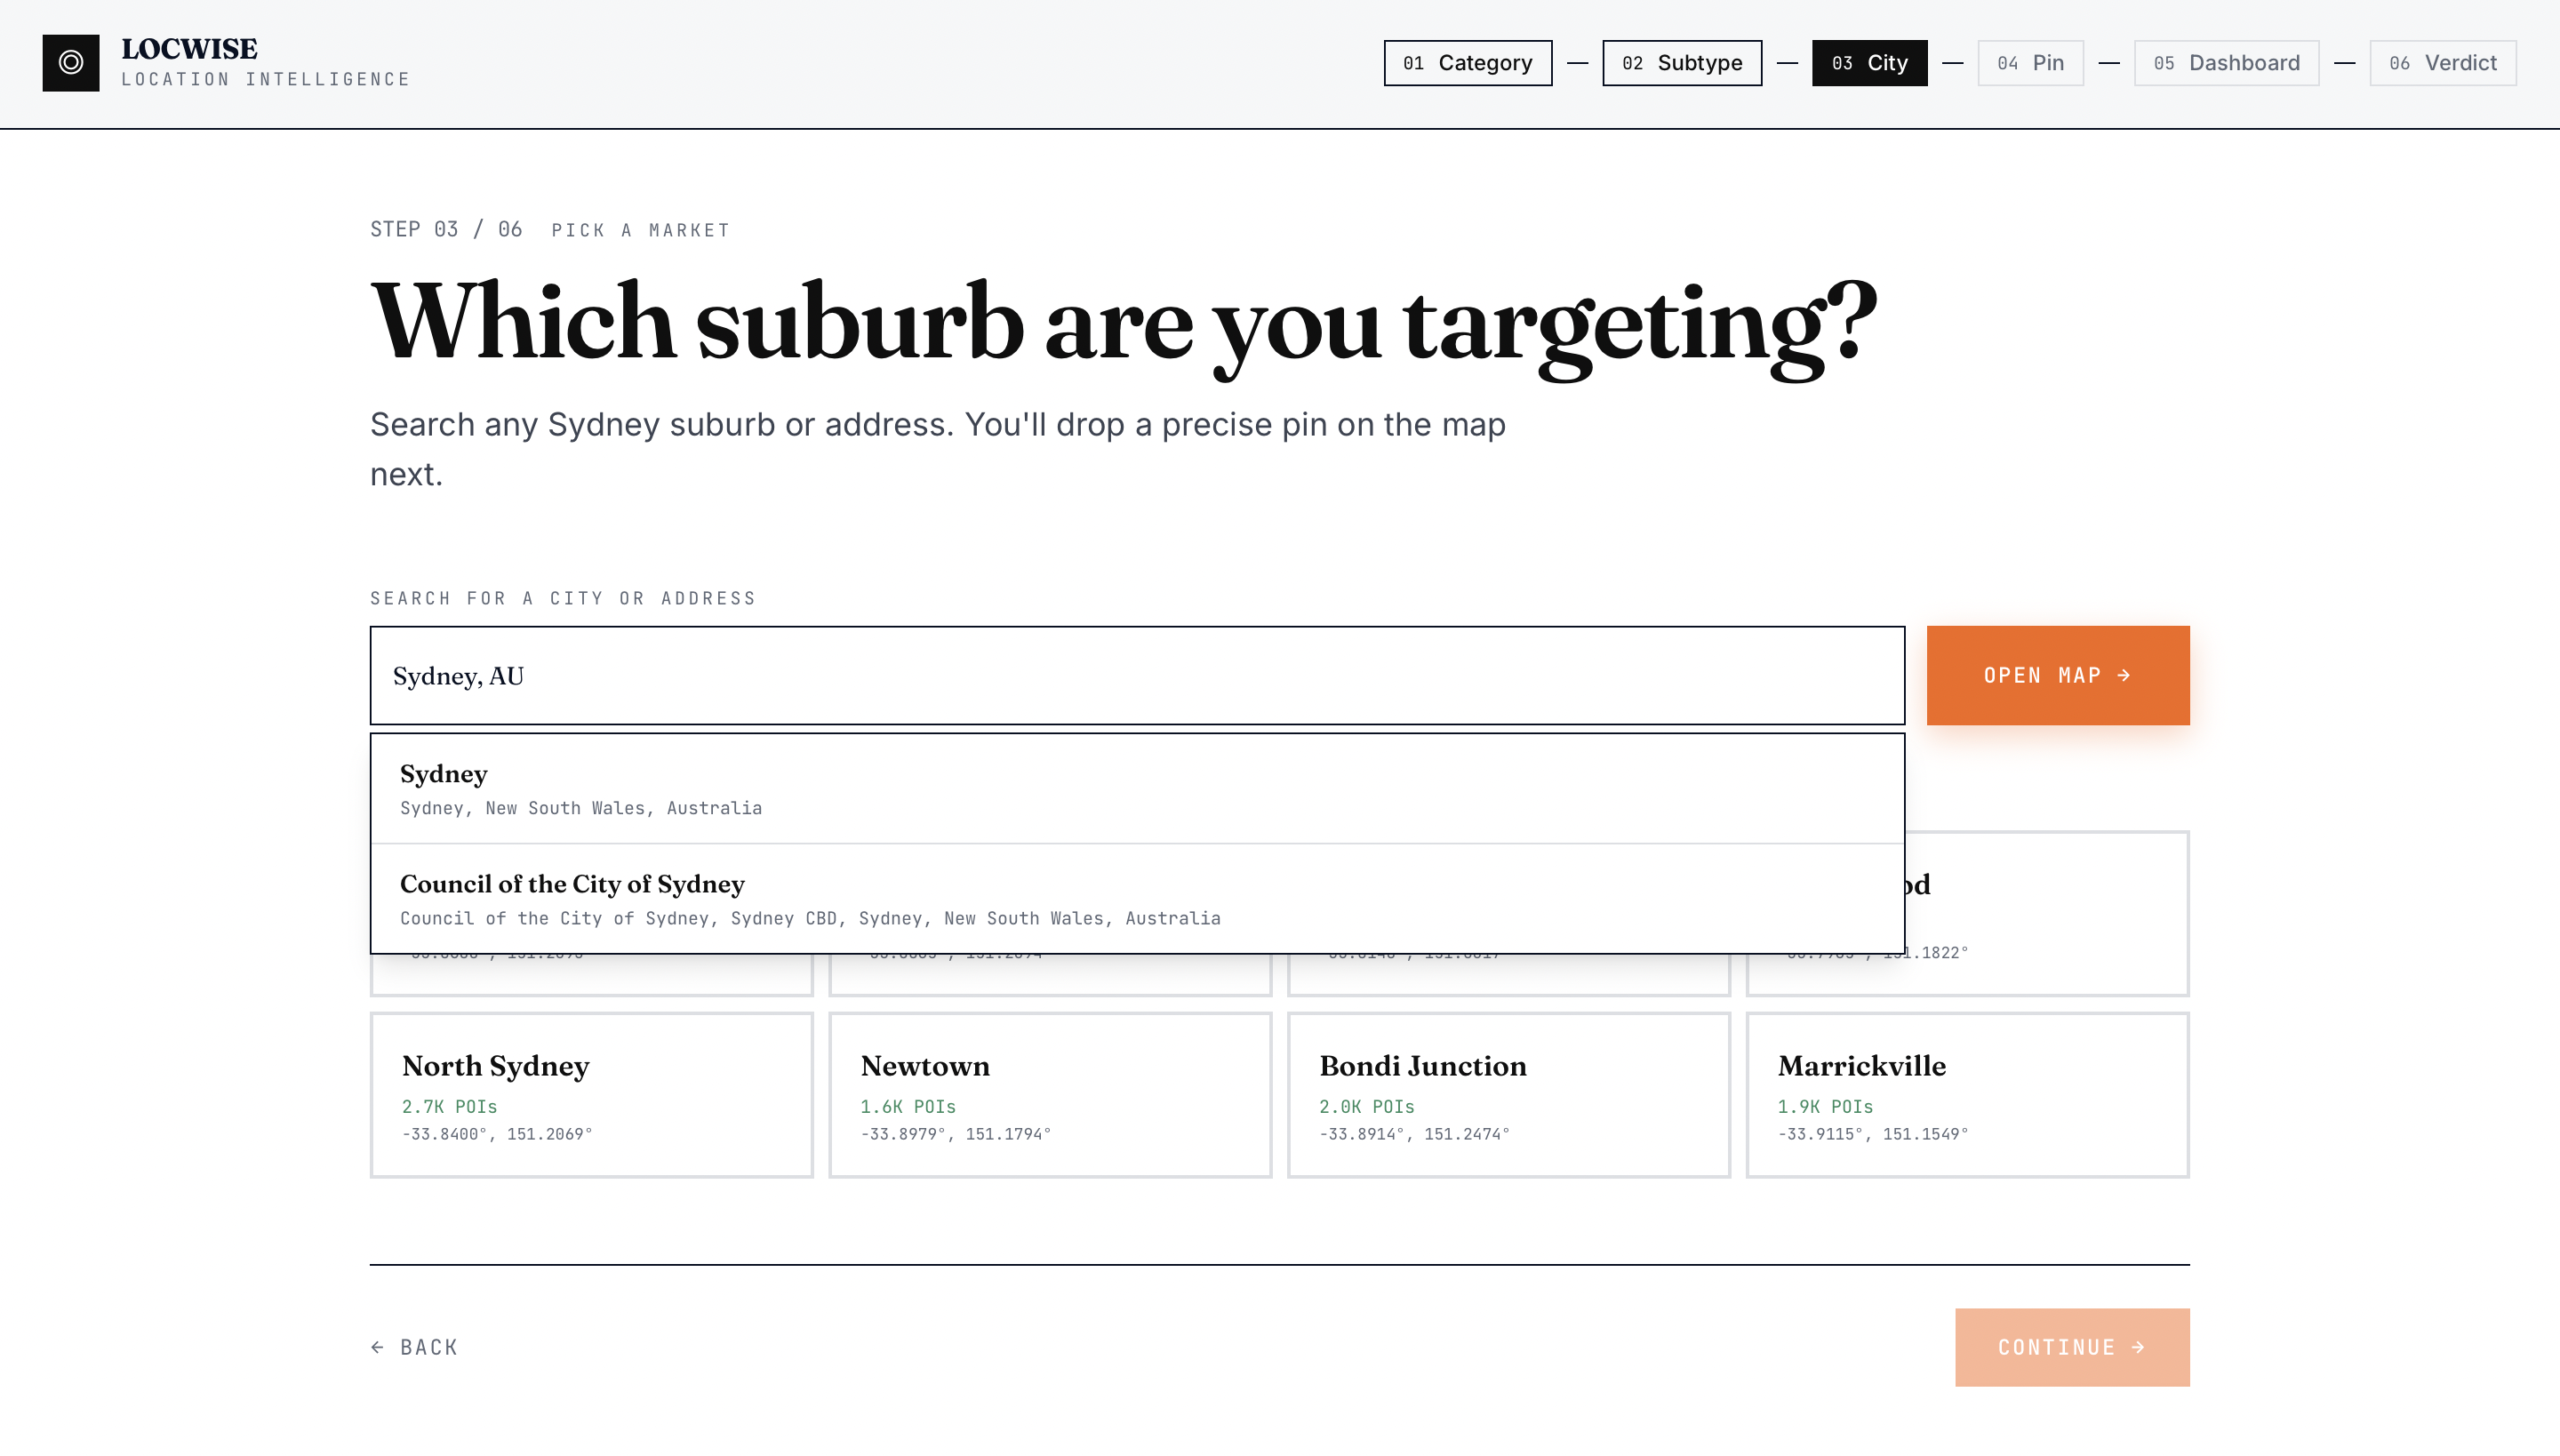
wizard for Sydney entrepreneurs. You tell
it what kind of business you're opening
(not just "restaurant" — specifically
"Japanese restaurant"), drop a pin on a
map, and within seconds it returns:
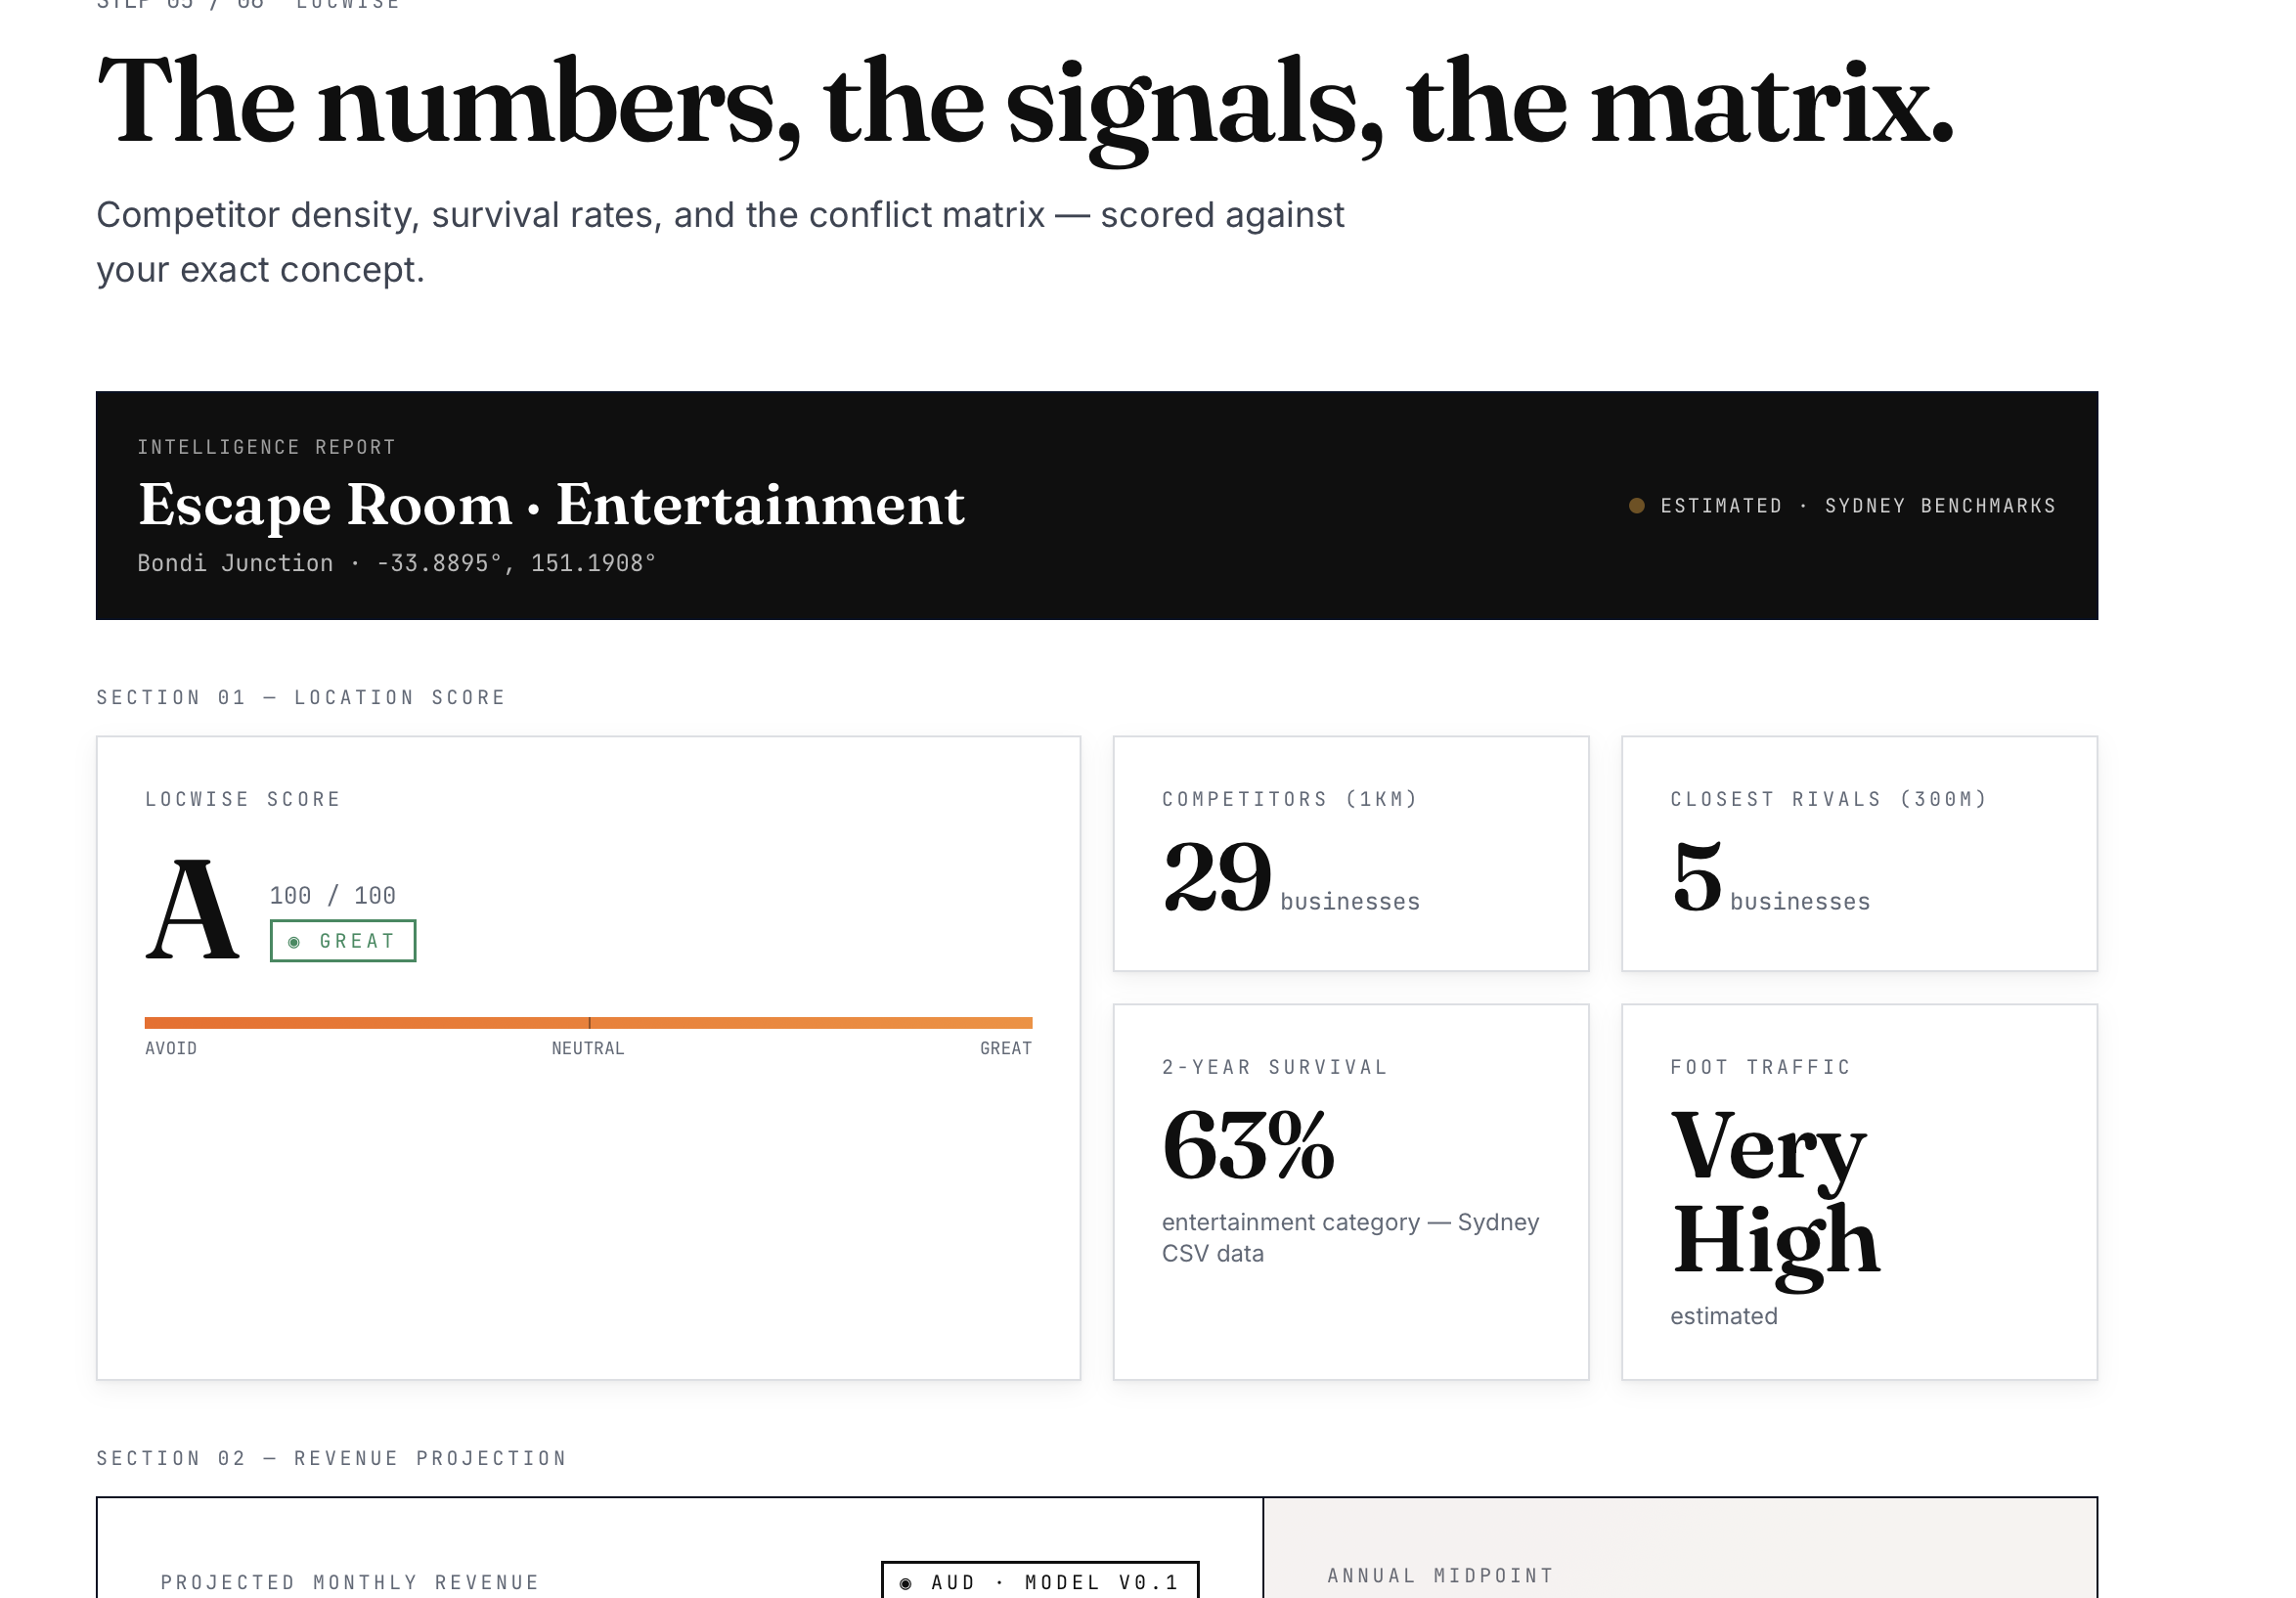
- A location score and grade (A–F) based on 267,000+ real Sydney POIs
- Competitor density direct rivals within
300m and 1km
- A conflict & synergy matrix which
nearby businesses help you (office towers →
lunchtime customers) and which hurt you
(competing cafés)
- Financial projections estimated monthly
revenue range, annual midpoint, and
break-even timeline in months - Market saturation index whether the
area is an opportunity or already
oversaturated - A plain-English recommendation built from
all the real data
- A PDF report exportable in one click for
investors and landlords
- A 3D floor plan visualisation scaled to your specific business type
How we built it
Frontend: React 18 + TypeScript + Vite,
with Framer Motion animations, shadcn/ui
components, and React Leaflet for maps. The
3D floor plan uses React Three Fiber +
Three.js. The wizard is a 6-step state
machine controlled entirely in Index.tsx.
Backend: Python Flask API serving a
267,000-row dataset of Sydney POIs (sourced
from Foursquare's open taxonomy, stored as
Parquet for fast startup). Spatial queries
use Haversine distance no external
geospatial libraries required. Key computed
metrics include:
- Market Saturation Index: competitor
density relative to category baseline
- Spatial Decay Score: distance-weighted
competition pressure
- Competitive Moat Score: 0–100 measure of
defensibility
- Break-even months: derived from projected
revenue vs. estimated rent
Scoring: A two-layer system the backend
produces a live 0–100 score for the grade
dial; the frontend conflict matrix
independently explains why using
hand-authored synergy/conflict rules per
business category.
Challenges we ran into
The two-score conflict: The frontend
conflict matrix (−100 to +100 points) and
backend live score (0–100) are independent
systems. Early on they contradicted each
other — a location would show "Grade A"
from the backend but "AVOID" from the
matrix. We had to clearly separate their
roles: live score drives the grade dial,
matrix explains the reasoning.
Label mismatch killing the matrix: The
backend sends signal labels like "Office
Towers" and "Gyms & Studios" but the
frontend mapping used "Office Buildings"
and "Fitness" — so every signal mapped to
null and the matrix always showed 0 points.
Debugging this required tracing data
through three files.
Accomplishments that we're proud of
- A genuinely working spatial analysis
engine over 267K real Sydney businesses,
running locally in under 2 seconds per query
- clean and manage big data
- A conflict & synergy matrix that produces
real, explainable verdicts not just a
score - A PDF export that generates a full
investor-ready report with inline conflict matrix, competitor list, and financial projections, using only the browser's
native print API - Going from mock data to live data with
zero UX change — the user never sees the
transition
- clean and manage big data
What we learned
- Location data is meaningless without
specificity "restaurant" and "Japanese
restaurant" produce completely different competitive landscapes
- The gap between "it works with mock data"
and "it works with live data" is where
most bugs live CORS, label mismatches, normalisation errors all hide behind silent fallbacks - Two independent scoring systems need clearly separated roles, or they undermine each other's credibility
- Browser-native PDF printing, when paired
with carefully written HTML and @media
print CSS, is a surprisingly capable export solution, no server-side PDF library
needed - Three.js in React requires careful
attention to container sizing; a single
missing CSS class can make an entire 3D scene invisible
- The gap between "it works with mock data"
and "it works with live data" is where
What's next for LOCWISE
- Multi-city expansion: Melbourne,
Brisbane, Perth — same engine, new datasets
- Lease comparison mode: drop two pins, get
a head-to-head verdict
- Time-series analysis: see how competitor density in an area has changed over 3 years
- Foot traffic integration: connect real
pedestrian count data to validate the proxy
scores
- Saved reports dashboard: create an
account, save analyses, track locations
over time - Mobile-first redesign: the wizard works
on desktop; a native mobile experience
would open it up to entrepreneurs scouting locations in the field - Claude-powered narrative: when an API key
is available, stream a personalised
500-word recommendation that references the specific competitors by name
- Lease comparison mode: drop two pins, get
a head-to-head verdict
Built With
- css
- jupyternotebook
- python
- react
- typescript
