-
-
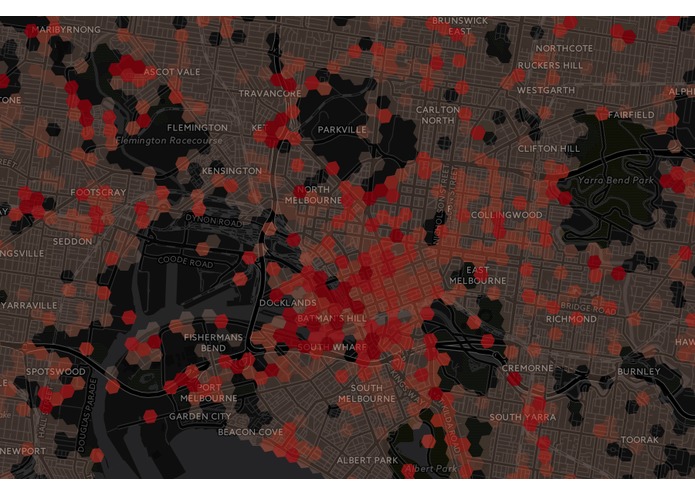
Melbourne CBD address increases
-
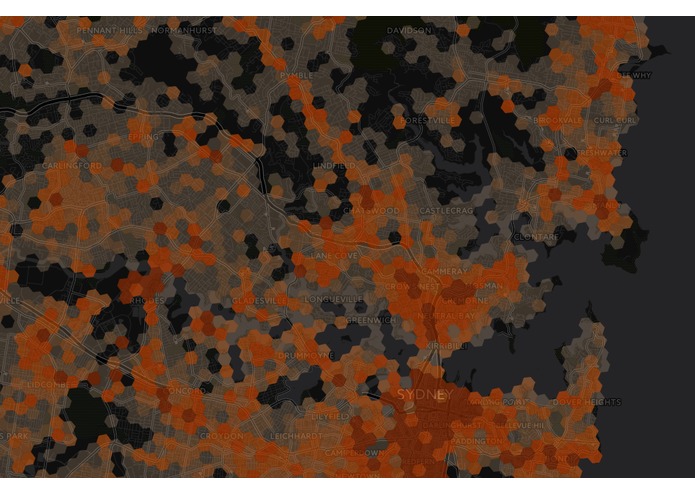
Sydney North Shore new address volumes
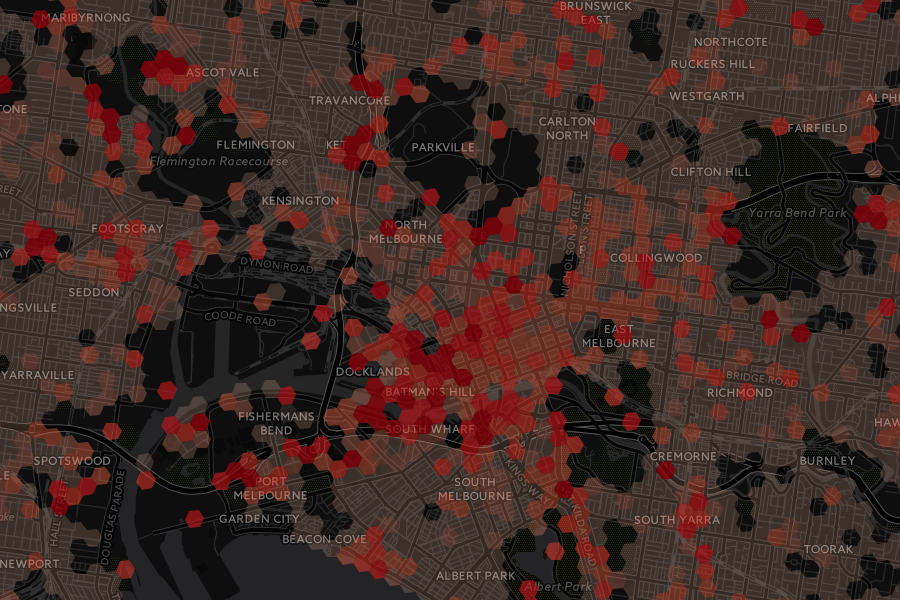
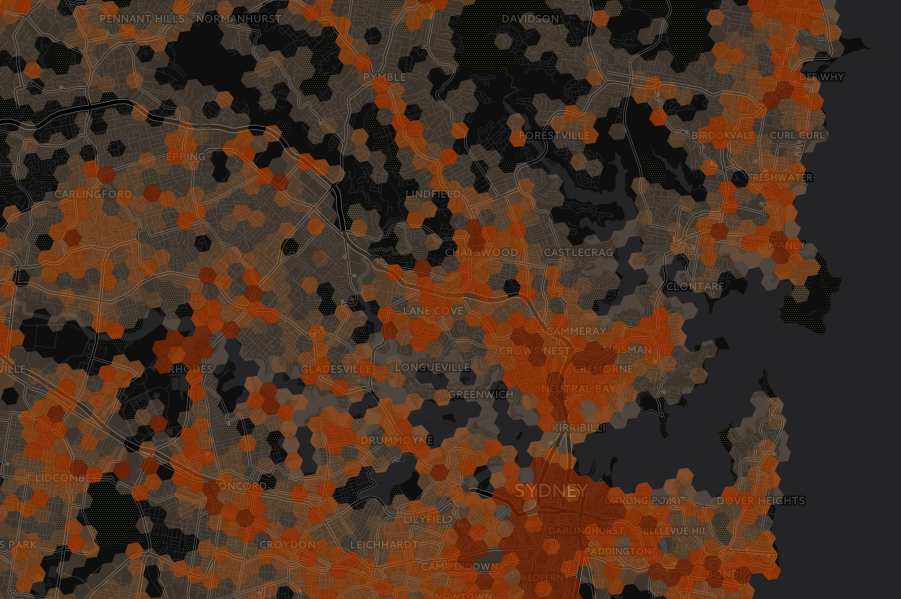
City Growth shows how Australian cities have grown over time - from the national view, right down to the suburb level.
Using PSMA G-NAF address locations and their creation dates as a proxy for new housing - this visualisation shows the percentage and volume increase in addresses from 2010 to 2015.
Worth noting - the final result is indicative only as G-NAF address are considered new when they are either brand new or if there is one of a number of changes to an G-NAF address (e.g. 10 Smyth St is changed to 10 Smith St). To counter this issue small changes in each hex area have been excluded. This issue is most noticeable where a suburb changes it's name - all addresses in the suburb are then considered new (e.g. Avalon in Sydney).
Prize category
PSMA best use of location information
Data used
Technology
Data was prepped using a combination of the gnaf-loader and new code in Postgres/PostGIS that generates hexagons on the fly.
The frontend is delivered using a Python/Flask app - with the interactive spatial data being delivered as GeoJSON from PostGIS into a Leaflet.js based web page.
Code
The code is in GitHub here
And the Postgres database schema used is here - for those too lazy to run the 2-3 hour data processing :-)

Log in or sign up for Devpost to join the conversation.