-
-
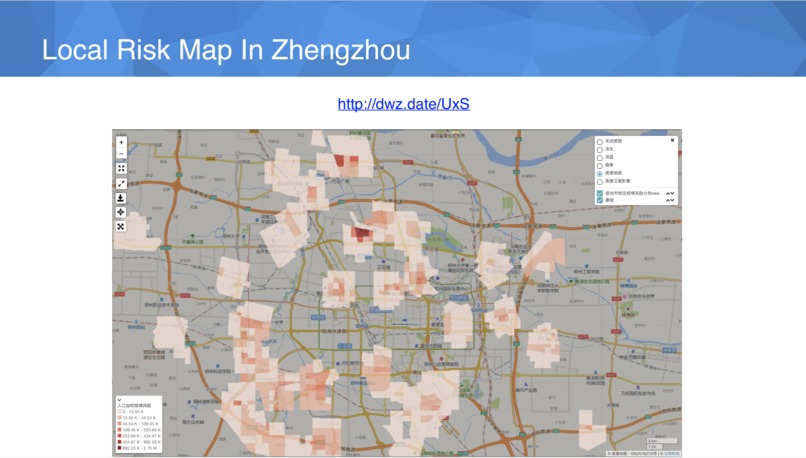
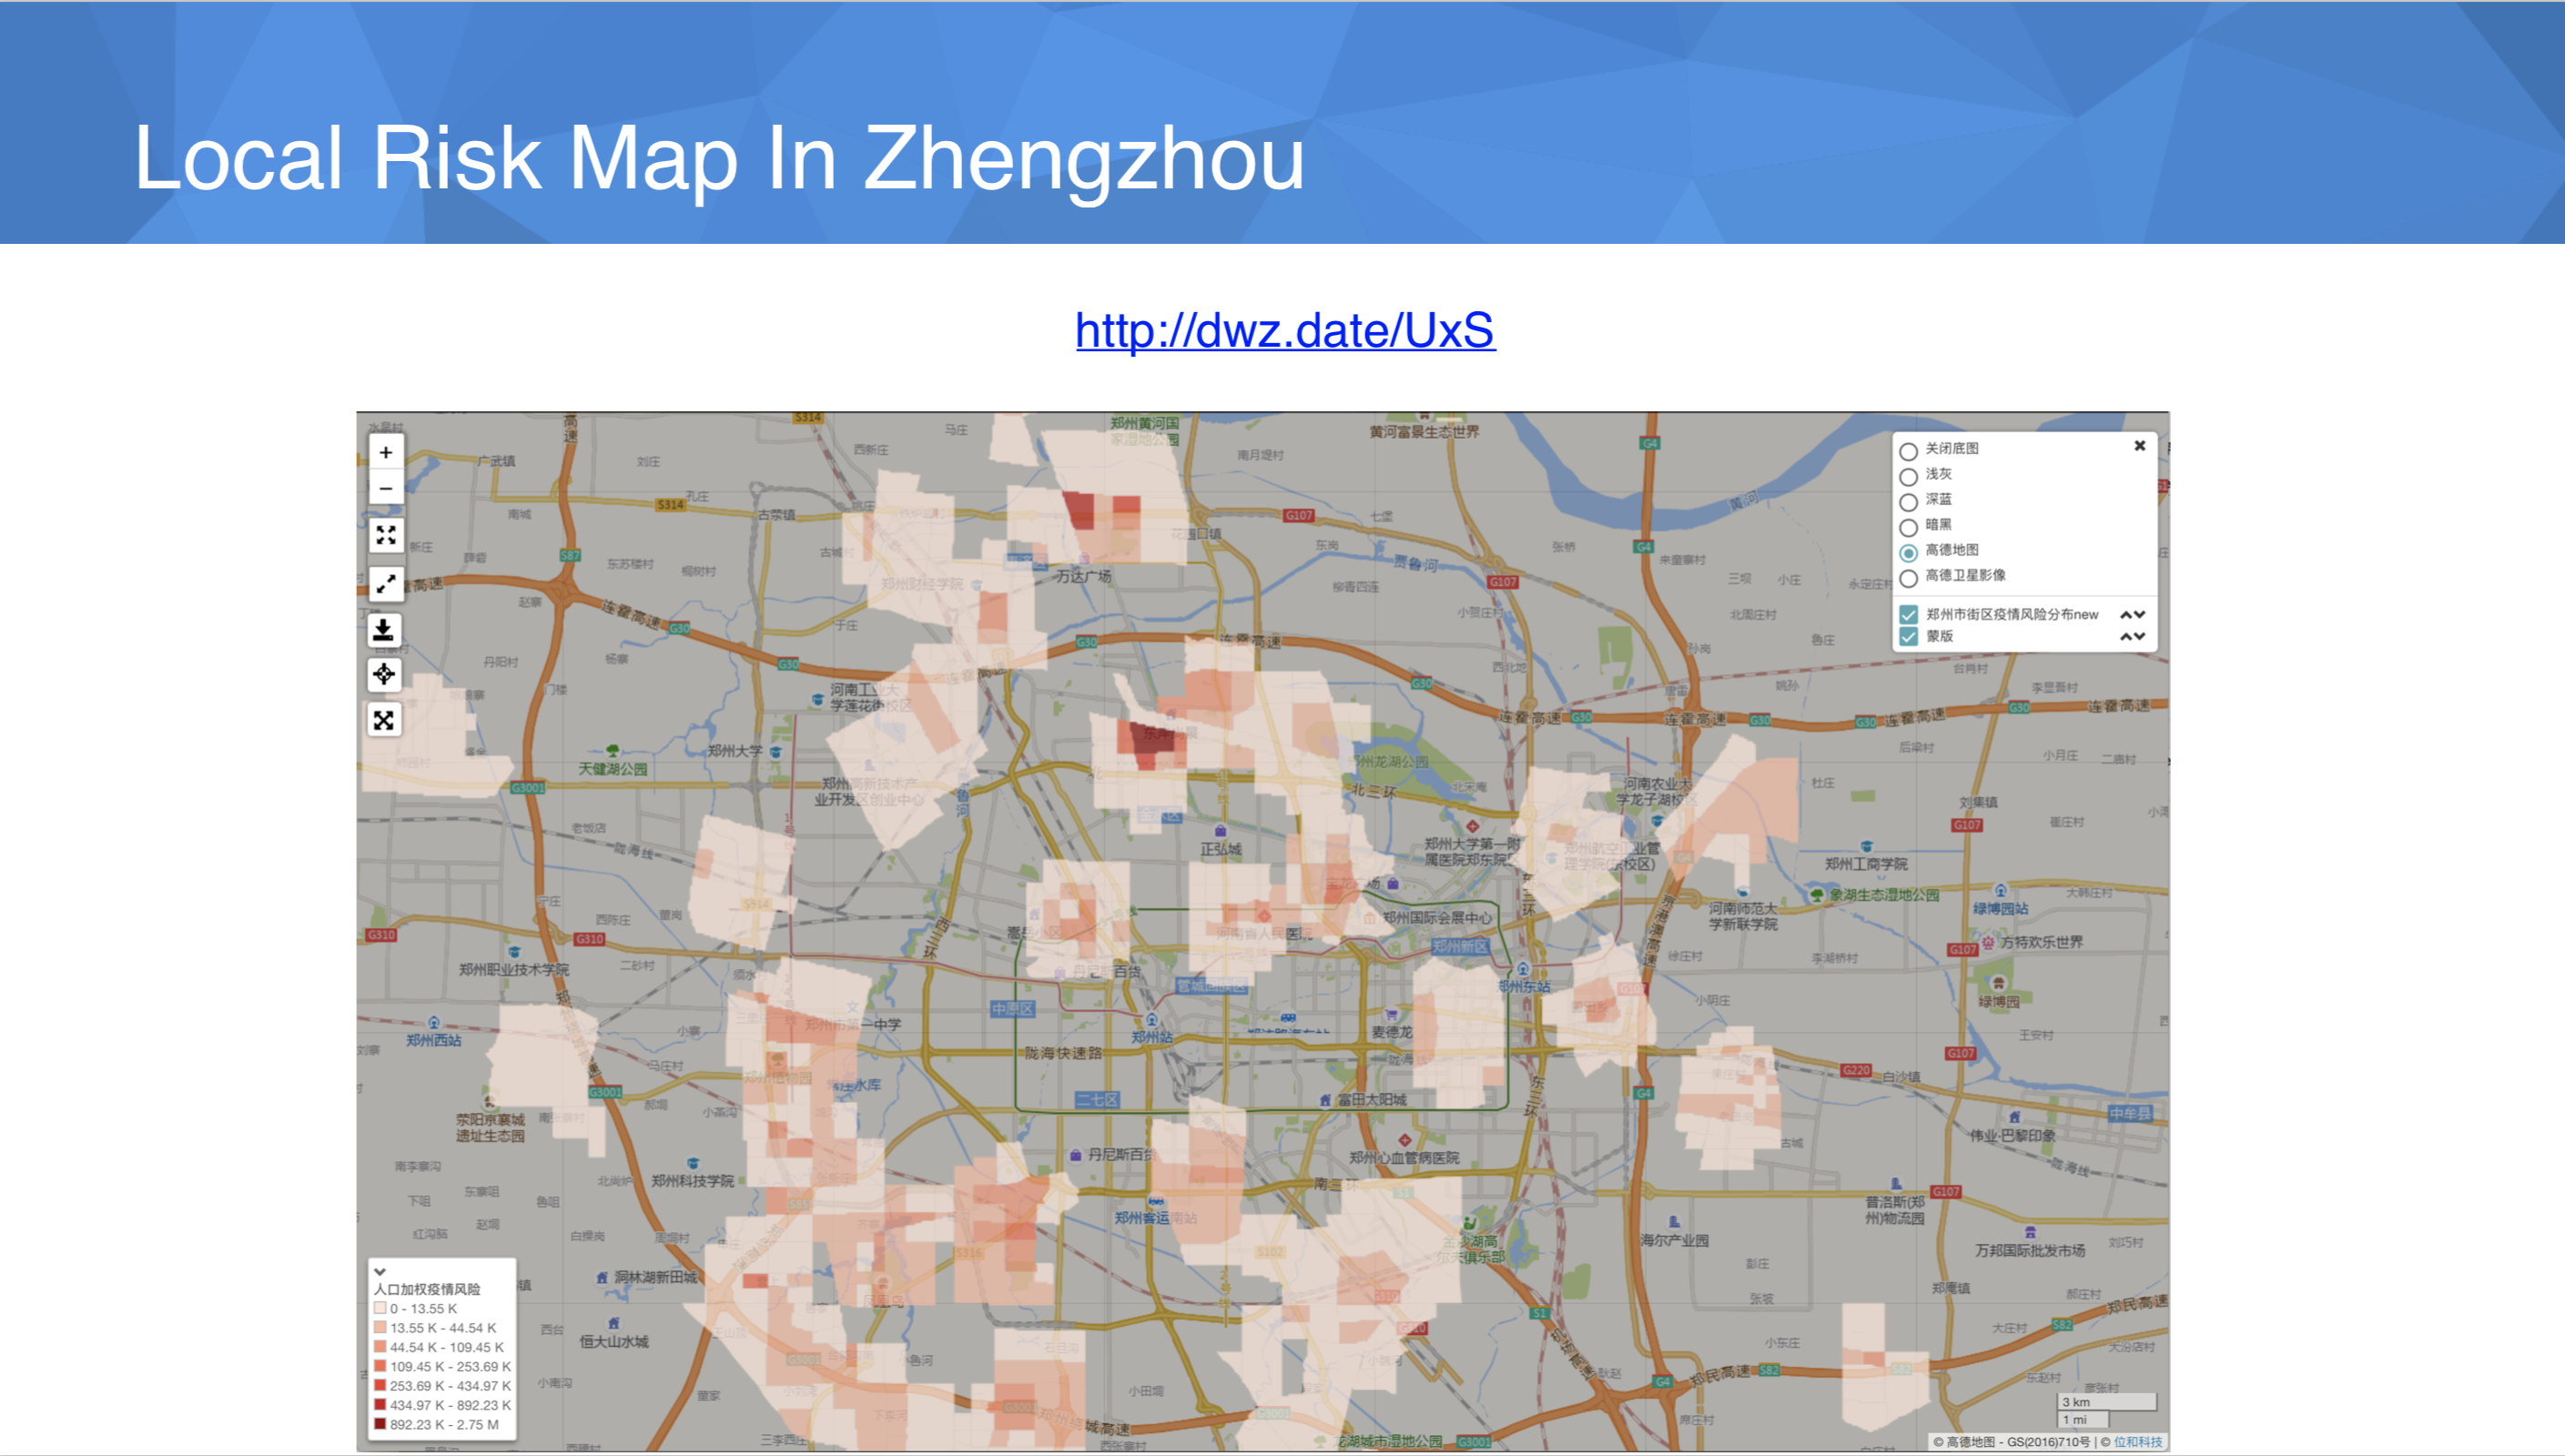
local risky map in zhengzhou
-
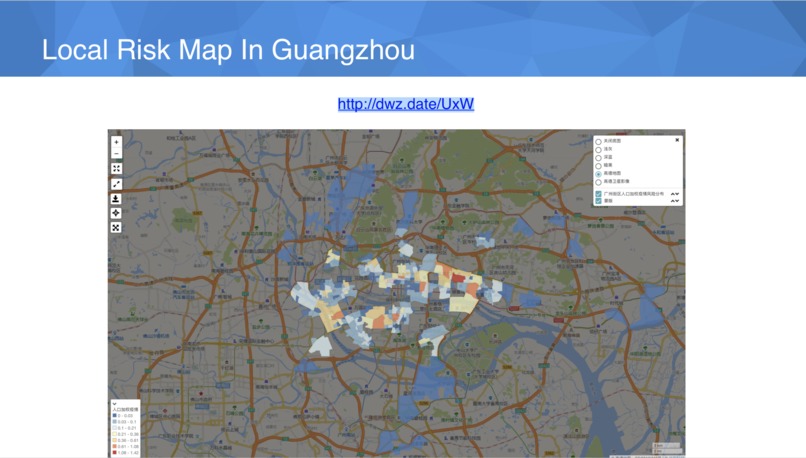
local risky map in Guangzhou
-
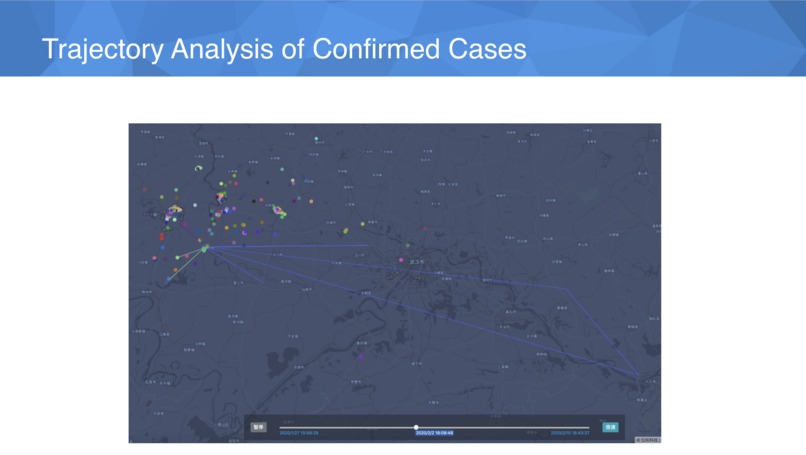
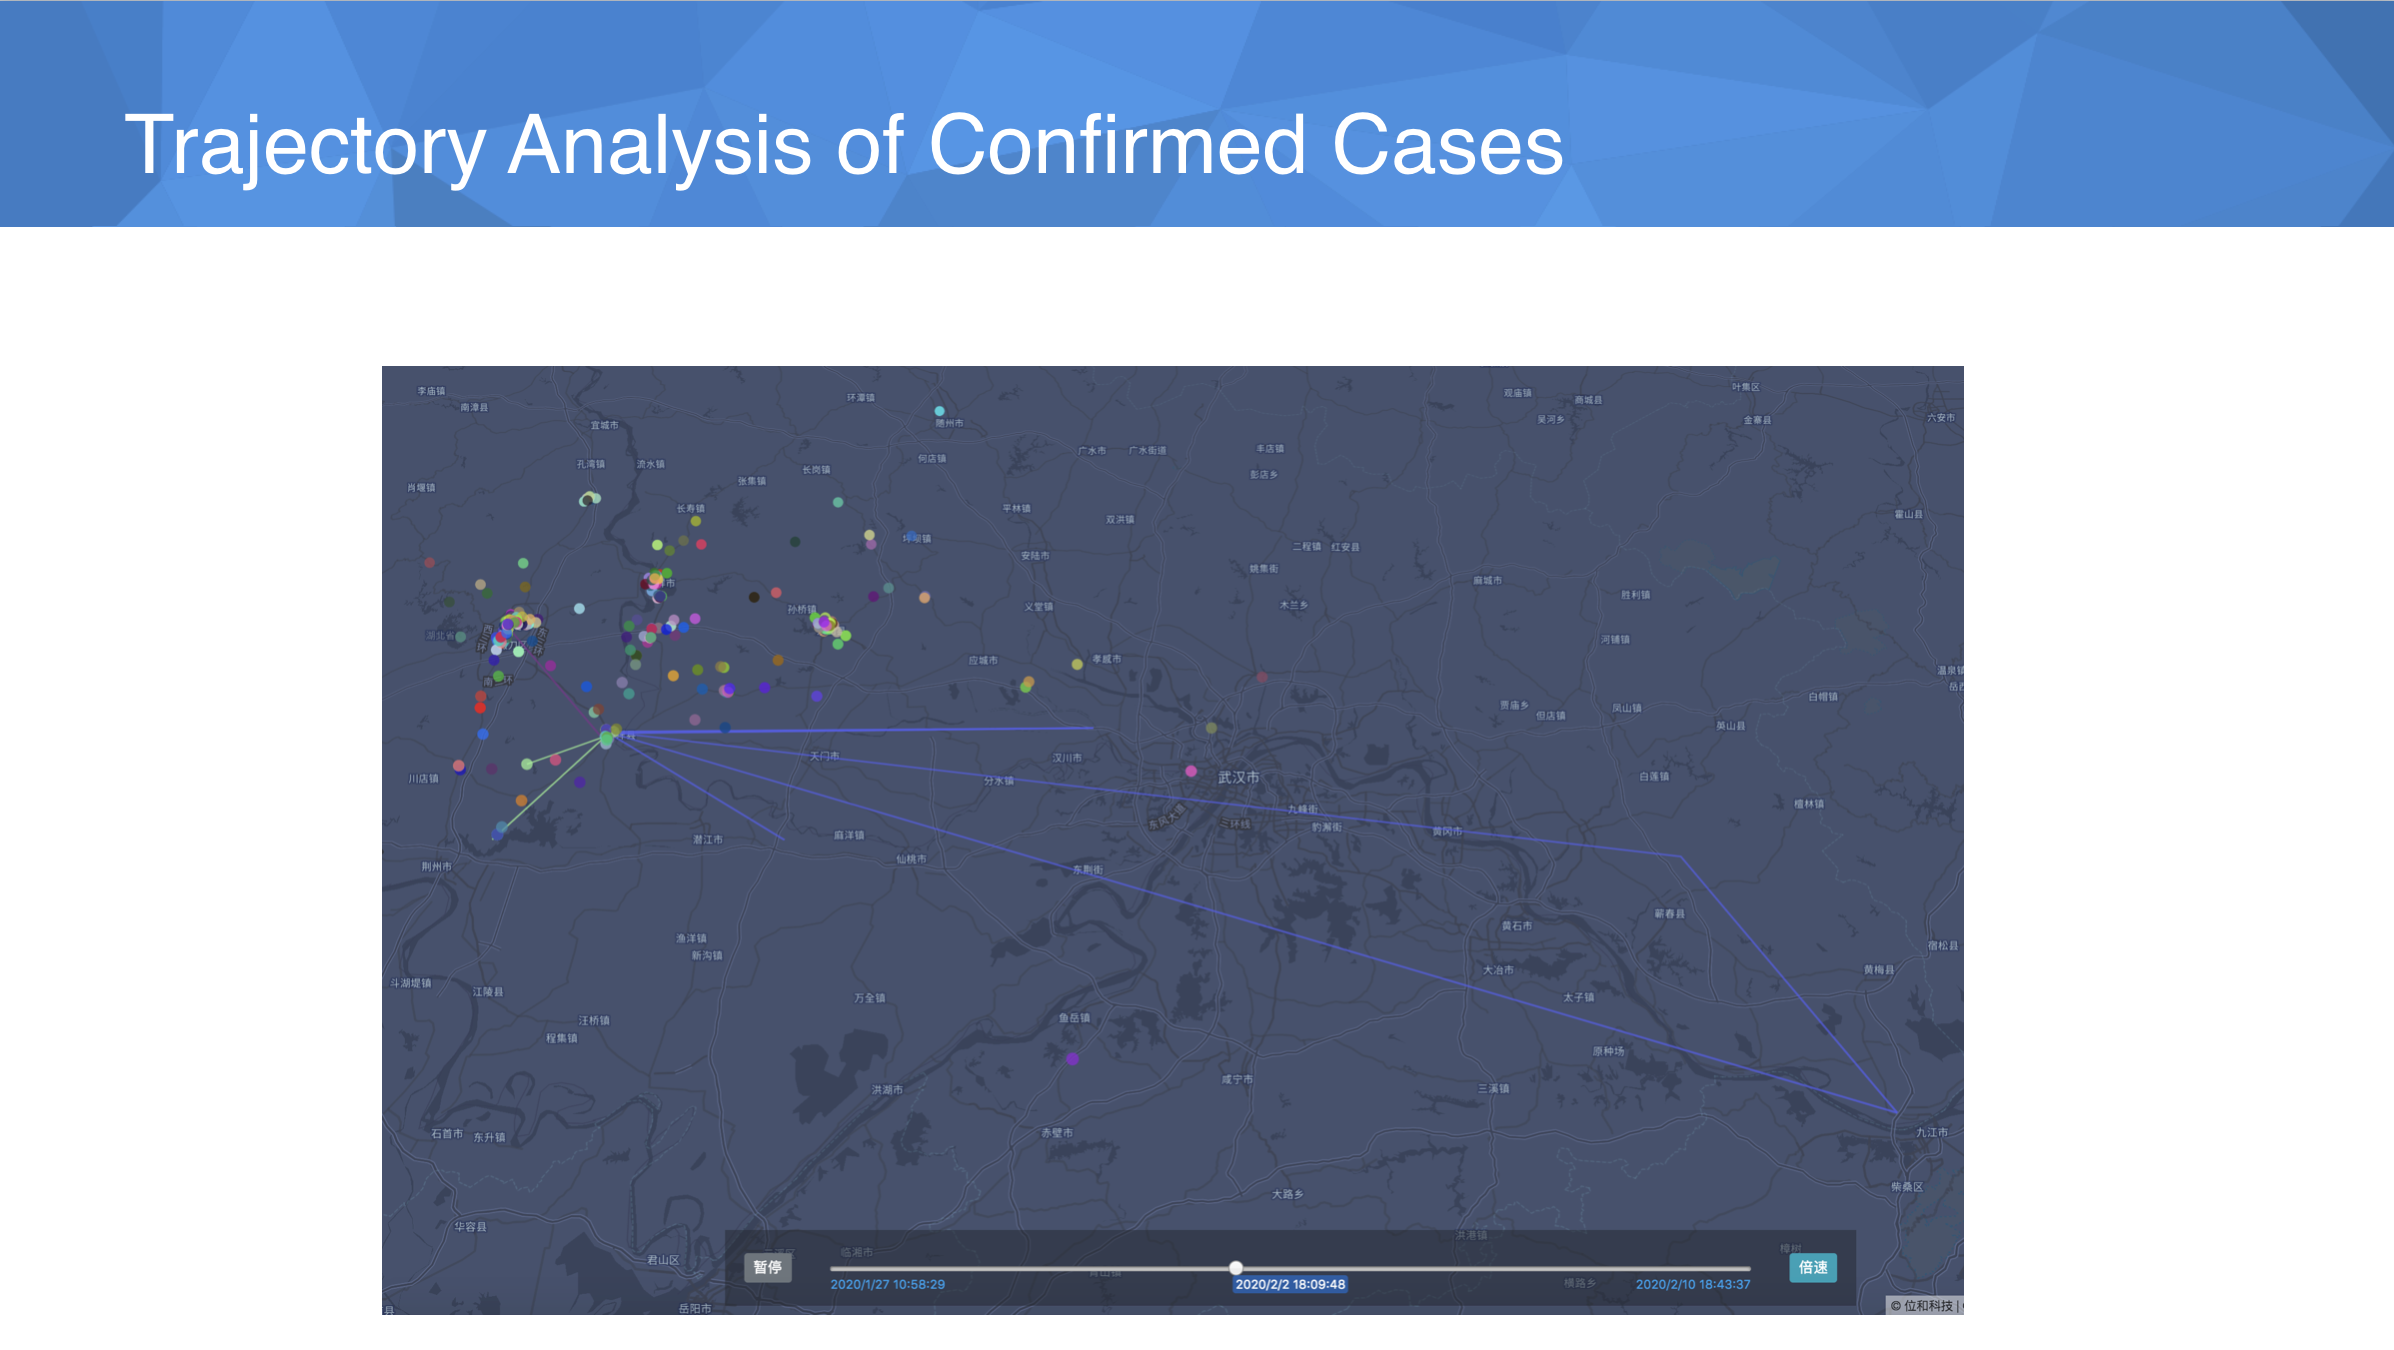
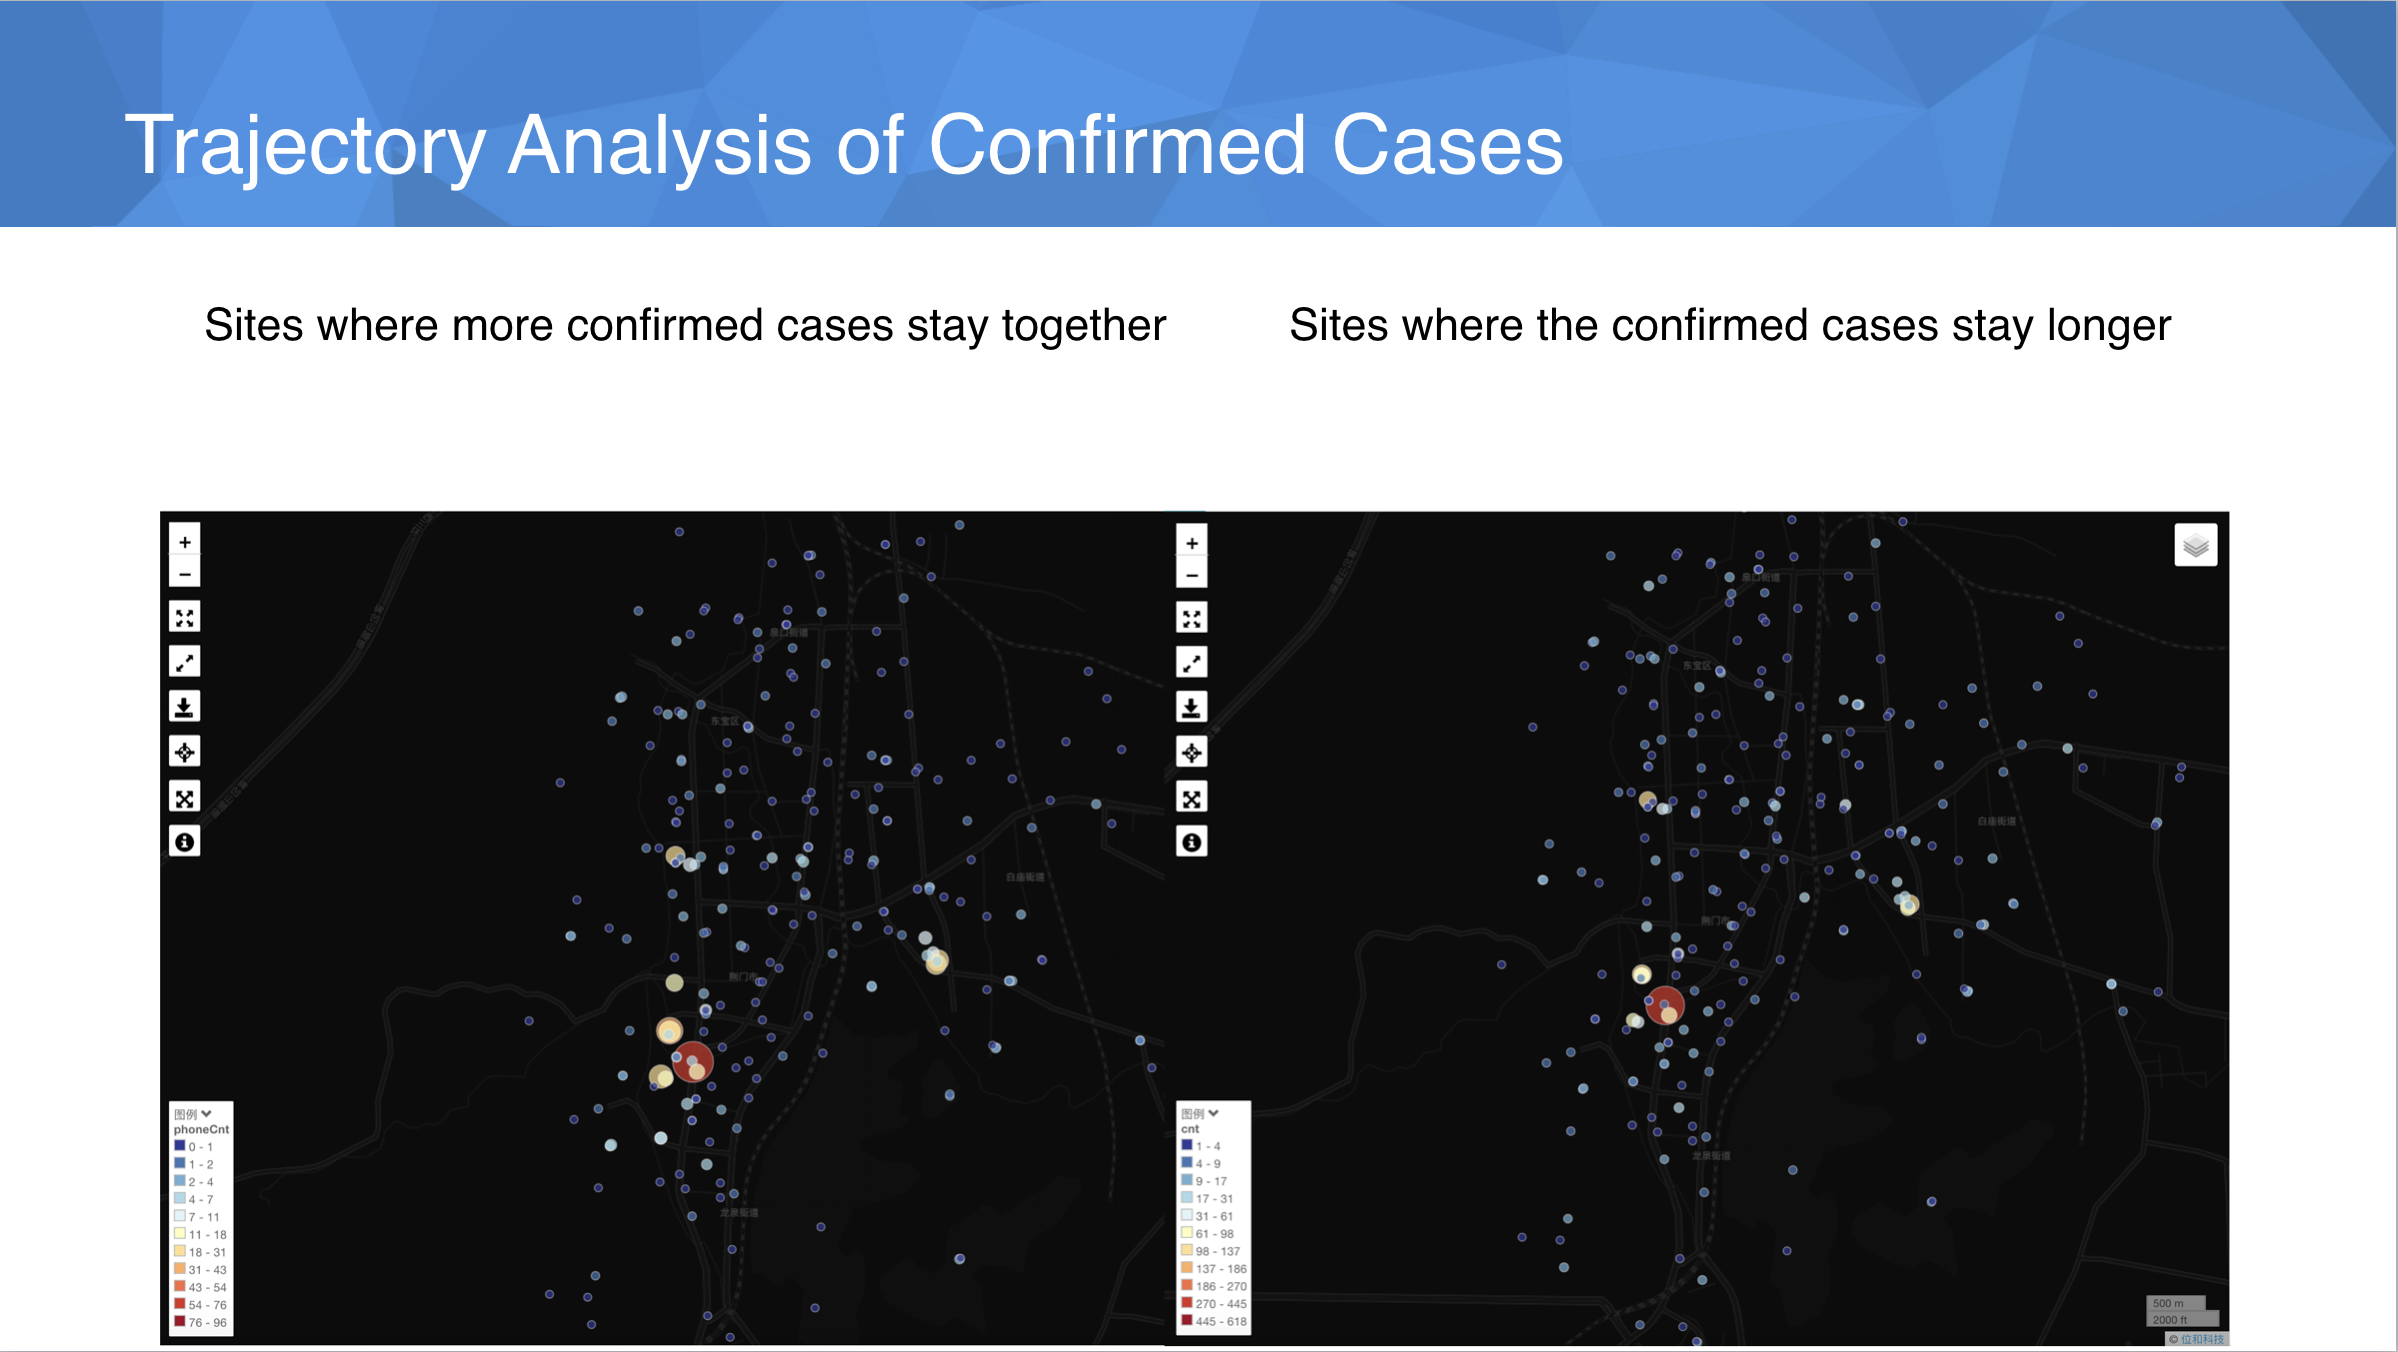
trajectory of confirmed cases
-
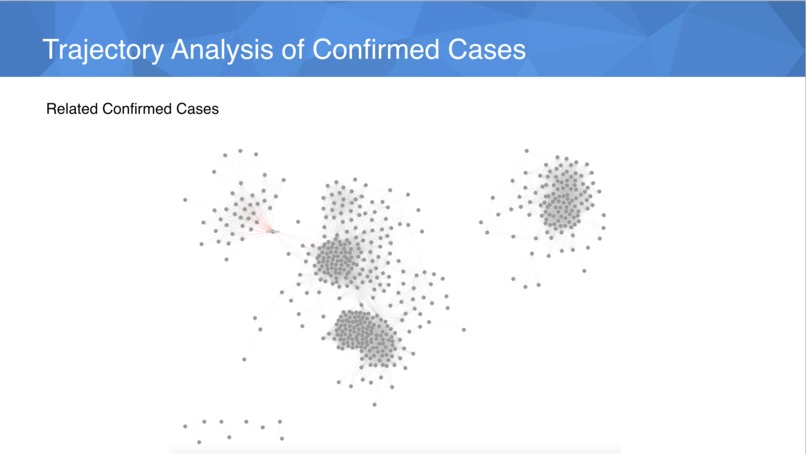
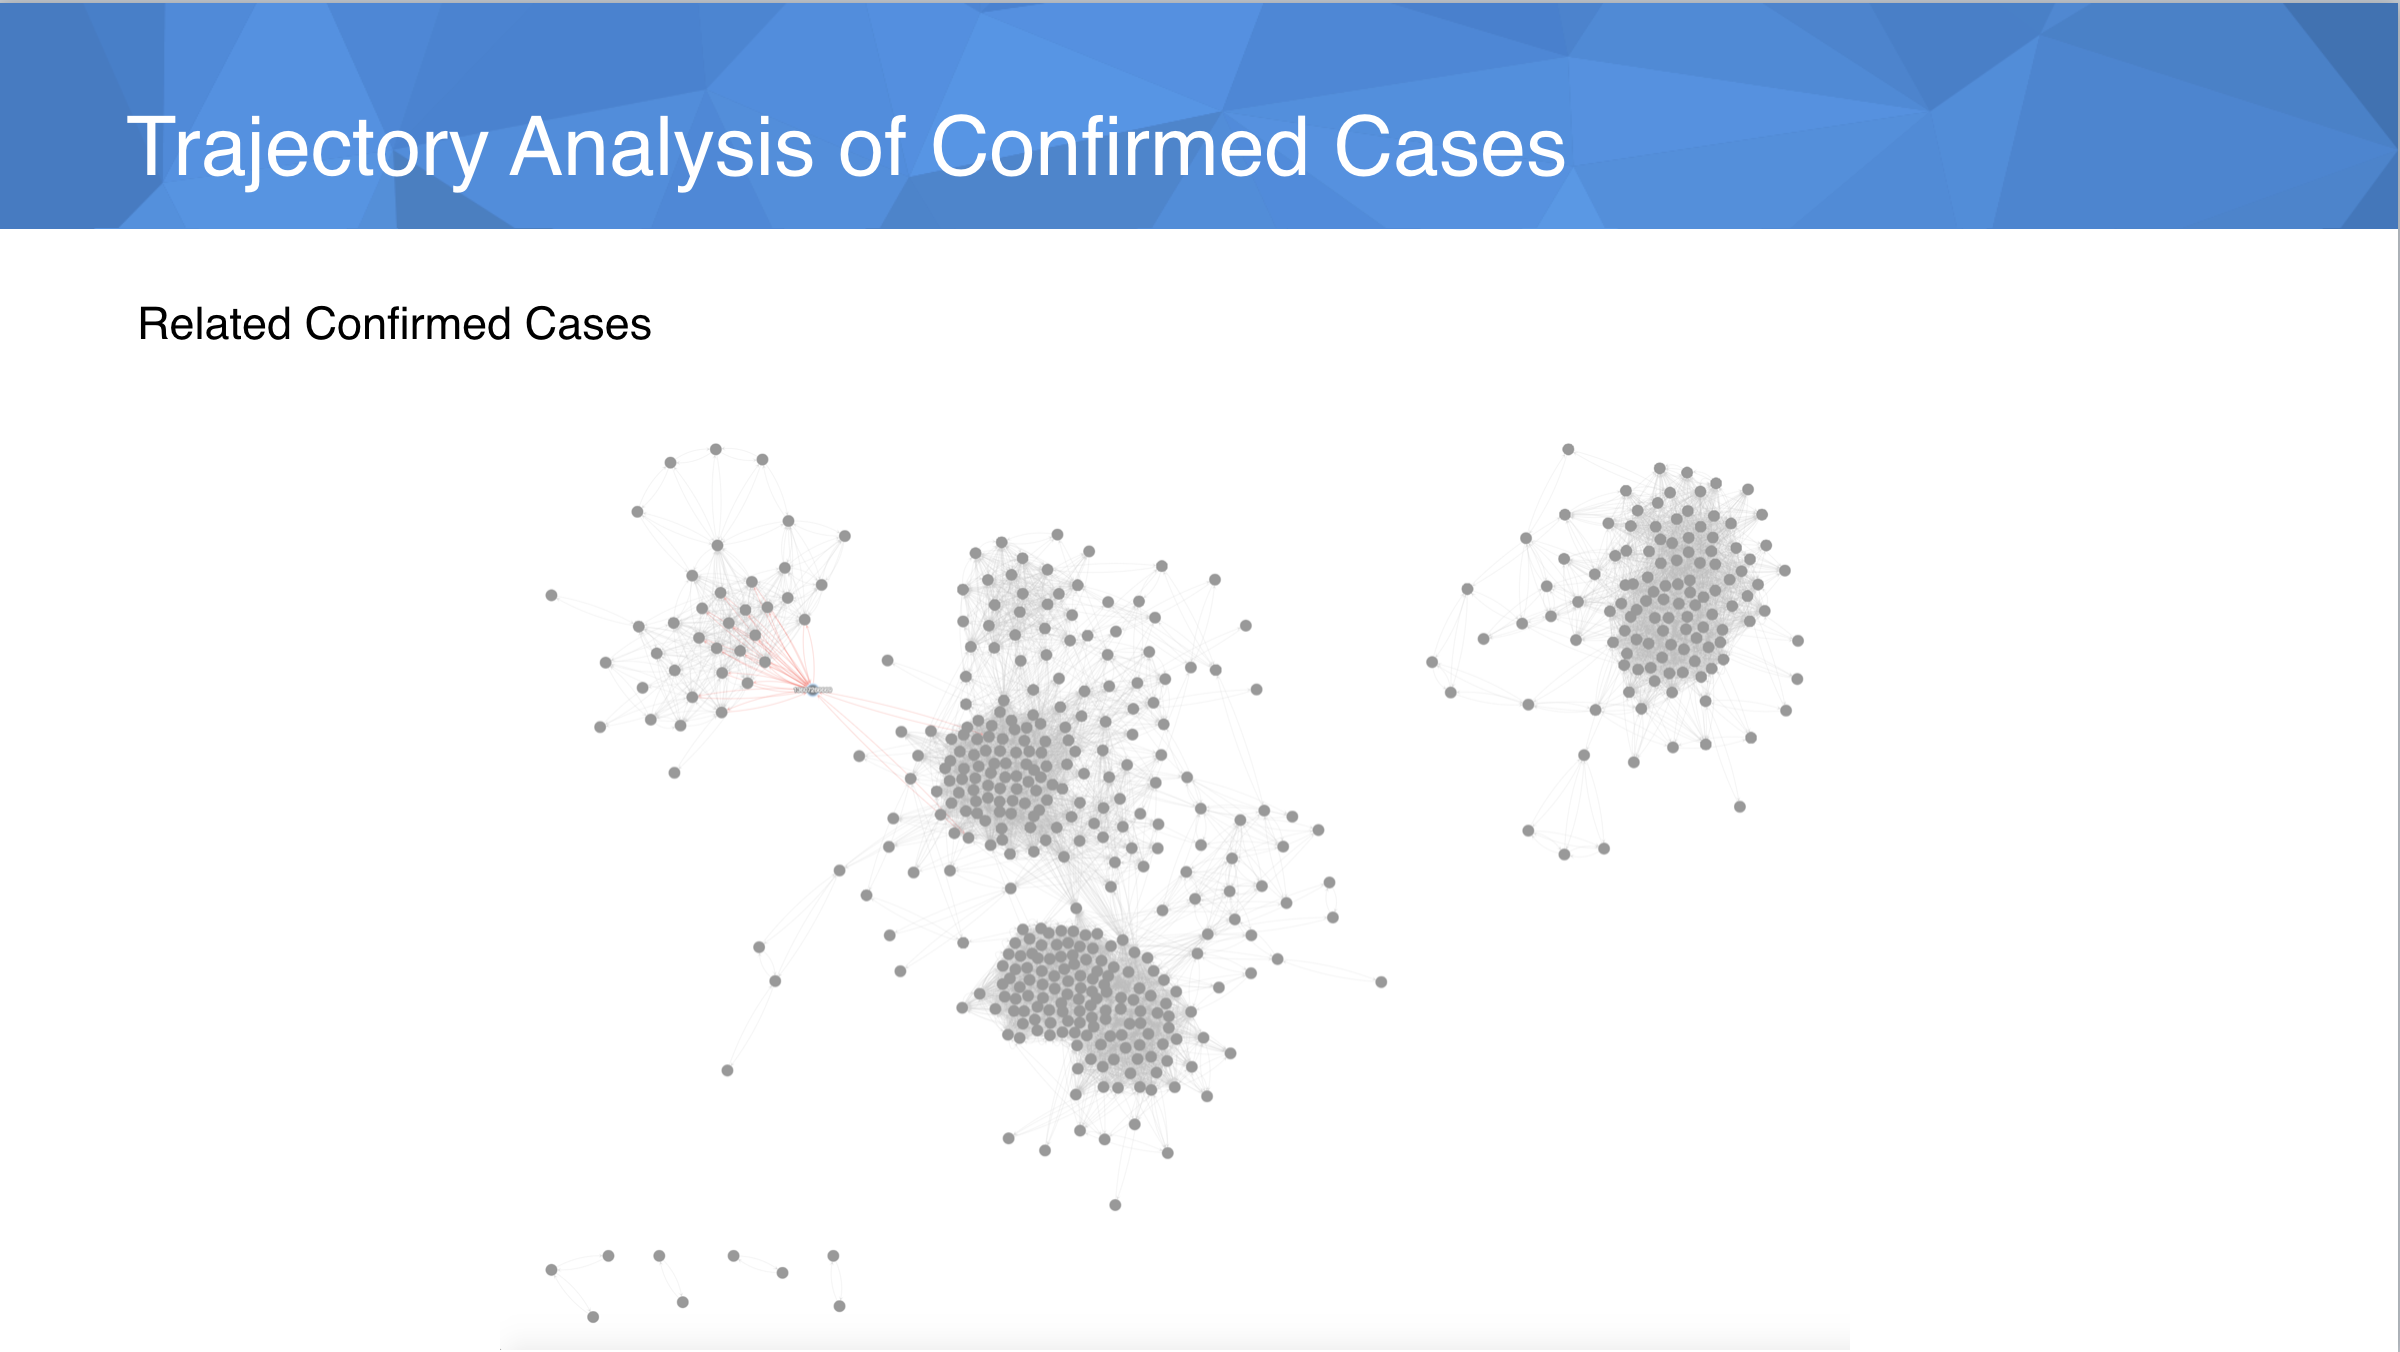
relationship of confirmed cases
-
high risk sites

Inspiration
To fight this pandemic, it is important to quickly identify people that may be infected. However, that's time consuming and may miss important information when we have to rely on the traditional survey. It would be much more efficient if big data technology could be utilized on identifying the high risk area and find out the most possible infected people.
What it does
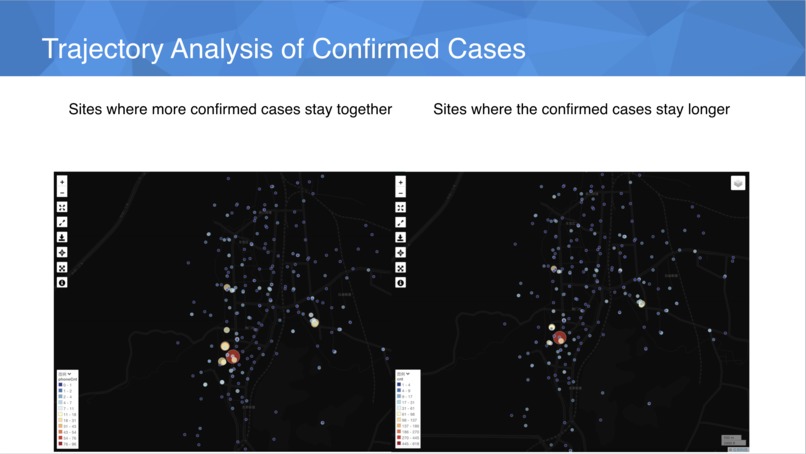
We got trajectories of confirmed cases in a city.
- We draw the trajectories out and then dig into them to find out the sites where more confirmed cases stay together and the sites where confirmed cases stay longer. These sites were visualized on the map.
- The second work we did was to calculate the local risk map based on the sites we calculated in the first step. http://dwz.date/YaS
The third work we did was to dig into the confirmed cases to find out their space-time relationship. If two people stay together at the same time and the same location, they are related. The calculation found several groups of them based how close they are connected. Pick each person, other people related to this one will be shown on the screen. This work is the digital Epidemiological investigation
Other than Jingmen, we also did the local risk map in Zhengzhou (http://dwz.date/UxS) and Guangzhou ( http://dwz.date/UxW).
How I built it
we processed the data and then drew the map using our mapping API.
Challenges I ran into
When the dataset is large, data processing performance is a challenge.
Accomplishments that I'm proud of
Be able to identify the high risky areas and how confirmed cases are related to each other
What I learned
trajectory analysis
What's next for Digital Epidemiological Investigation & Local Pandemic Risk Map
We need to improve the graph visualization


 Li")


Log in or sign up for Devpost to join the conversation.