-
-
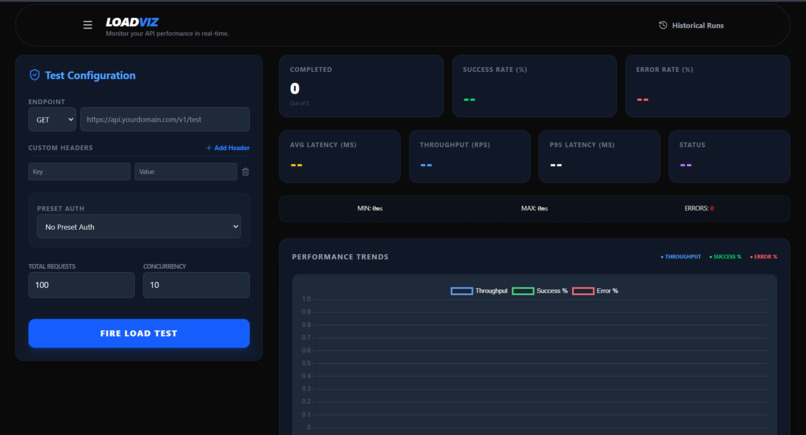
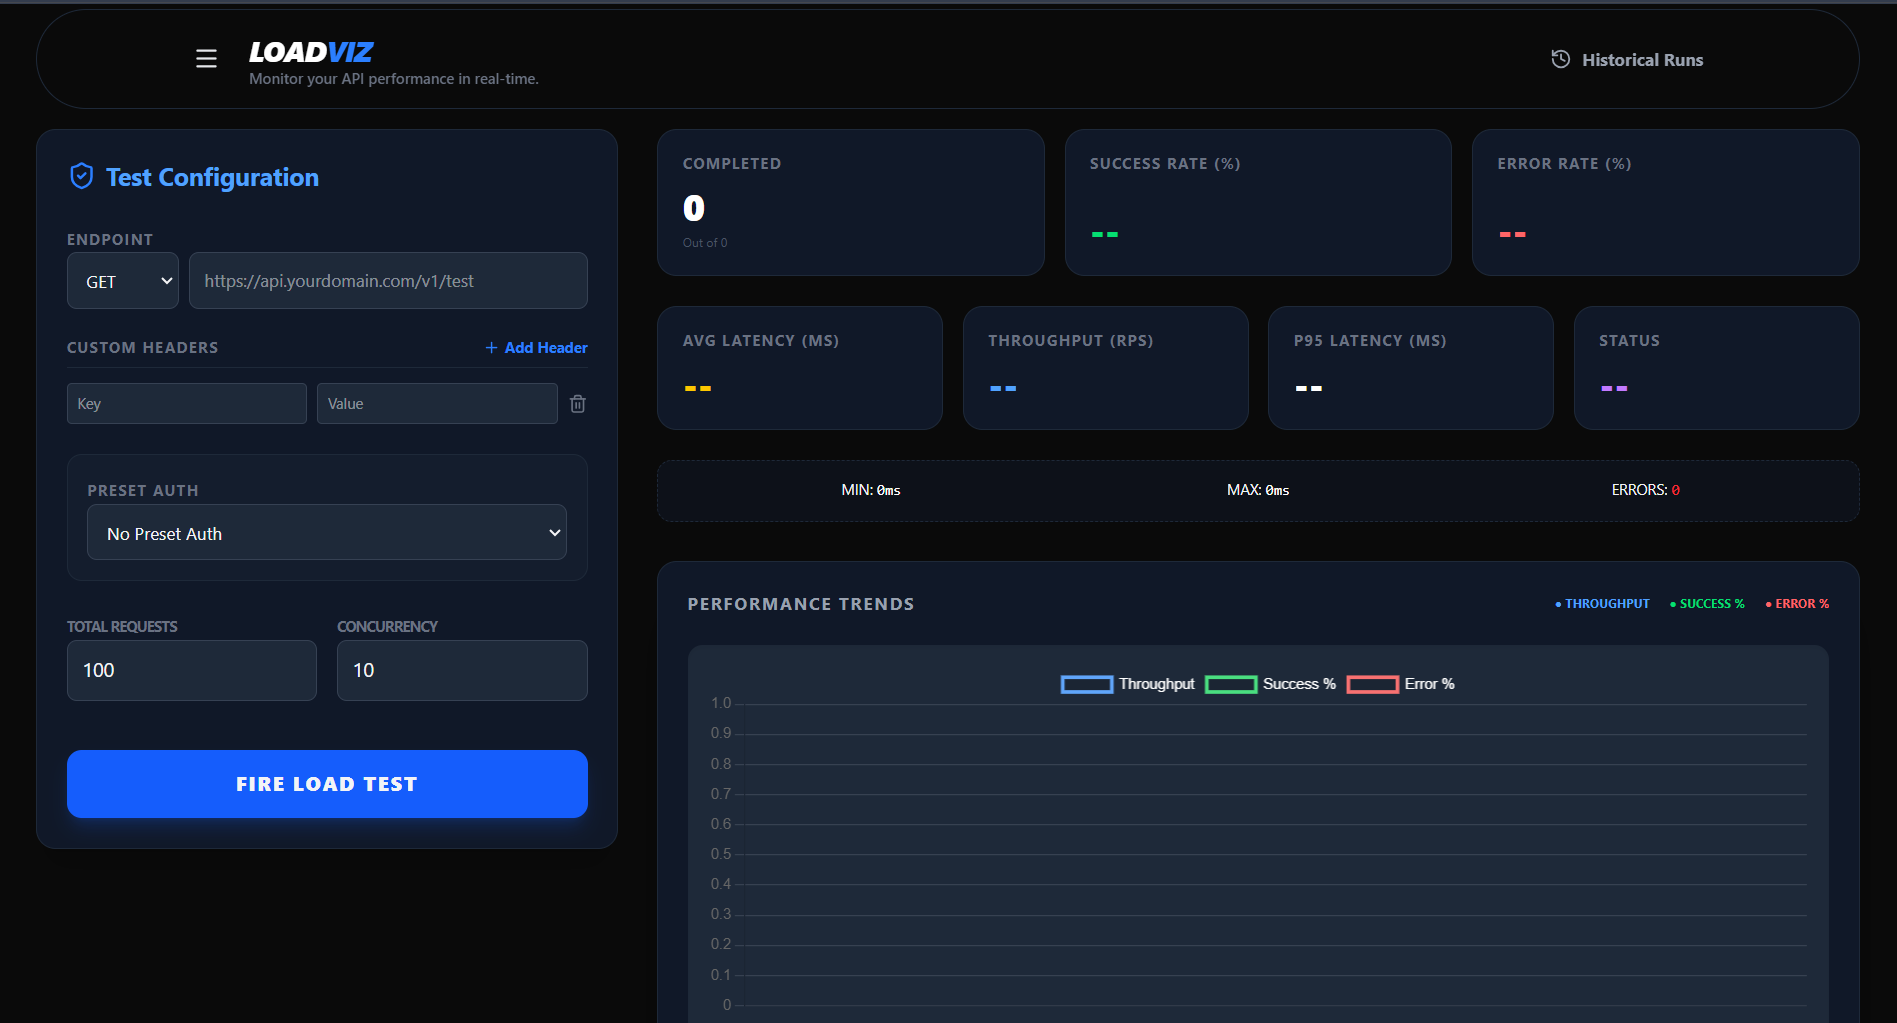
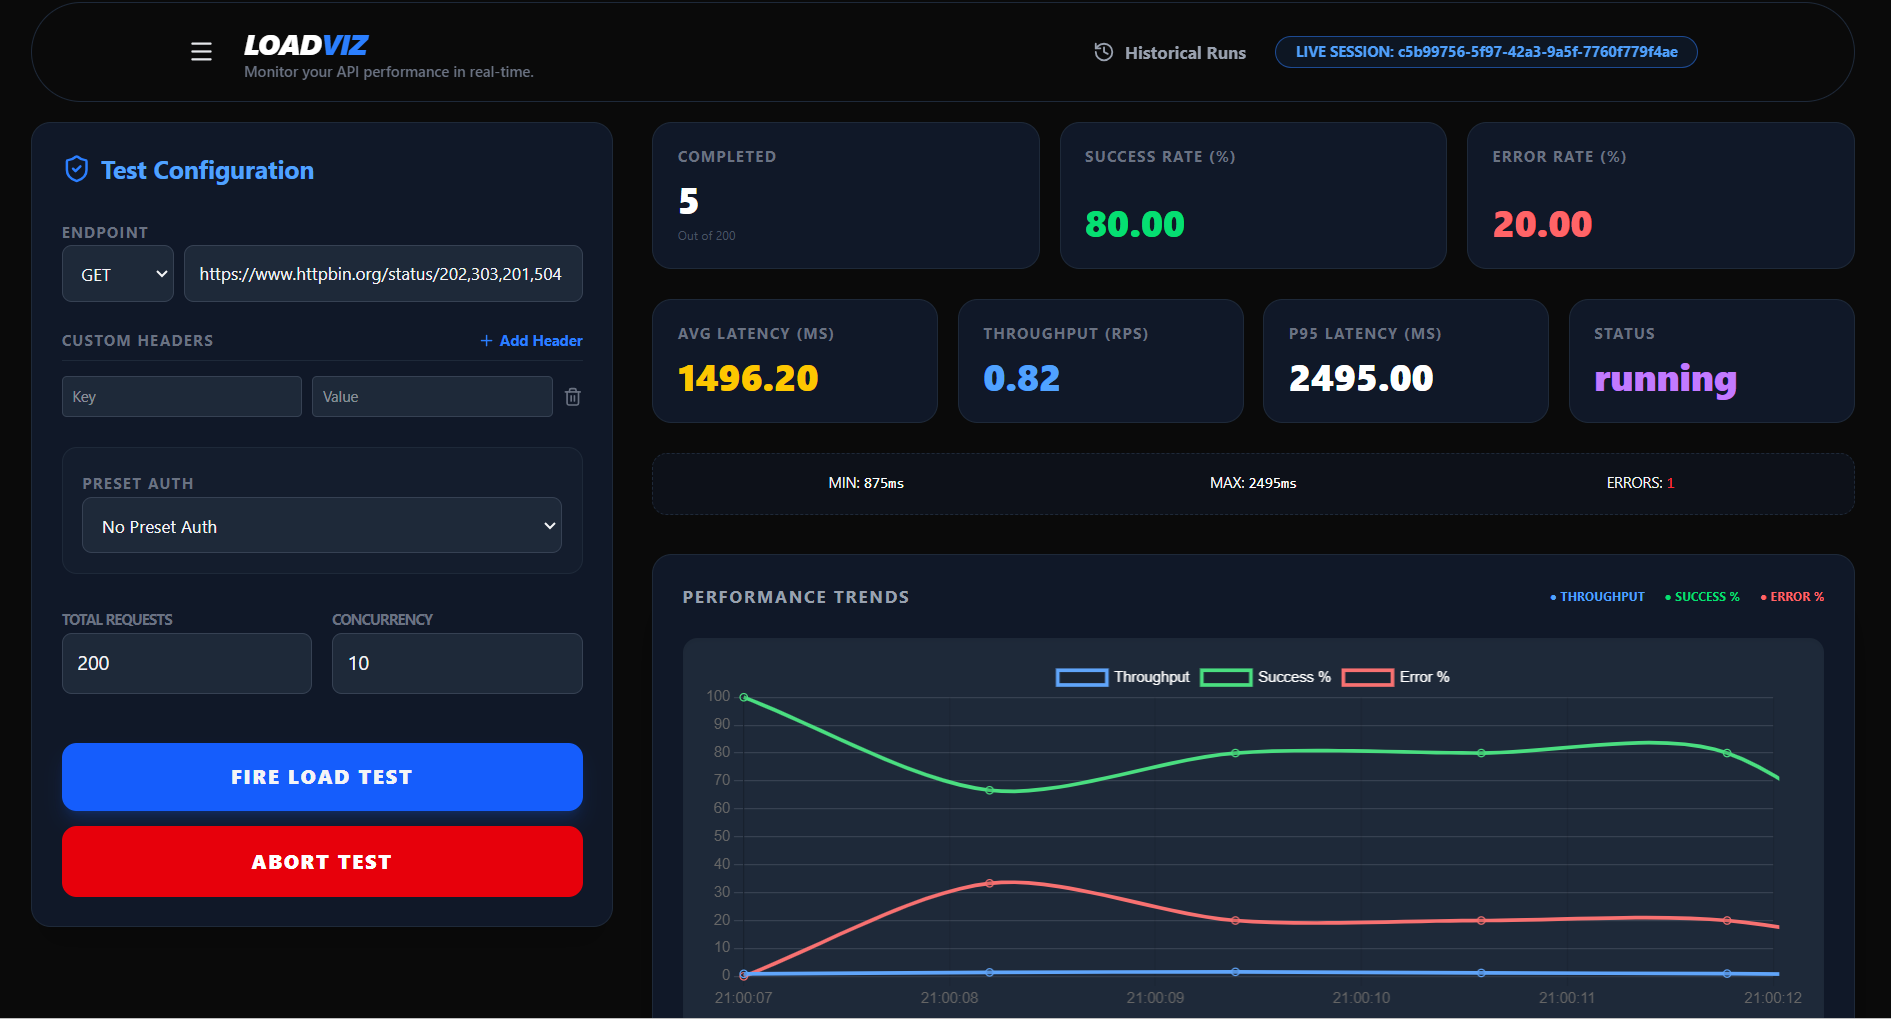
interface
-
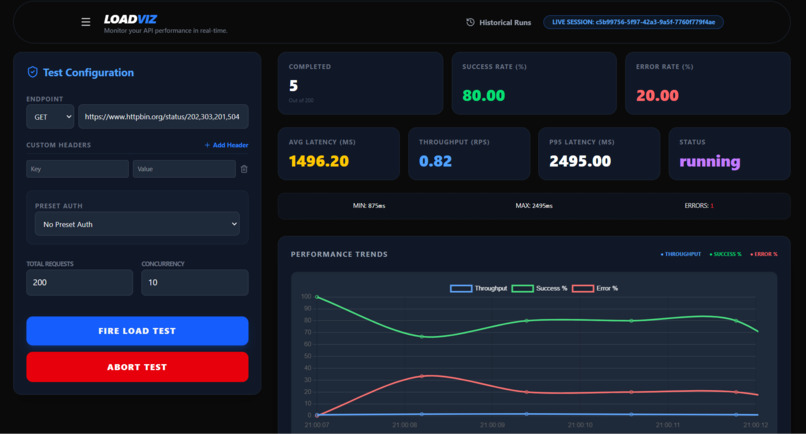
a local test
-
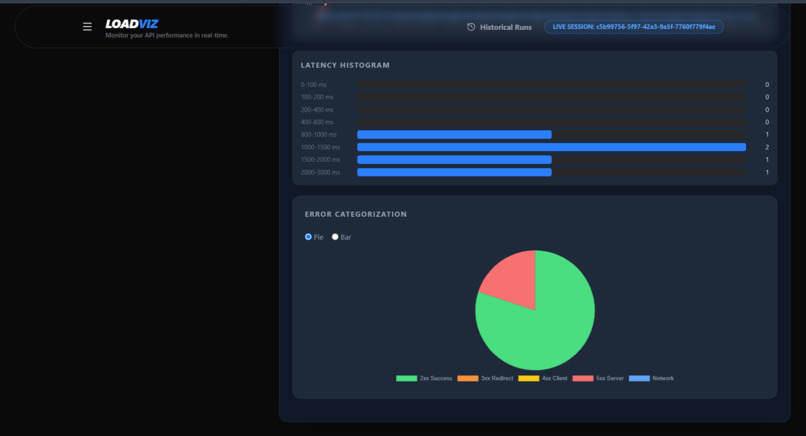
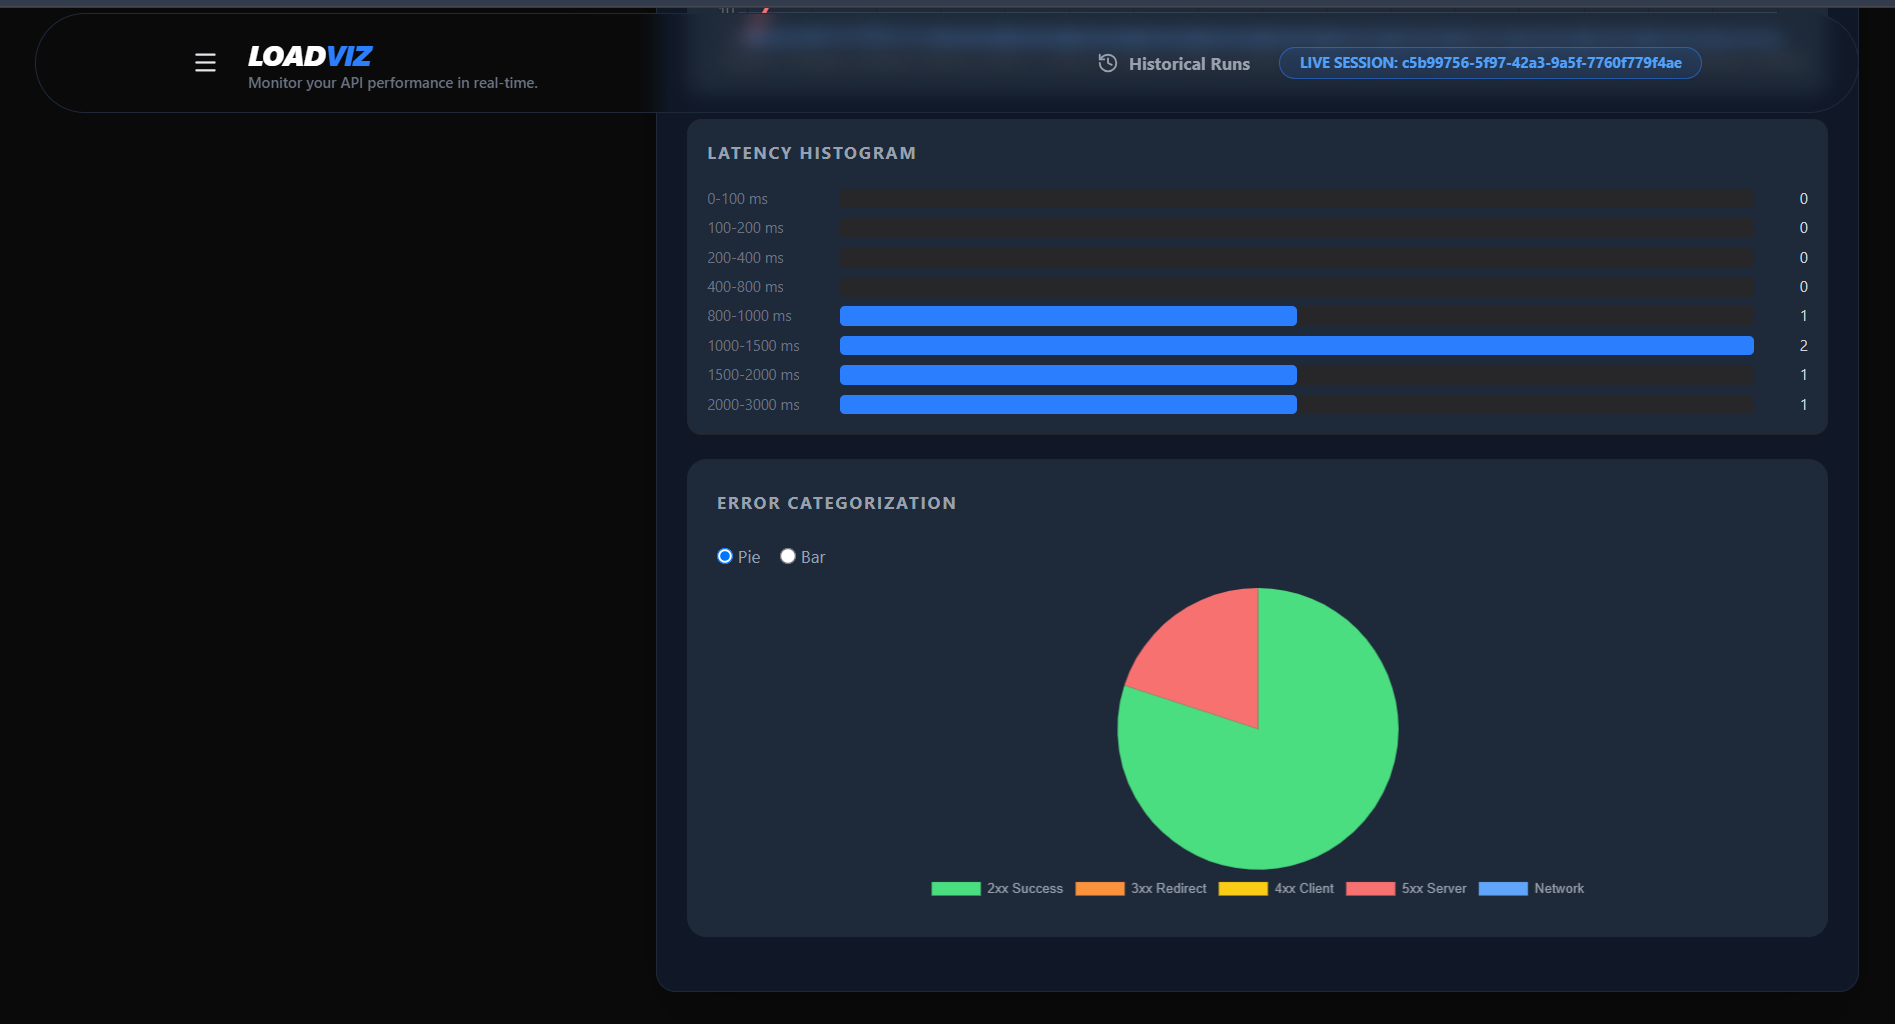
pie/bar chart visualization for error categories
-
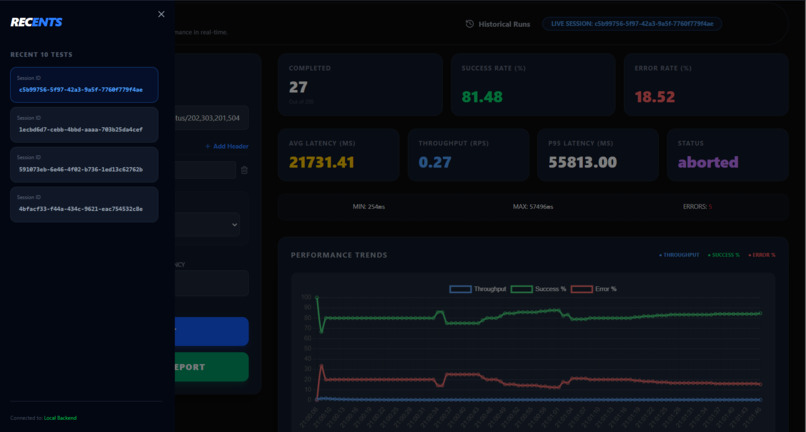
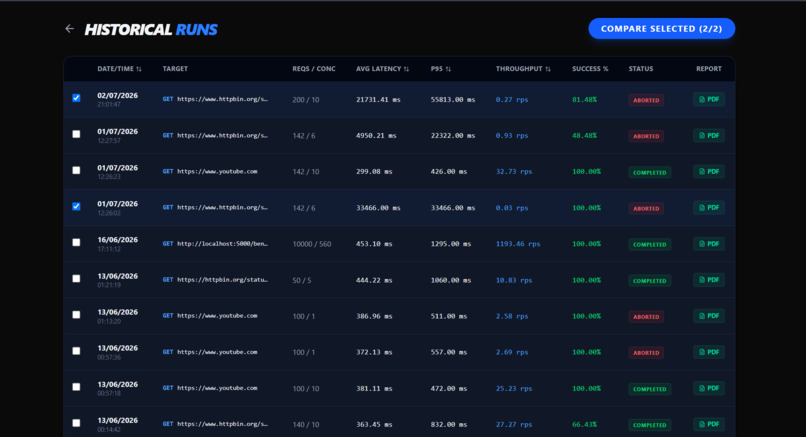
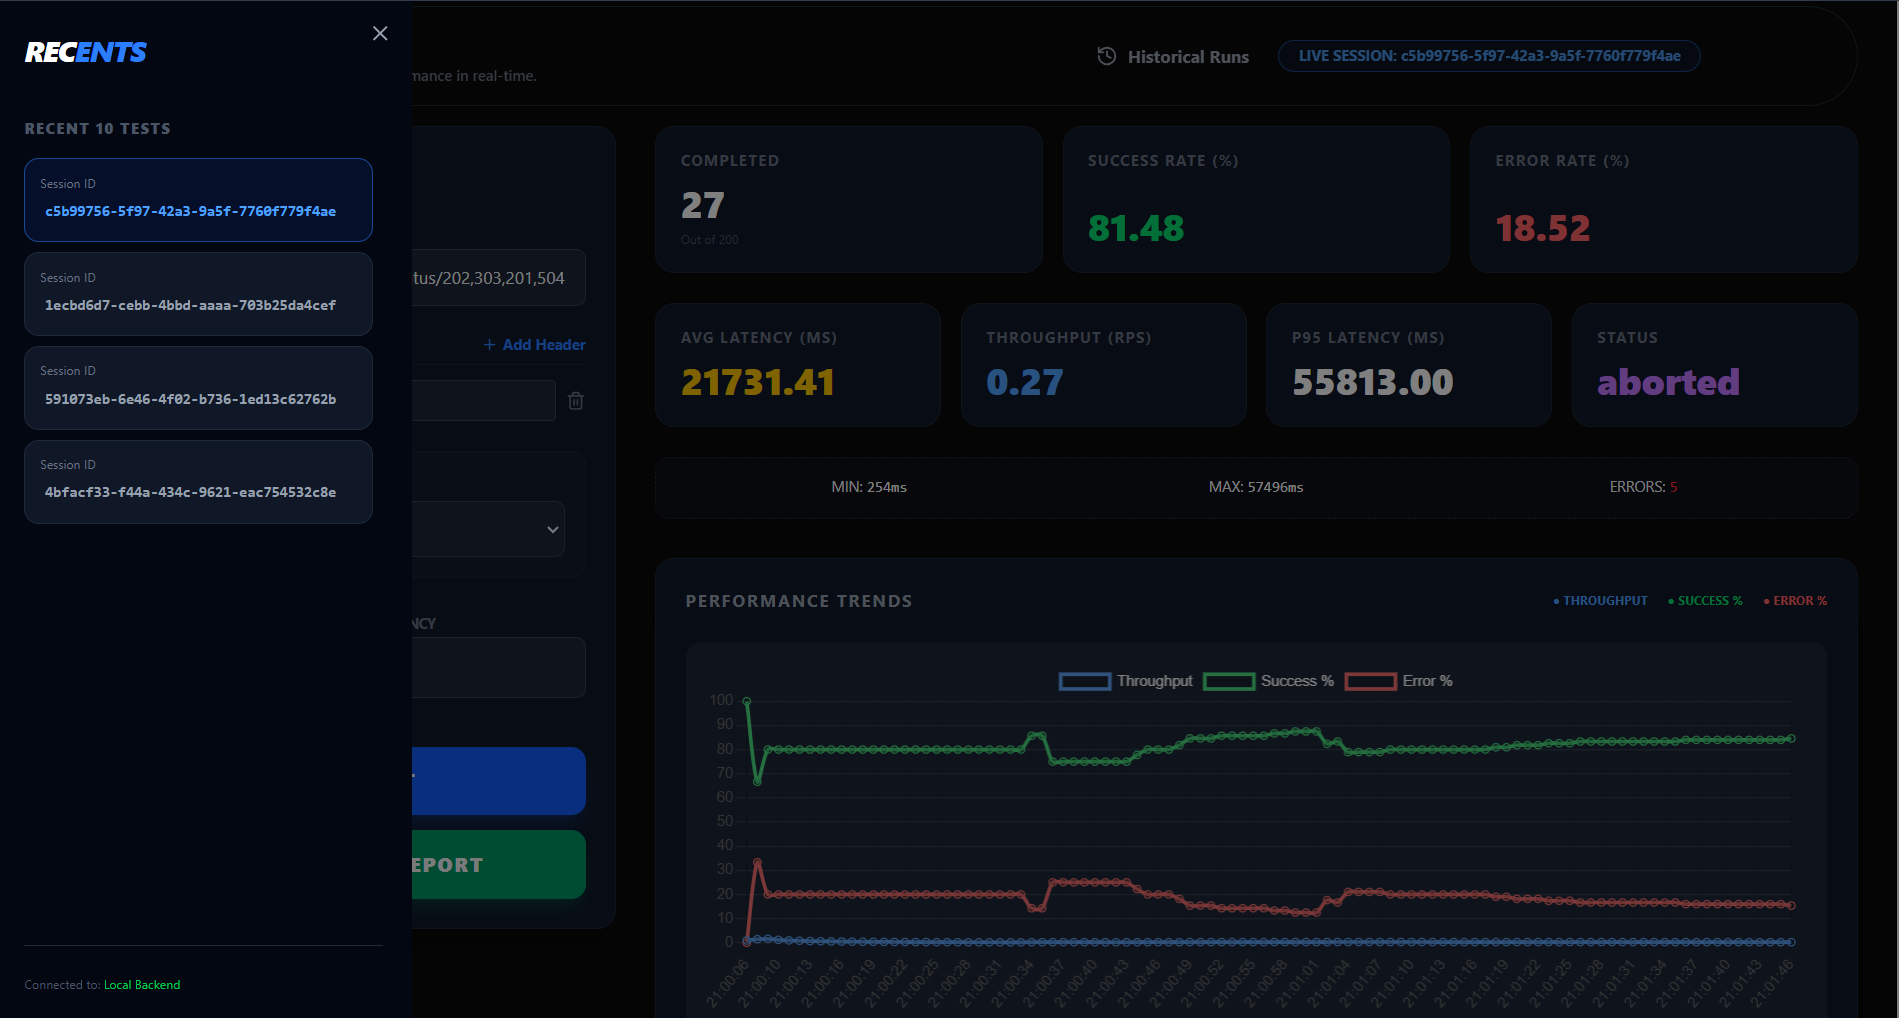
Recent tests
-
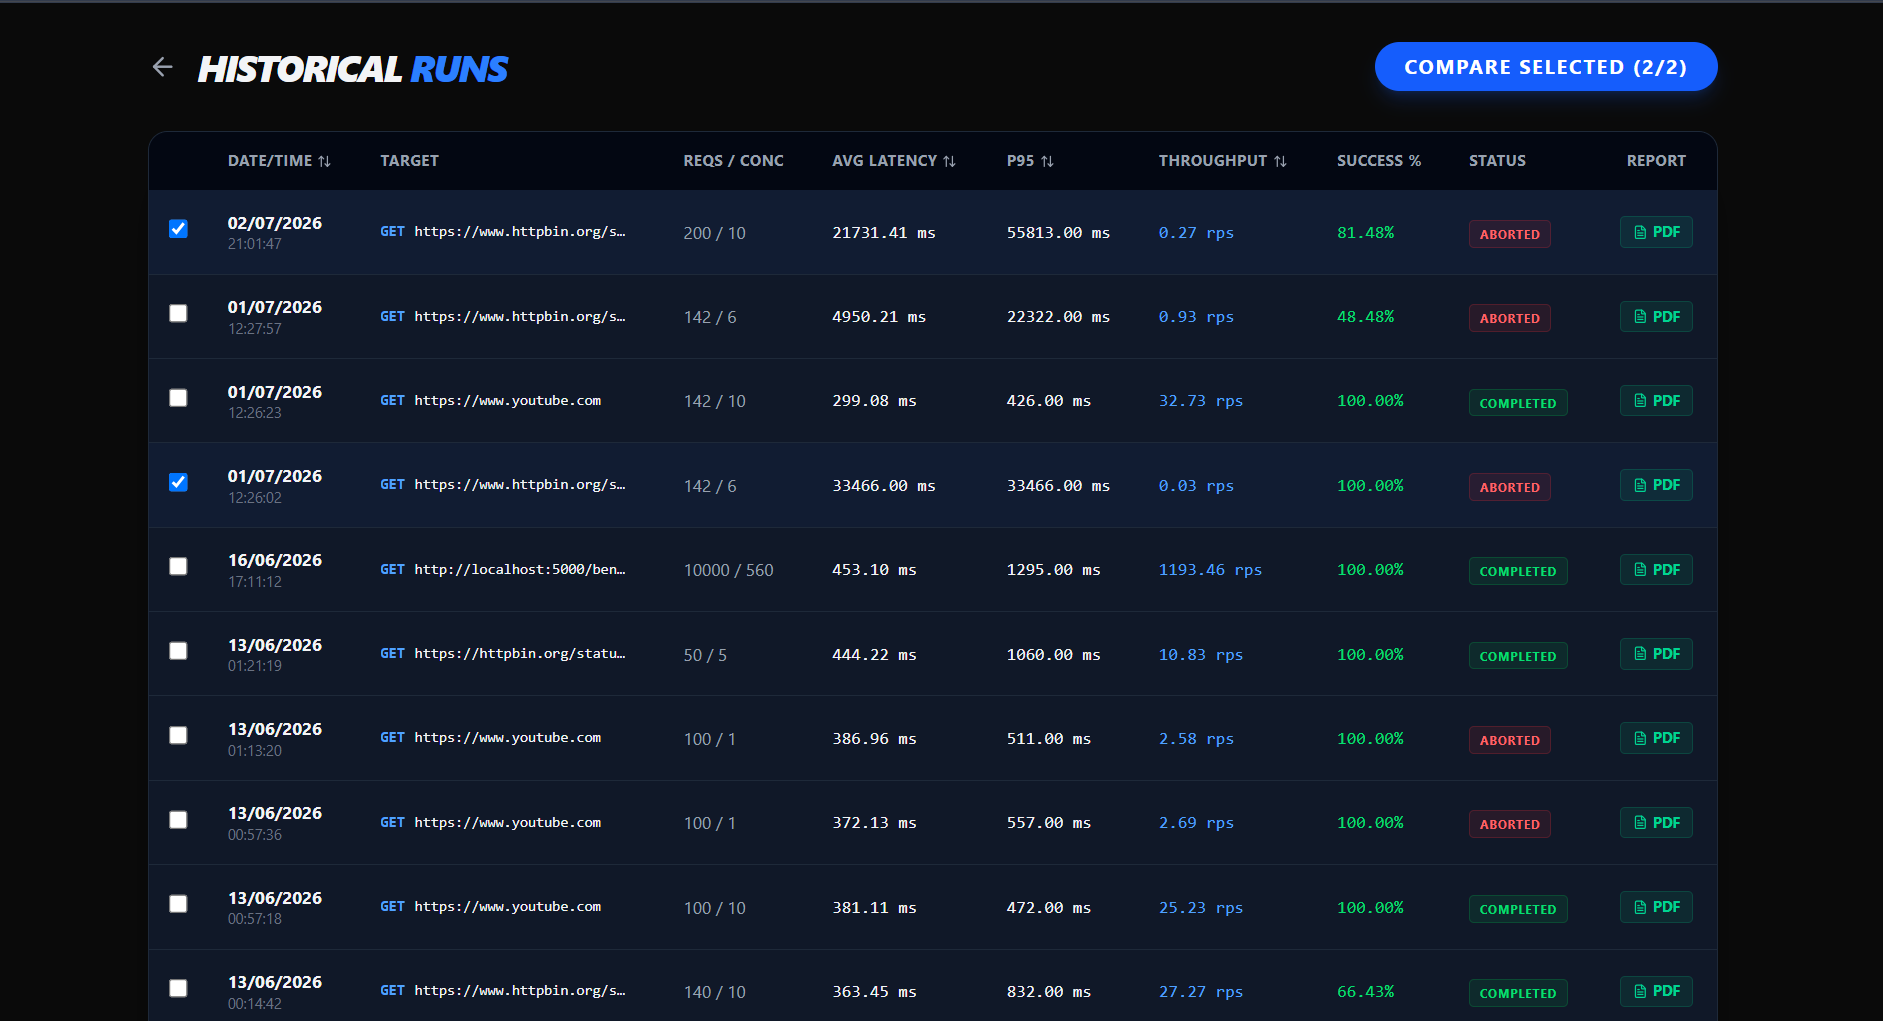
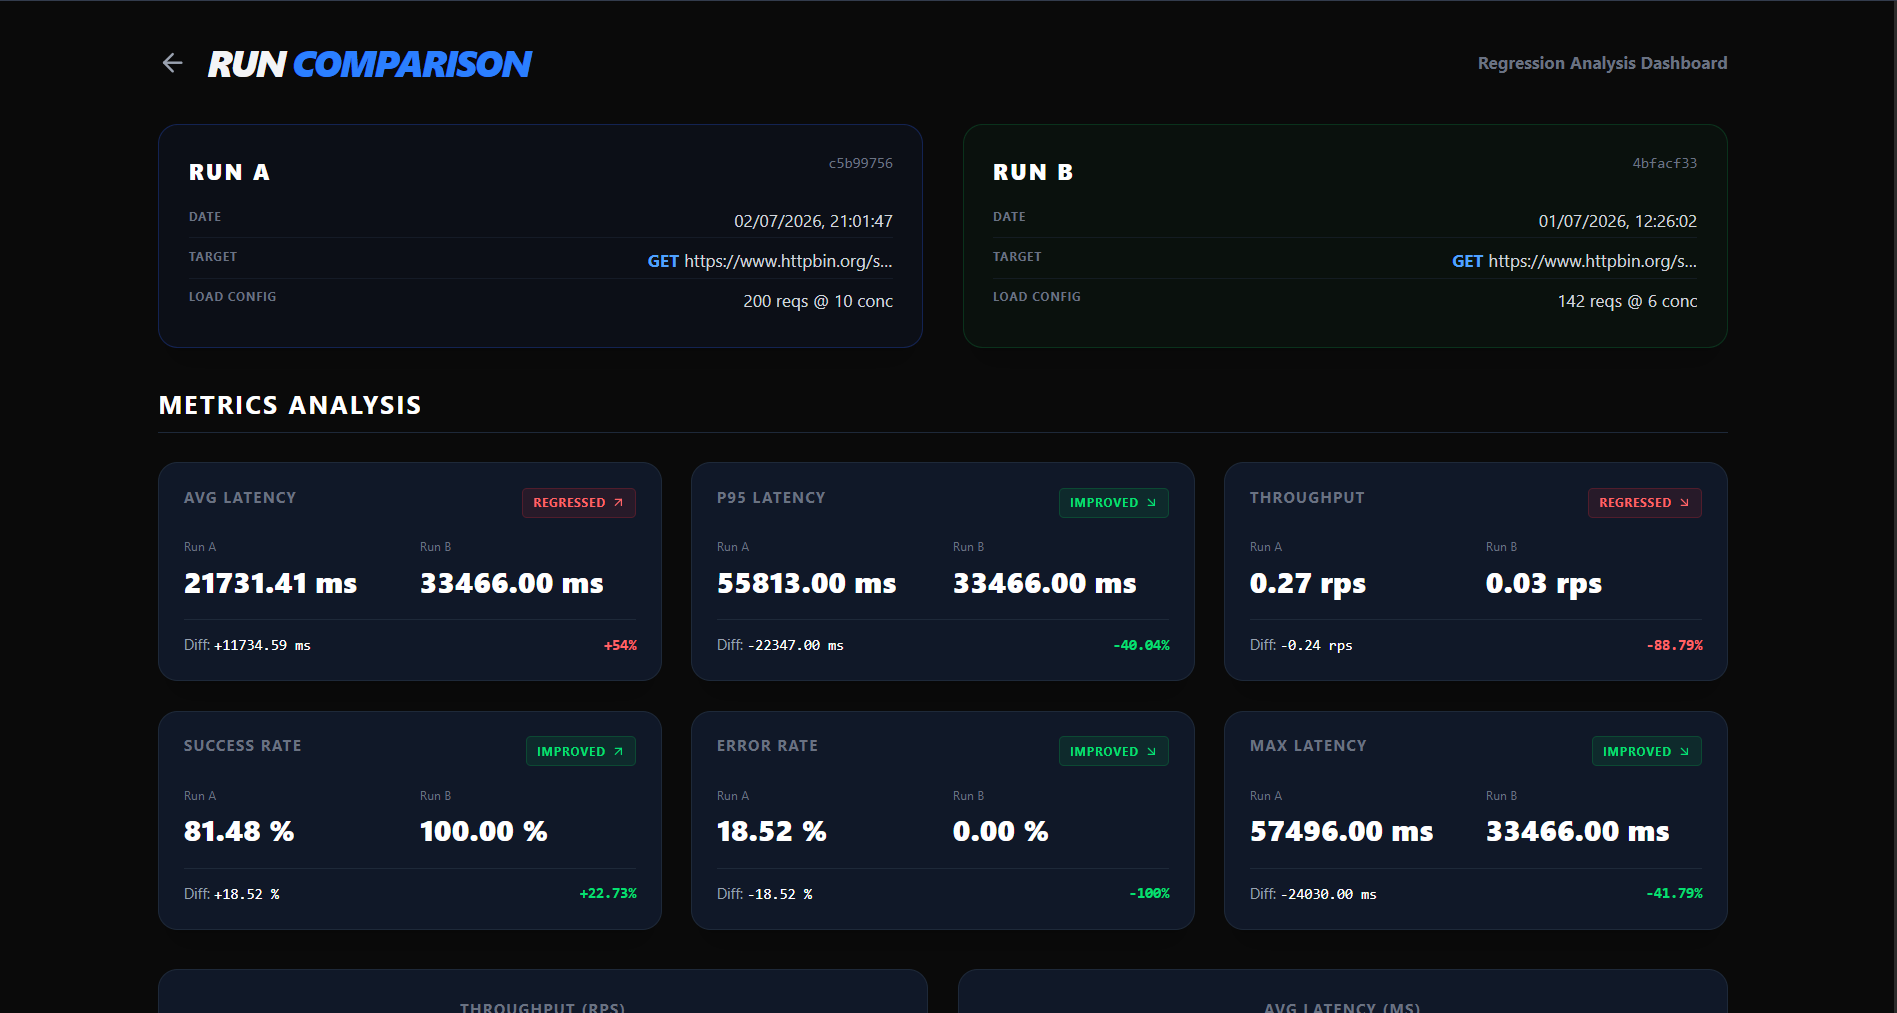
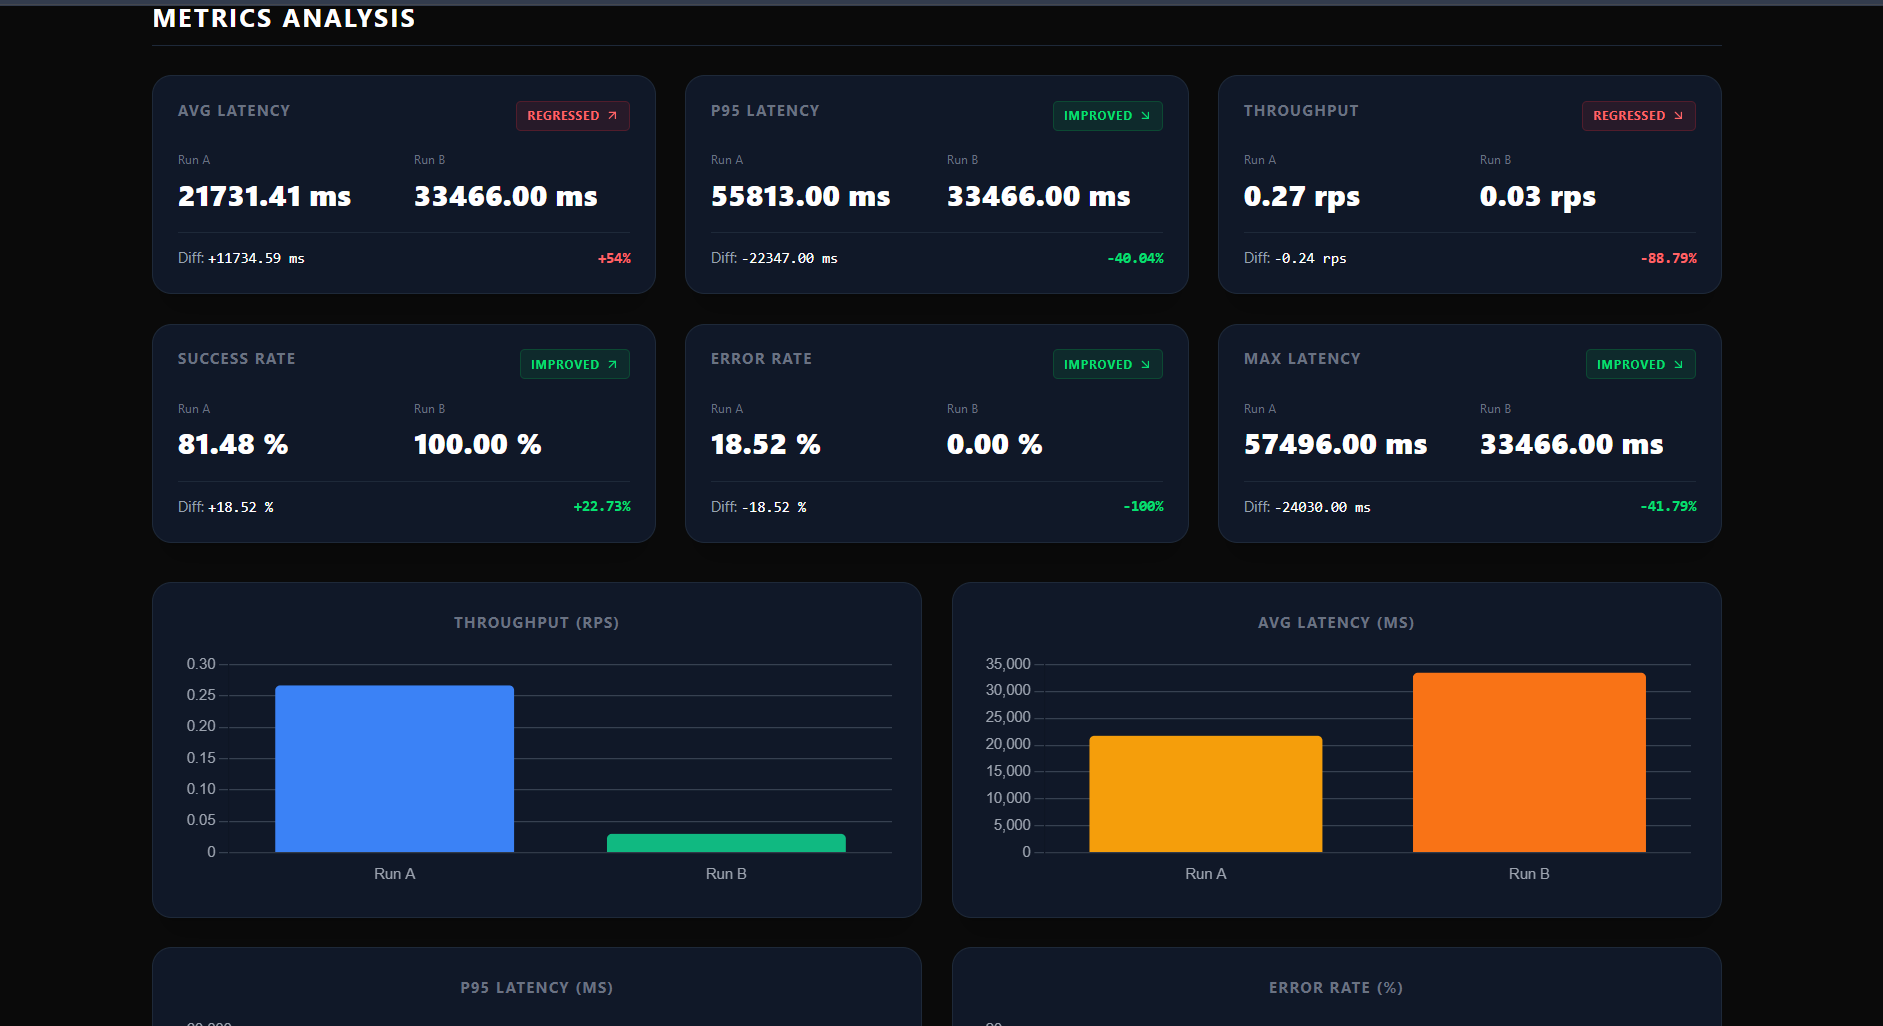
Comparator between two tests
-
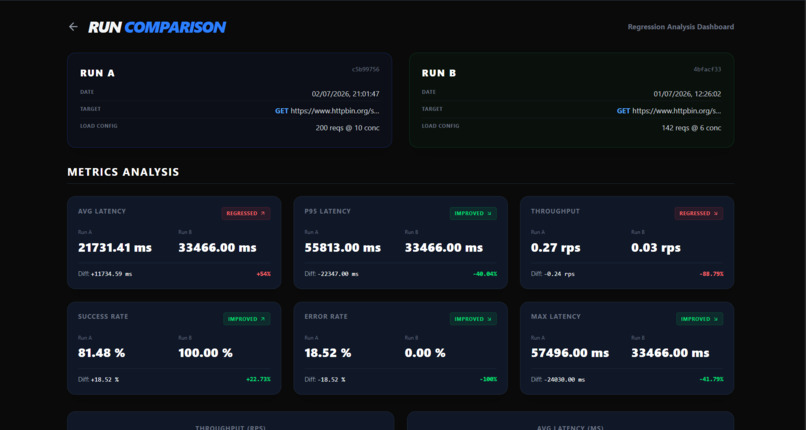
Comparison example with proper increment and recessions in different parameters.
-
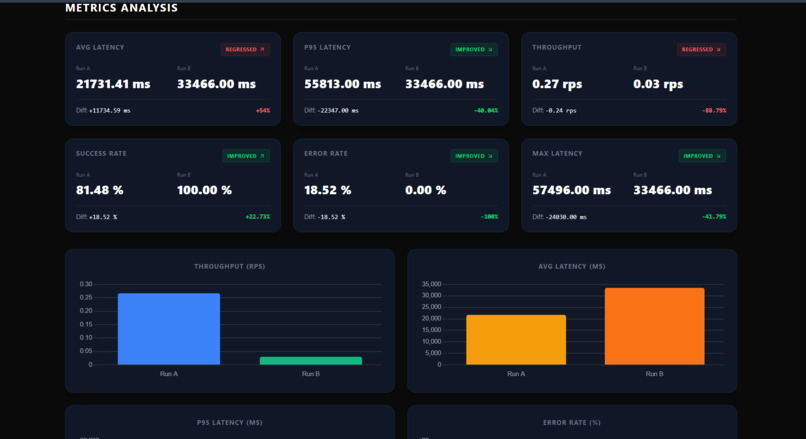
Extended view
Inspiration
Curiosity is the mother of ideas.
What it does
A high-performance, real-time API load testing and performance visualization engine. LoadViz is a developer tool built to execute high-concurrency API stress tests, track live latency/throughput metrics, and persist run histories for comparative performance regression analysis.
Note: Since stress testing arbitrary third-party endpoints from a public cloud server can trigger rate limits or security blocks, LoadViz is designed to run locally. This repository contains the complete full-stack implementation, database persistence logic, and system architecture.
How we built it
What This Project Demonstrates This project was built mainly to explore and demonstrate:
concurrency control async request scheduling load testing strategies metrics aggregation real-time visualization client-server communication performance analysis dashboards Instead of using tools like JMeter or k6, the goal was to implement the core ideas from scratch.
Architecture Overview Frontend (React + Charts) │ │ HTTP ▼ Backend API (Node.js + Express) │ │ Scheduler (Concurrency - Based, still need to work on Virtual User Model :-)) ▼ Async Request Workers │ ▼ Metrics Aggregator (Real-time Snapshots) Backend Architecture The backend is responsible for:
validating user input scheduling concurrent requests collecting metrics exposing metrics through API endpoints generating PDF reports using the metrics run comparisons 1. Input Validation Before starting a load test, the backend validates:
target URL HTTP method headers request body concurrency level total request count This prevents malformed tests from breaking the scheduler.
2. Load Test Scheduler The scheduler is the core component of the backend.
Its responsibilities:
respecting the concurrency limit sending requests in parallel batches scheduling new requests when others finish tracking total completed requests Instead of firing all requests at once, the system behaves like a controlled worker pool.
3. Request Workers Each worker performs:
send HTTP request measure latency classify response update metrics
- Metrics Aggregation Metrics are aggregated in real time during the test. -> (currently it is done through Route Polling)..
Tracked metrics include:
Request Metrics total requests completed requests failed requests success percentage error percentage categorized errors count Performance Metrics average latency minimum latency maximum latency p95 latency Throughput requests per second Example aggregation logic: View Metrics Aggregation
5. Latency Histogram Latency buckets help understand response time distribution.
Example buckets:
0-50 ms 50-100 ms 100-200 ms 200-500 ms 500+ ms Histogram logic:
buckets:[0,100,200,400,800,1000,1500,2000,3000,5000,10000,30000], counts:[0,0,0,0,0,0,0,0,0,0,0,0], 6. Error Categorization Errors are categorized into:
Category Description 2xx Successful responses 4xx Client errors 5xx Server errors Network Network failures This helps identify whether failures are caused by:
server issues client configuration problems connectivity errors Example classification logic:
errorStats: { success2xx: 0, client4xx: 0, server5xx: 0, networkErrors: 0 } 7. PDF Report Generation (NEW) The backend now supports generating professional, high-fidelity PDF reports.
Features: Vector-Based Charts: Unlike screenshots, the PDF uses vector graphics for perfectly crisp charts at any zoom level. Background Recorder: A "flight recorder" on the backend captures performance snapshots every second during the test. Comprehensive Data: Metrics Summary: Success rate, Average/P95 latency, Throughput. Performance Trends: Line charts for Throughput, Error and Success % over time. Error Distribution: Pie chart with precise category counts. Latency Histogram: Detailed bar chart showing response distribution. Example Generation Logic: View PDF Generator Report Sample Report Sample
8. Historical Runs & Run Comparison (NEW) The backend persists completed test runs in MongoDB and provides endpoints to list, query, and compare performance sessions.
Features: Persistent Storage: Saves test metrics, configuration settings (URL, method, concurrency, total requests), error statistics, latency histogram distributions, and second-by-second performance history. Side-by-Side Comparison: Exposes a comparison endpoint that calculates performance deltas (percentage improvements or regressions in latency, throughput, and success rates) between any two historical runs. Sort & Query Features: Allows querying and sorting historical runs by timestamp, average latency, p95 latency, and throughput.
Challenges we ran into
1. Asynchronous Metric Aggregation (Race Conditions) The Problem: Because I used a concurrency-controlled worker pool, I had hundreds of workers firing requests simultaneously. When they all tried to write their latency metrics to a shared array in memory at the exact same millisecond, it caused race conditions (data loss or crashes) because standard lists aren't thread-safe. The Solution: Instead of letting workers write directly to memory, I implemented a Thread-Safe Queue (or Channels). The workers instantly push their metrics into the queue, and a single, dedicated "Aggregator" thread reads from the queue to calculate the real-time stats. This completely eliminated the race conditions.
2. Socket Exhaustion / "Too Many Open Files"* The Problem: When stress-testing an endpoint with thousands of concurrent connections, the tool suddenly crashed with a socket error. I learned that operating systems treat network connections as "files", and I had hit the OS limit for open file descriptors. The Solution: I learned how to manage OS-level resources. I specifically sized my worker pool to respect the system's socket limits, and ensured that every HTTP request explicitly closed its connection (Connection: close or utilizing proper Keep-Alive pooling) so sockets weren't left dangling in a TIME_WAIT state.
3. The "Coordinated Omission" Problem The Problem: Initially, if the target API started slowing down, my worker threads would get stuck waiting for a response. Because all my workers were busy waiting, the tool actually stopped sending new requests. The tool was accidentally lowering the load when the server struggled, masking the true bottleneck! The Solution: I had to decouple the Scheduler from the Workers. Instead of a worker pacing itself, the scheduler fires requests at a constant, mathematically rigid rate into a queue, and the workers pull from it. If the server slows down, the queue builds up, proving the true latency of the system under heavy load.
Built With
- javascript
- mongodb
- node.js
- react.js

Log in or sign up for Devpost to join the conversation.