-
-
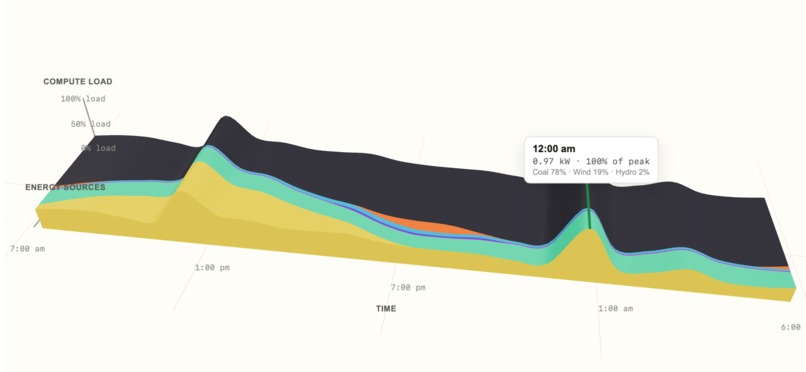
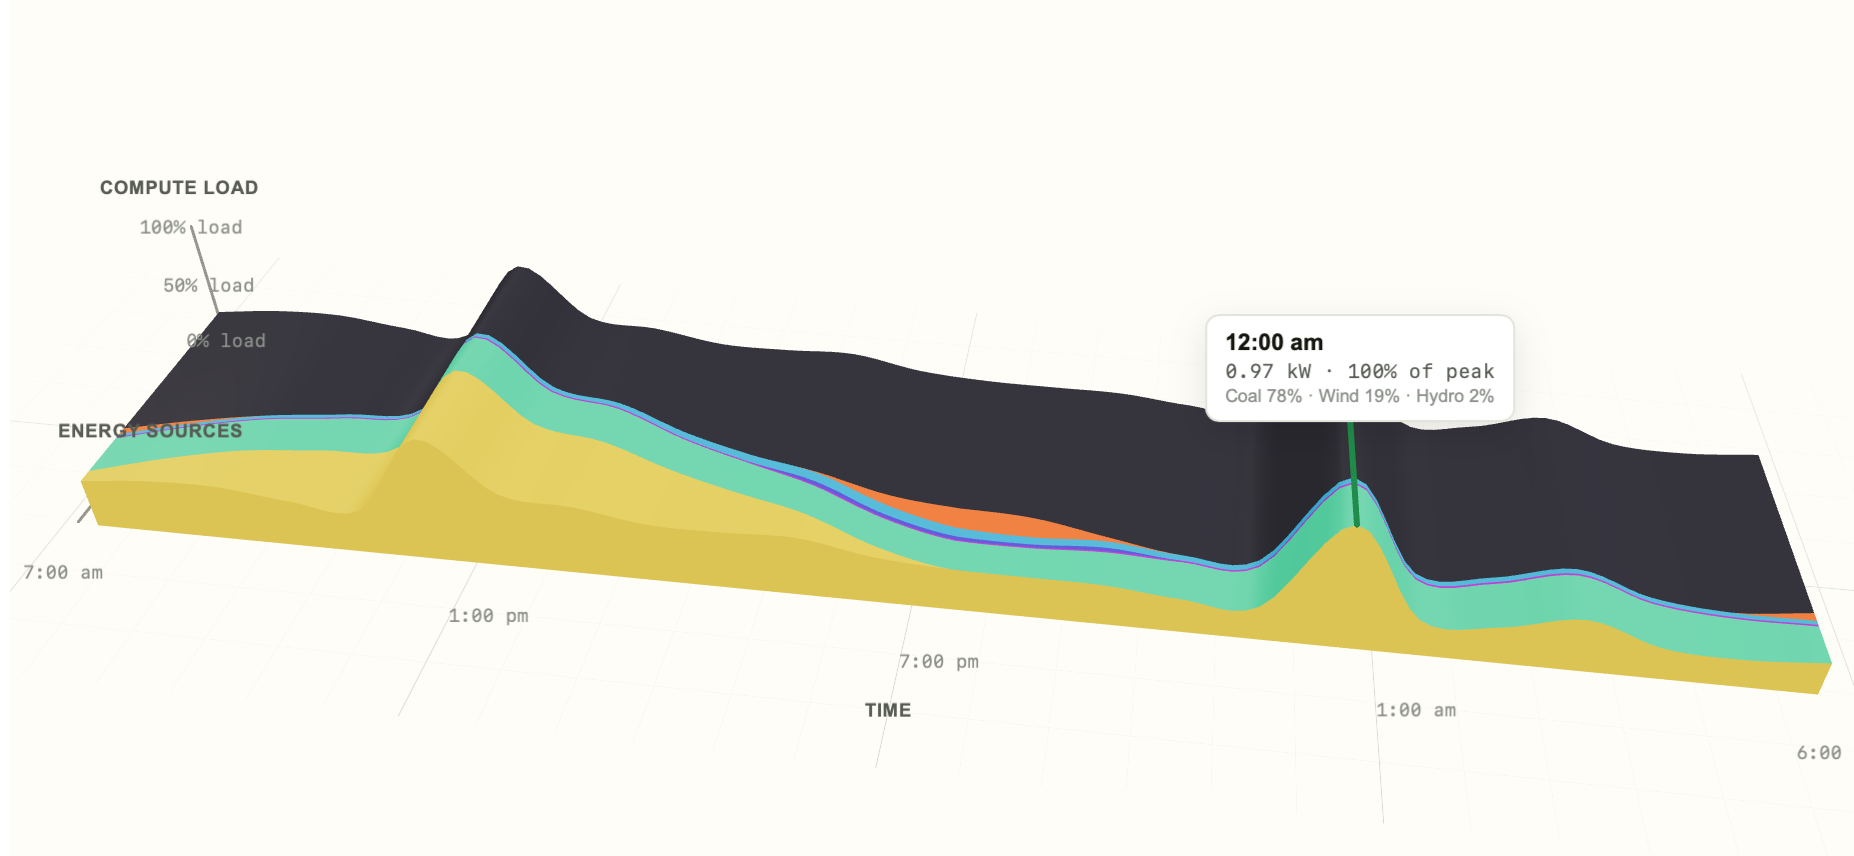
the 3D graph visualisation (core feature)
-
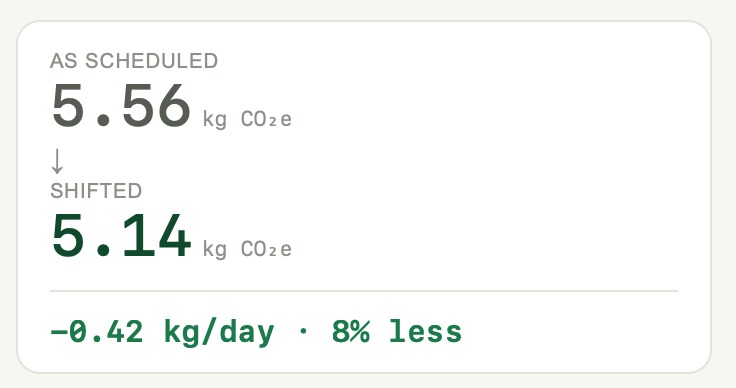
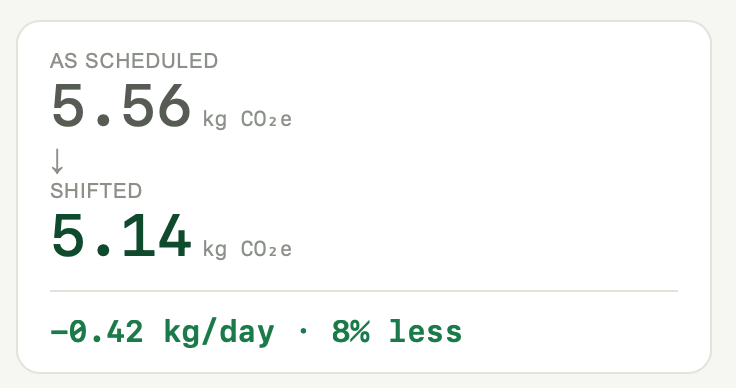
it might seem small, but imagine the sustainability at a massive scale
-
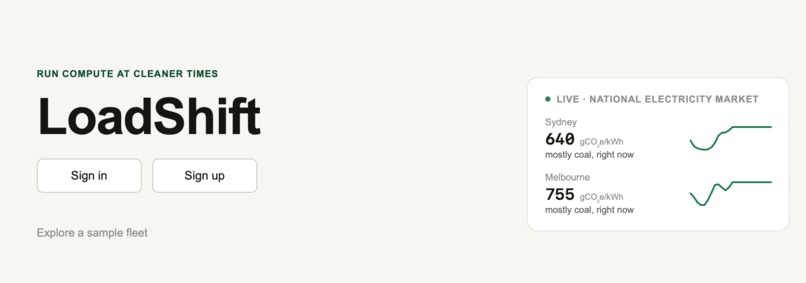
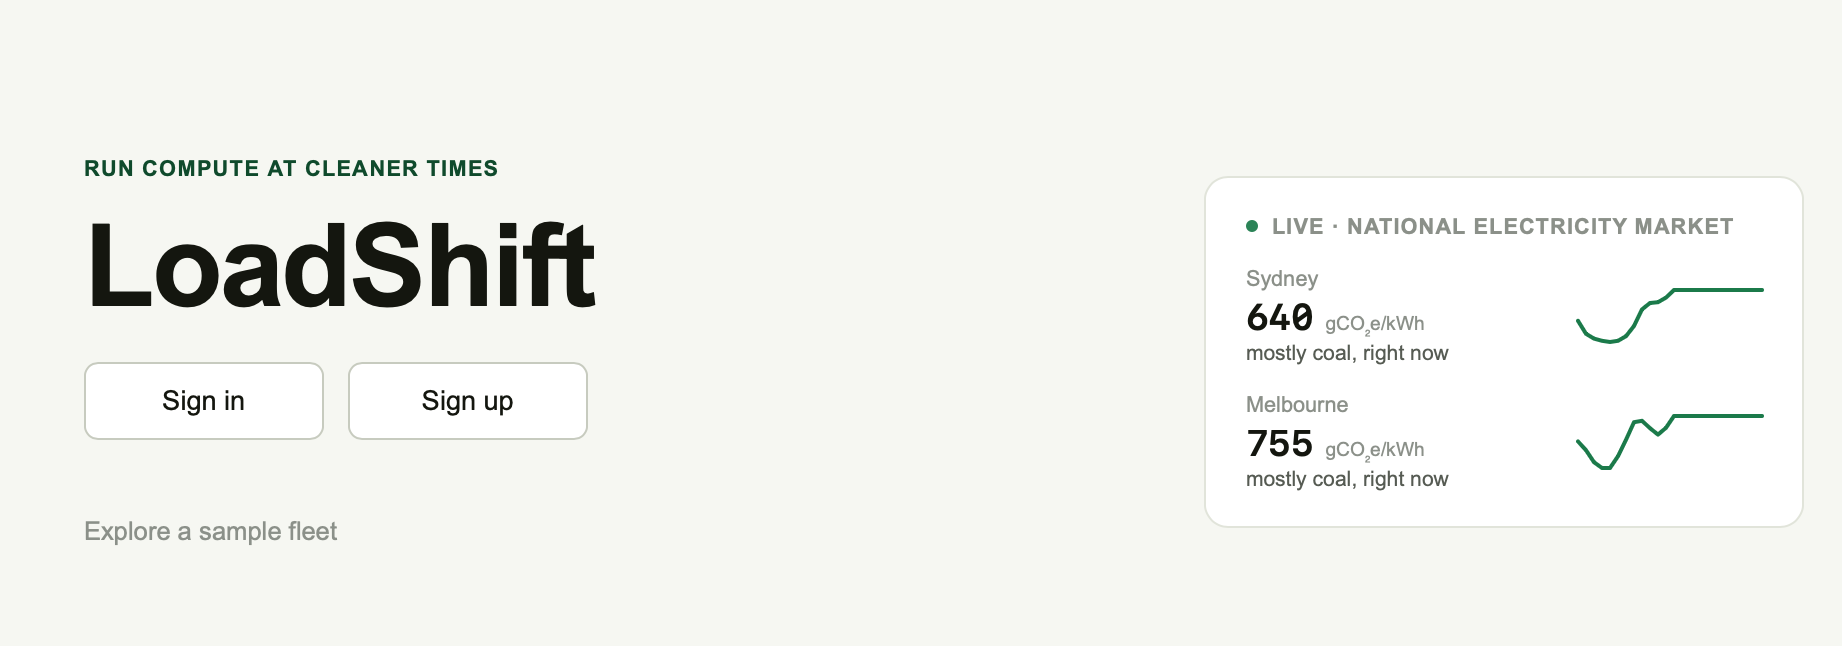
the home page with live market information
Inspiration
Data centres account for >1% of global emissions, and this is only growing. The exact same job on the exact same machine can have a wildly different carbon cost depending on what time of day it runs. Australia's National Electricity Market (NEM) swaps between coal, gas, wind, and solar hour by hour - a sunny afternoon can be running on more than half renewables, while 2am the same day is mostly by coal. Most cloud compute genuinely doesn't care when it runs. CI pipelines, batch jobs, daily reports, ML training - they can just as easily run at 3am as 3pm. I wanted to make this difference of sustainability visible and actionable.
What it does
LoadShift connects to a an AWS account through an IAM role and reads your actual running EC2 instances and their CPU history. It matches that against the same day's real hourly carbon intensity and fuel mix from the NEM, region by region, and shows you what your compute actually cost the atmosphere.
It then automatically allows you to set a per-instance slider for exactly how many hours that workload's active time can wait. Clikc Optimise and watch the whole fleet's load visibly redistribute in a live 3D scene with axes: tim, fuel mix, and compute load. The payoff is a concrete number - kg CO₂e saved per day. and a plain-language recommendation for when to actually run the work.
How I built it
Next.js on Vercel, with Supabase for auth and database. AWS handles the cross-account trust - we never see or store an access key. CPU utilisation gets turned into watts using Teads Engineering's published EC2 power profiles, and matched against Open Electricity's NEM API for real hourly emissions, energy, and fuel-mix data. The logic of the scheduler is pure math functions that run client-side. The 3D graph is built on Three.js and React Three Fiber..
Challenges I ran into
Getting AWS cross-account access was tricky and needed careful IAM planning on generation. The 3D visualization went through LOTS of iterations before I got it to feel light and intuitive. And I was careful that the optimised savings number is a real, defensible calculation - e.g. idle draw is never counted as a saving. Not just a pretty number.
Accomplishments that I'm proud of
The whole thing is real, end to end - live EC2, live CloudWatch, live NEM grid data, and an actual cross-account security model, not a demo with fake numbers. I'm proud of the 3D graph for making an invisible relationship - grid timing versus compute scheduling visually obvious instead of another bar chart.
What I learned
How genuinely dynamic the NEM is hour to hour but also how predictable patterns emerge that we can take advantage of. I also learned how much AWS-specific trust cross-account IAM complexity can get. And I learned how much of "is this workload flexible" is actually inferable from cheap, already-available signals - name, tags, CPU shape. without needing a team to change its process on day one.
What's next for LoadShift
- Turning the recommendation into action - rather than a suggestion, setting up the ability for LoadShift to directly change things in AWS can automate a lot away.
- The ability to dynamically make decisions (e.g. if renewable energy is really cheap at the moment, run EC2 instances now).
- Add an exportable CSV for data download, so the same data that helps engineers can also feed a compliance report.
- Broader coverage: more NEM regions beyond Sydney and Melbourne, and other electricity markets and clouds (GCP, Azure), and services (e.g. Lambdas).
Built With
- amazon-web-services
- next.js
- supabase
- three.js
- vercel


Log in or sign up for Devpost to join the conversation.