-
-
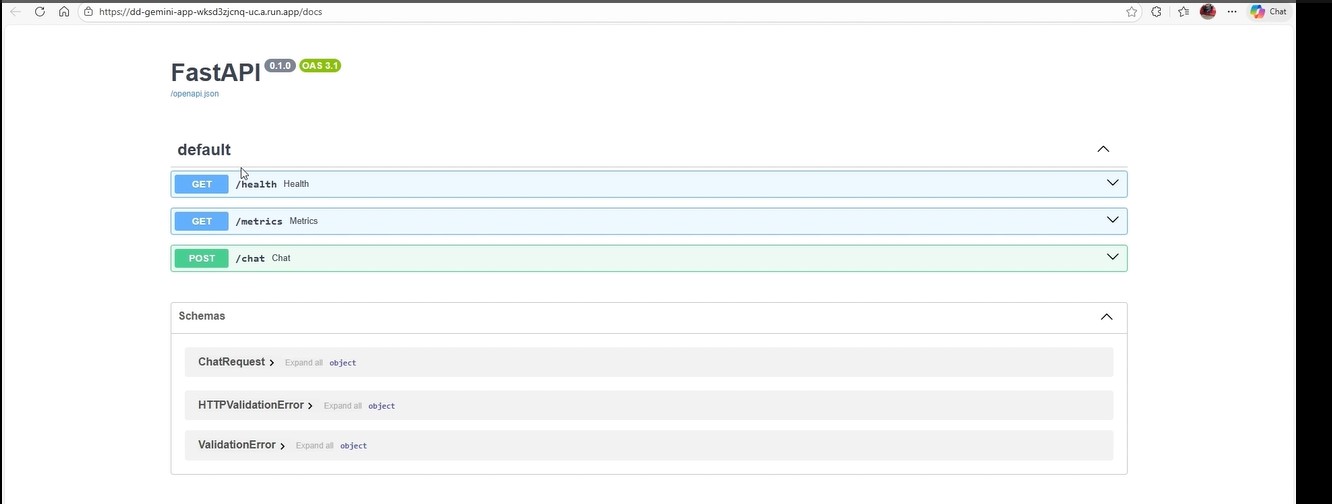
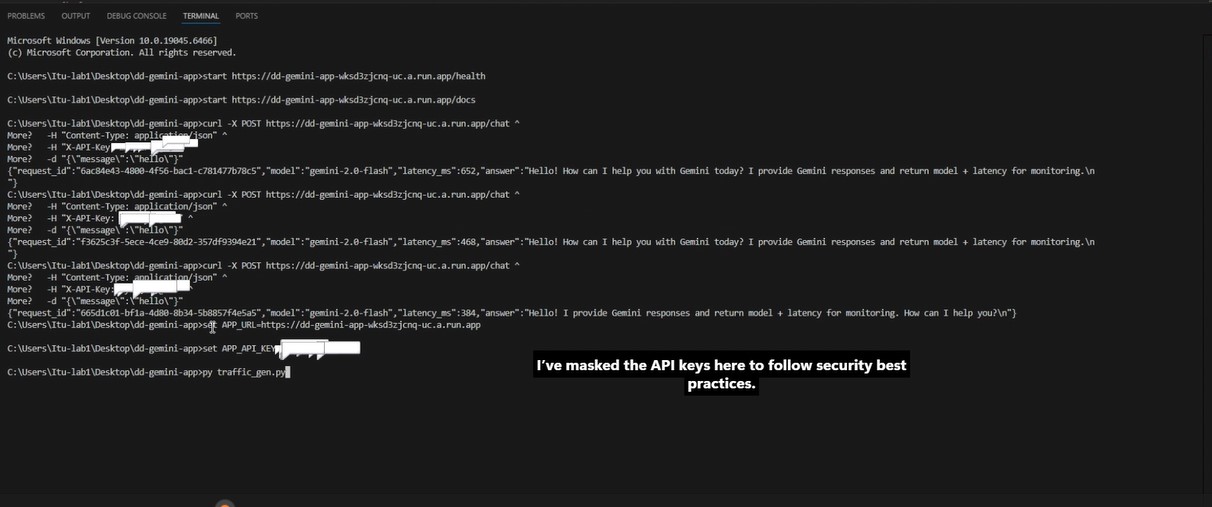
Health endpoint used for service liveness verification.
-

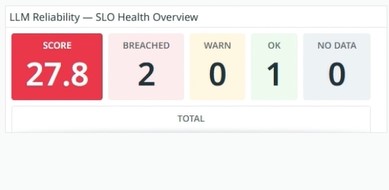
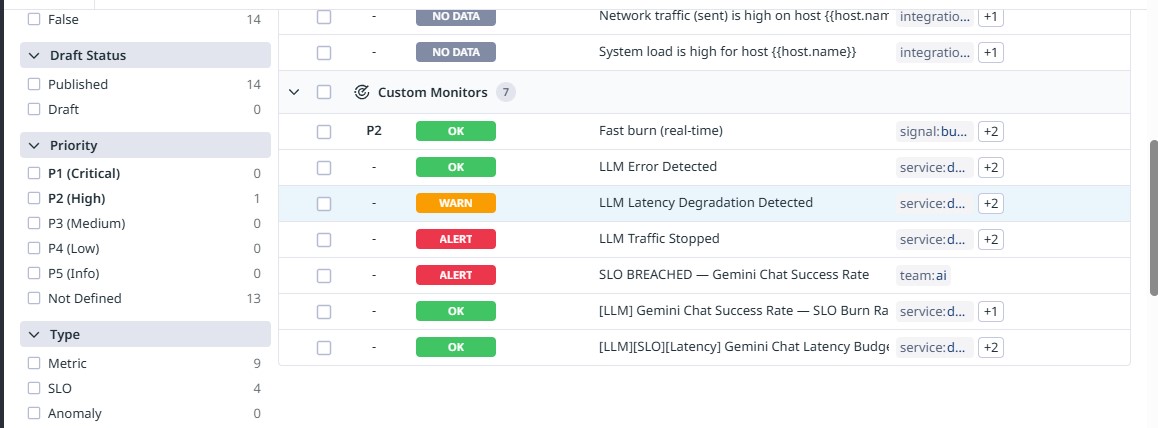
SLO health overview using error budgets to track reliability.
-
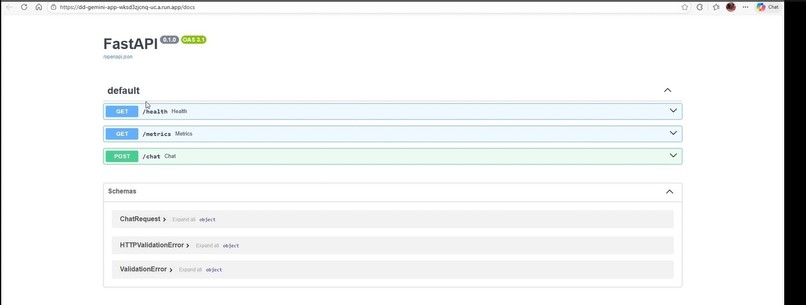
Live Cloud Run service exposing Gemini-powered endpoints.
-
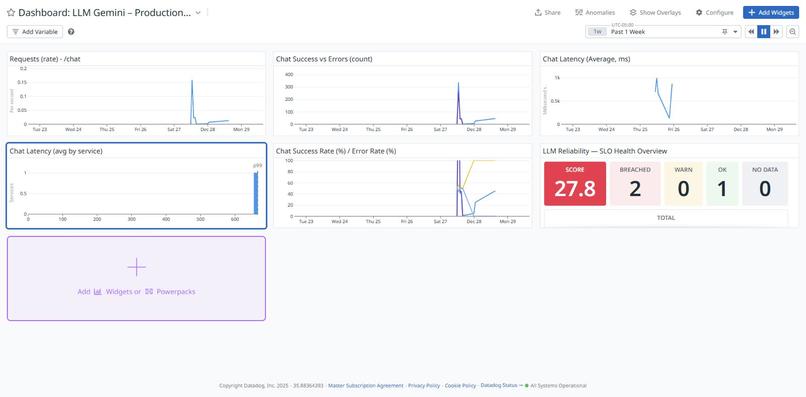
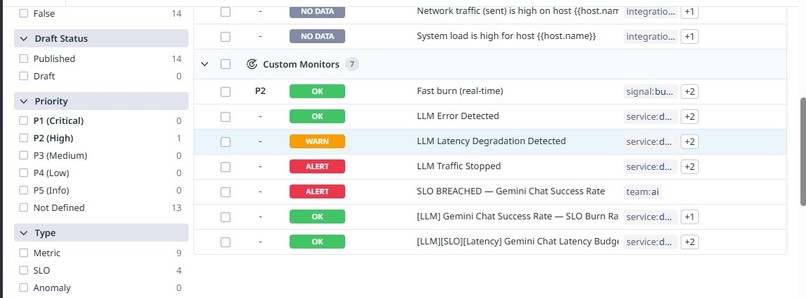
Production observability dashboard showing request volume, errors, and latency.
-
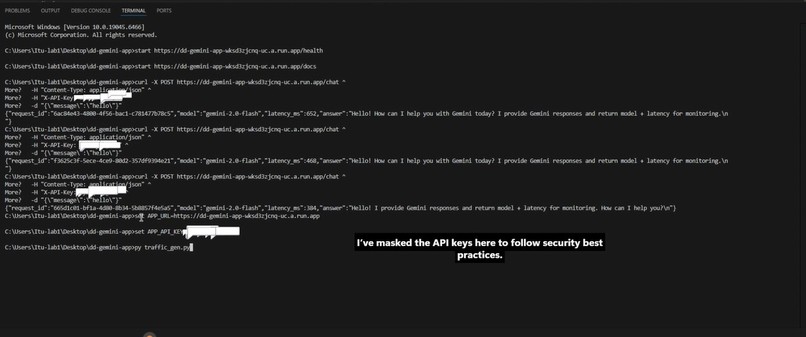
Successful Gemini inference via Vertex AI.
-
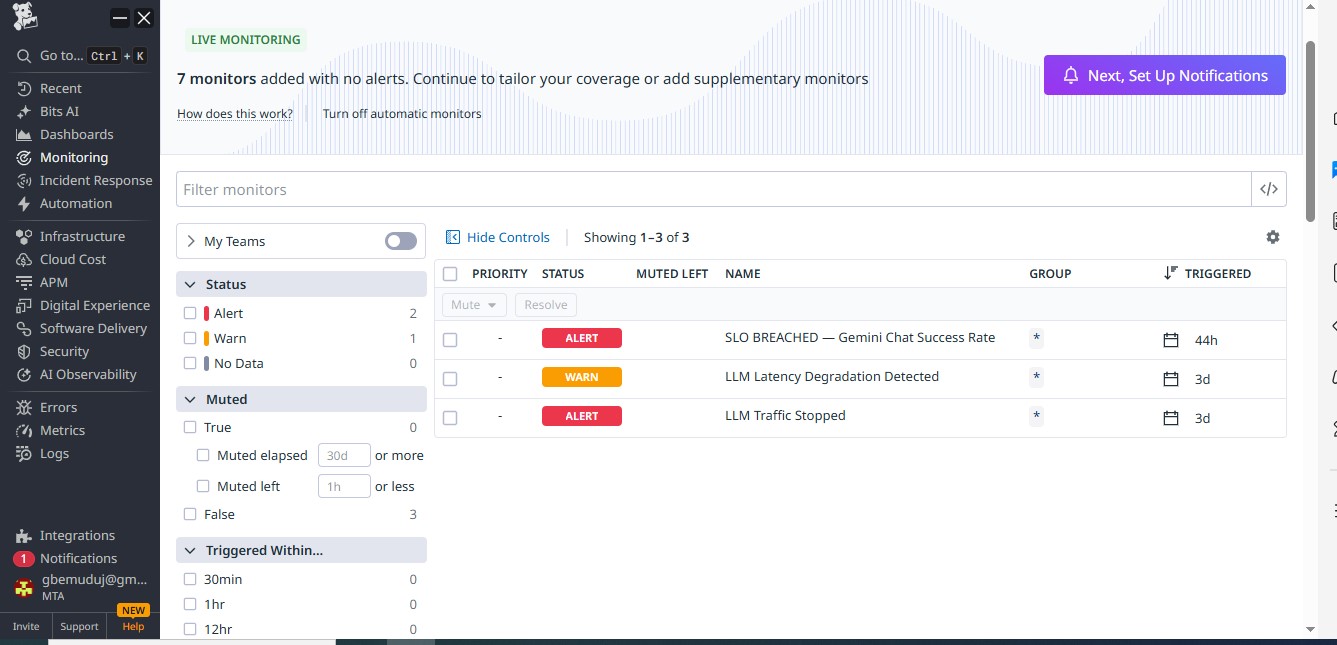
Error budget burn visualized under degraded conditions.
-
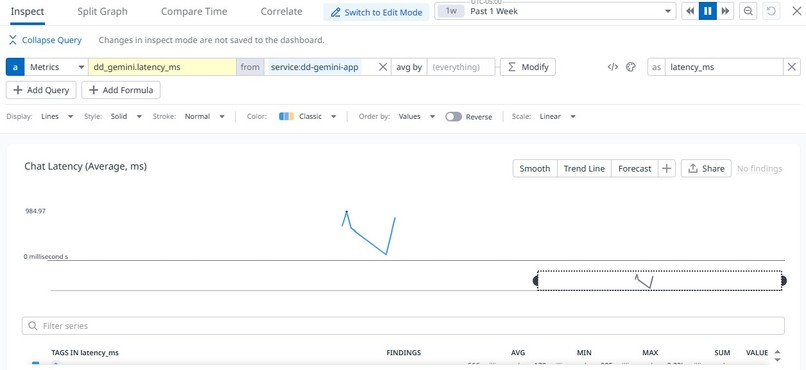
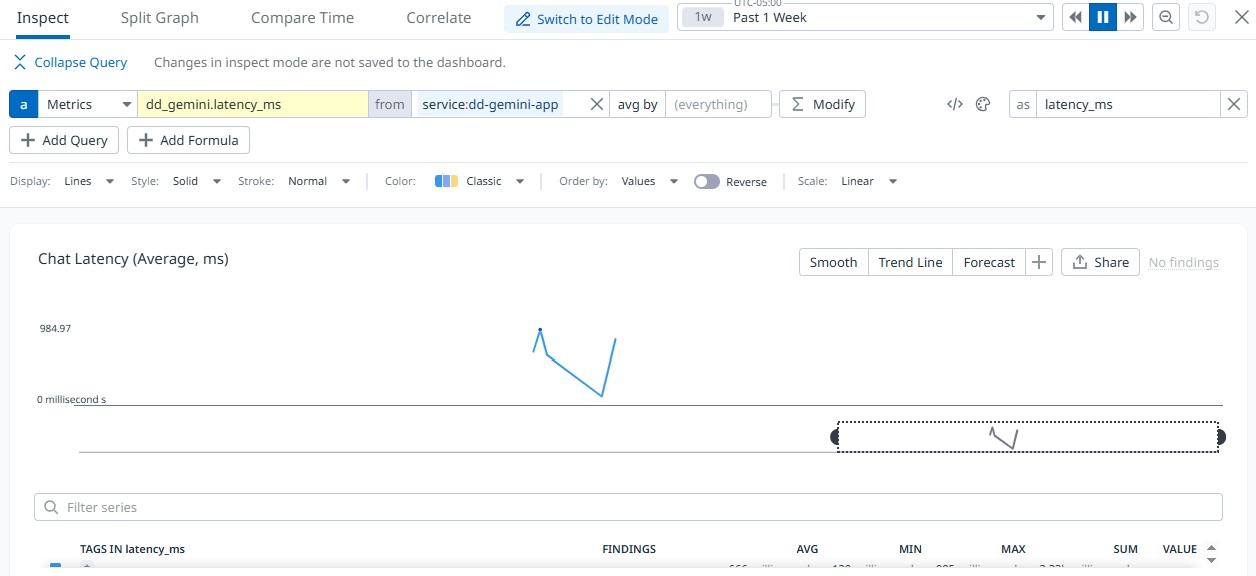
Latency trends responding to live traffic.
-

Automatic incident creation triggered by SLO breach.


Inspiration
As LLM-powered applications move into production, reliability becomes as critical as model quality. I wanted to demonstrate how traditional SRE practices, SLOs, error budgets, and burn-rate alerts, can be applied to LLM systems.
What it does
This project deploys a Gemini-powered chat API on Google Cloud Run and instruments it with Datadog to track:
- Request success vs error rates
- End-to-end latency
- SLO compliance and error budget burn
The system automatically detects reliability degradation and triggers alerts and incidents using SLO-based monitors.
How I built it
- Deployed a minimal FastAPI service on Google Cloud Run
- Integrated Gemini via Vertex AI
- Emitted custom metrics (success, error, latency) to Datadog
- Defined SLOs for success rate and latency
- Created burn-rate monitors and alert-driven incidents
- Visualized reliability via Datadog dashboards
Challenges
The main challenge was modeling LLM reliability correctly, especially ensuring metrics were emitted in a way compatible with Datadog SLOs and avoiding common pitfalls with averages vs counts. Designing Meaningful Observability for LLMs A key challenge was deciding what signals actually represent LLM health, beyond simple uptime. How I addressed it: Focused on success rate, latency, and error budgets Modeled reliability using SLOs instead of raw metrics Used burn-rate–based detection instead of static thresholds
Metric Semantics: Count vs Gauge vs Distribution Datadog requires careful alignment between metric type and how it’s queried. Early attempts caused visualization and aggregation errors.
How I addressed it: Standardized request and error metrics as count metrics Emitted latency as a distribution metric Built dashboards and SLOs only on compatible metric types
Triggering Actionable Alerts (Not Just Charts)
A major challenge was ensuring that detection rules resulted in real operational action, not passive dashboards.
How I addressed it: Created SLO-based burn rate monitors Connected monitors to Datadog Incident Management Ensured alerts carried clear context for an AI engineer to ac

Log in or sign up for Devpost to join the conversation.