-
-
-
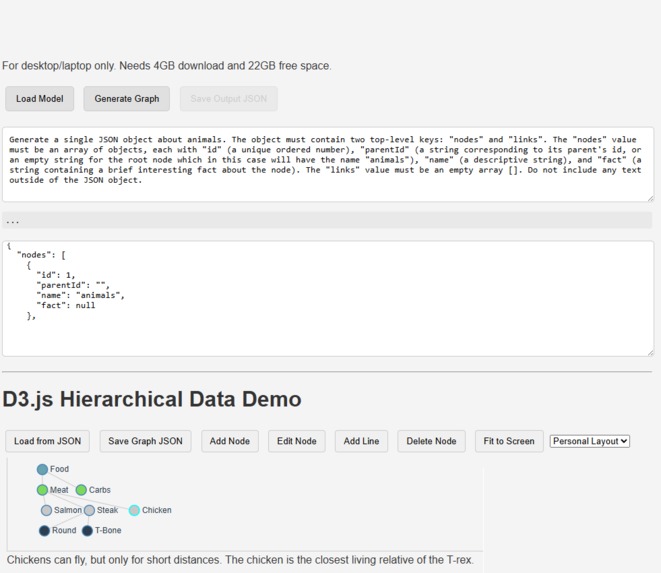
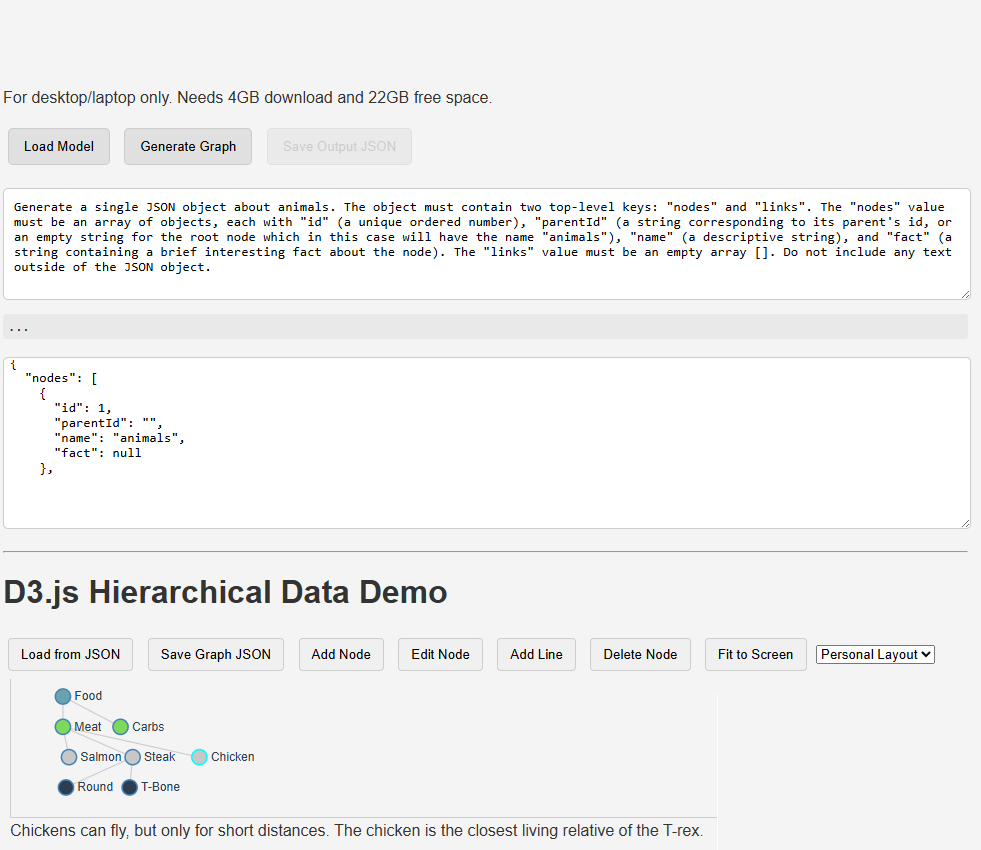
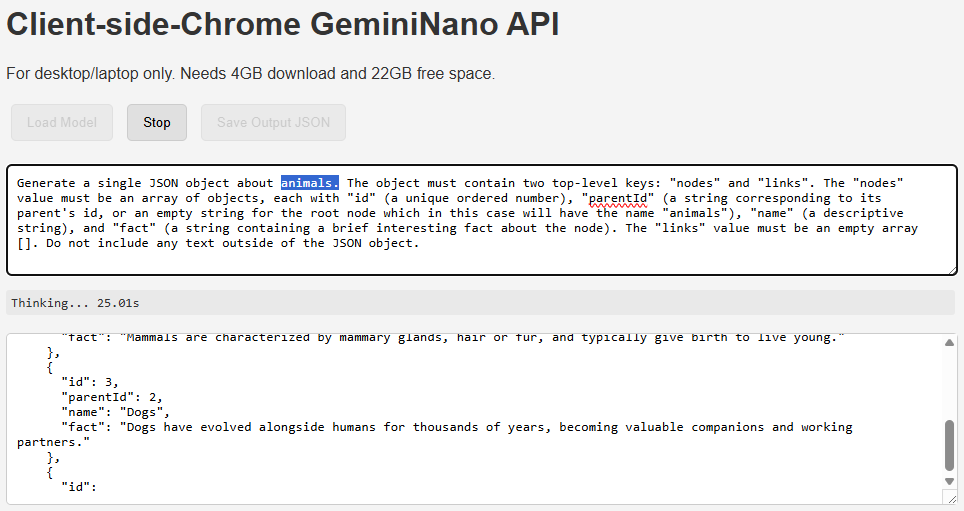
Generate online or offline about any topic
-

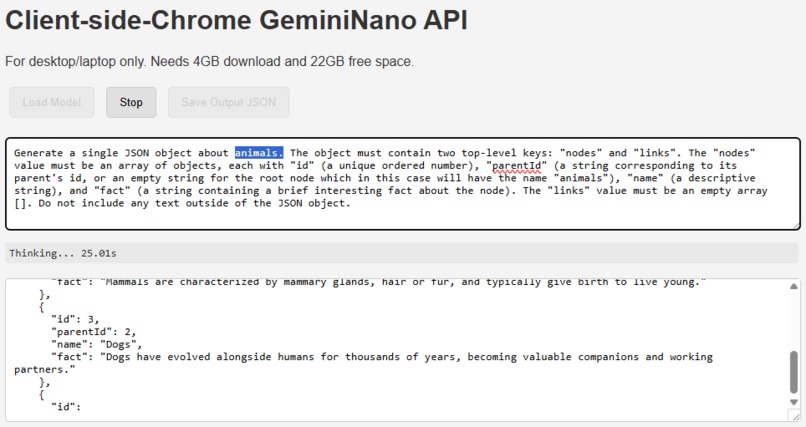
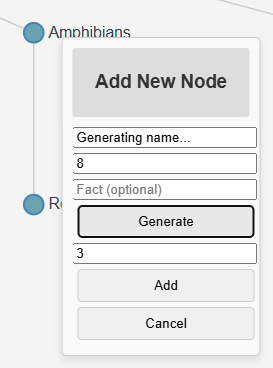
Generate more nodes
-

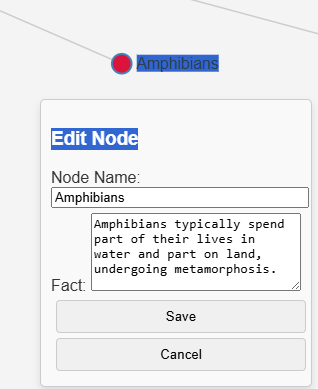
Edit nodes
-
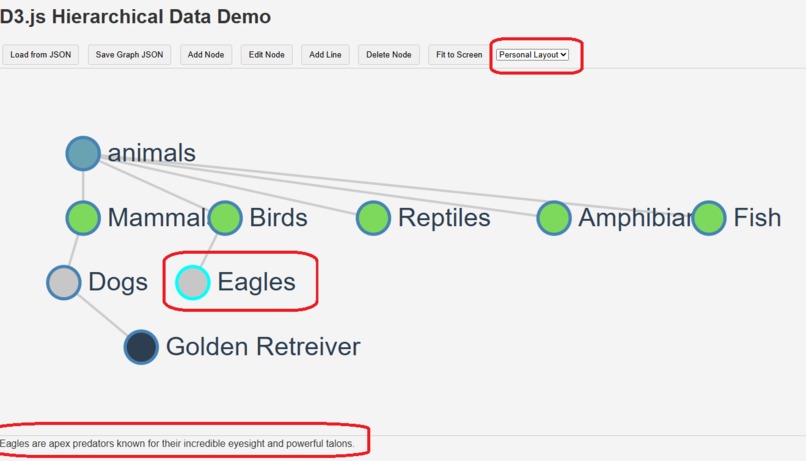
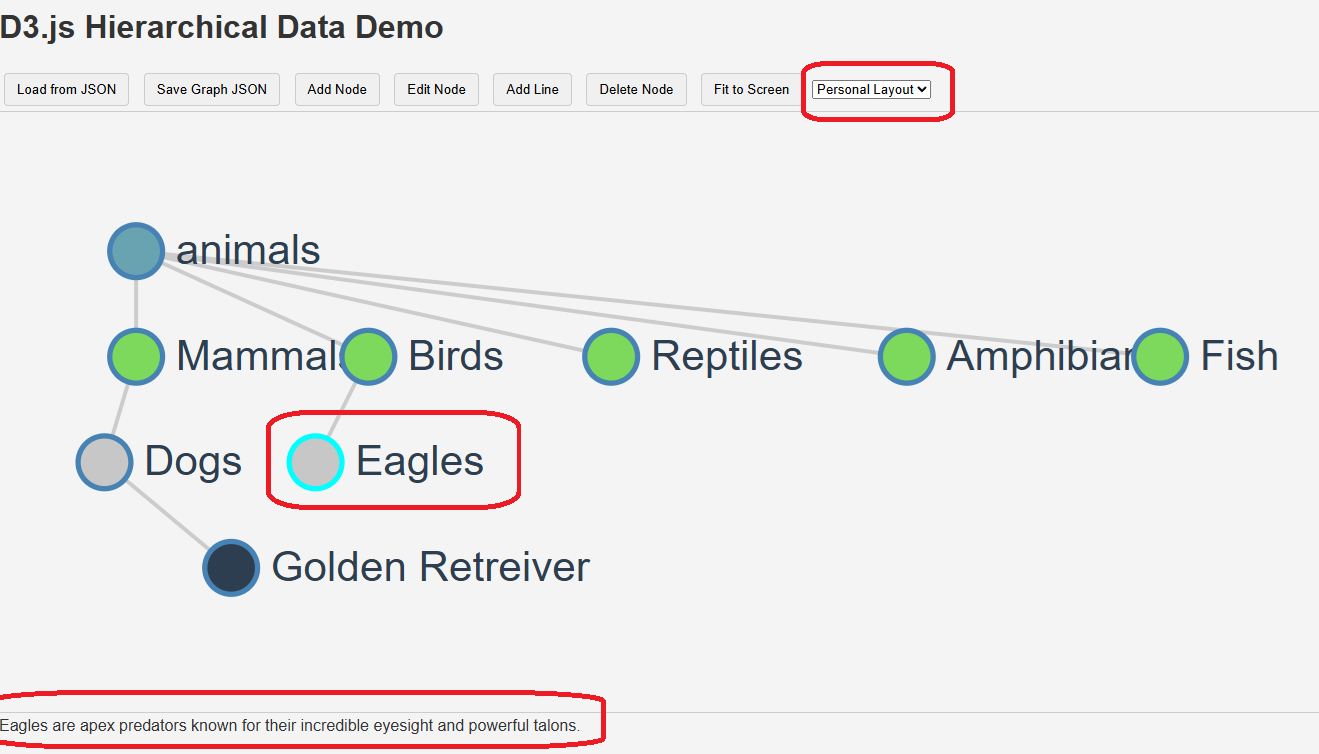
Nodes can be moved around and saved n JSON format
Inspiration
This project was inspired by the idea that creativity and thought aren't always linear. While large language models excel at producing text, many people, like yourself, think in a blend of visual concepts, language, and logic. This tool aims to bridge that gap by providing a visual sandbox for exploring ideas. It takes the abstract output of a large language model and places it into a concrete, interactive graph that you can touch, move, and connect. It's a way to externalize thought, making it easier to see patterns and relationships that might be hidden in a purely text-based format.
What It Does
This is a dynamic, interactive knowledge graph designed to be built and managed entirely within the browser. It starts with a single "root" node and allows you to build a visual network of concepts and facts.
The core functionality includes:
- AI-Powered Node Generation: You can click to have the Chrome Built-in AI LLM automatically generate a new concept name and a related fact based on a selected parent node. This is a key demonstration of on-device creative collaboration.
- Simple SVG Visualization: The entire graph is drawn using simple SVG elements and vanilla JavaScript for all visualization and drag-and-drop interactions, avoiding complex external libraries.
- Arbitrary Line Connections: You can select multiple nodes to draw new "arbitrary lines" between them, allowing you to visually represent complex, non-hierarchical relationships.
- Local Persistence: The entire graph is saved directly to your browser's local storage, ensuring your work is saved and accessible without an internet connection.
How We Built It
The application is built entirely within a single HTML file, keeping it simple and easy to understand for teaching purposes, using only core web technologies:
- HTML, Simple JavaScript, Minimal Inline CSS: These form the entire application. The code prioritizes simple and readable structure for students.
- Vanilla JavaScript & SVG: The front-end uses plain JavaScript to manipulate the SVG DOM, handling all data visualization, drawing of nodes (circles and text), links (lines), and managing the drag-and-drop interactions. No visualization libraries (like D3.js) are used.
- Local AI Integration: It connects directly to the Chrome Built-in AI Prompt API to generate new concepts and facts, allowing the project to run locally and offline after the initial model download.
- Coding Style Compliance: All variables and functions are descriptively named with the
myprefix and are in camelCase, and modernasync/awaitsyntax is used for API calls, strictly following the preferred simple coding style for students.
Challenges We Ran Into
The biggest challenge was handling the complex interplay between simple SVG drawing and the dynamic data.
- Drawing Stability (NaN Errors): We encountered a common issue where JavaScript would generate a NaN (Not a Number) error when trying to draw a link. This happened because the coordinate data for a connected node was not yet available or was missing. We solved this by adding a robust JavaScript filter that ensures every link has both a valid source and a target with valid coordinates before it is drawn.
- Managing Selection State: We needed a reliable way to keep track of which nodes were selected for adding new lines, especially after the data array was updated and the SVG was redrawn. This was solved by using a temporary identifier to save the selection state and then reapplying it after the DOM update.
- Maintaining Code Simplicity: Ensuring the SVG drawing logic remained straightforward and easy to teach, despite the complexity of managing a dynamic network graph with basic JavaScript.
Accomplishments That We're Proud Of
- Seamless Local AI Integration: The ability to generate a new node with a single click, complete with a relevant name and fact, truly transforms this from a simple visualization tool into a creative thought partner, driven entirely by on-device AI.
- Pure Vanilla JS/SVG Visualization: Successfully building a complex, interactive graph visualization using only basic JavaScript and SVG, proving that external libraries are not always necessary for advanced visual concepts in a teaching environment.
- Local Data Persistence: By using local storage, the graph is a living document that can be accessed without a network connection, making the project self-contained and ideal for teaching.
What We Learned
We learned that combining a powerful local language model with simple SVG/JavaScript manipulation creates a synergistic effect, enabling a unique form of human-AI collaboration that is easily deconstructed for students. We also learned critical lessons in defensive JavaScript programming, specifically the importance of always validating data when working with asynchronous operations and dynamic DOM updates.
What's next for LLM Node View
- Relationship Labeling: Add the ability to label the lines themselves with different kinds of relationships, like "is a part of" or "is an example of," and give the AI the ability to suggest or fill in these facts.
- Visual Enhancements: Introduce simple, JavaScript-driven layout algorithms (not full force-directed graphs) to handle larger and more complex knowledge networks more gracefully.
- Node Summaries: Allow a user to select a cluster of nodes and prompt the local LLM to generate a summary of their combined concepts.
Built With
- built-in-ai
- chrome
- chrome-built-in-ai
- d3.js
- javascript

Log in or sign up for Devpost to join the conversation.