-
-

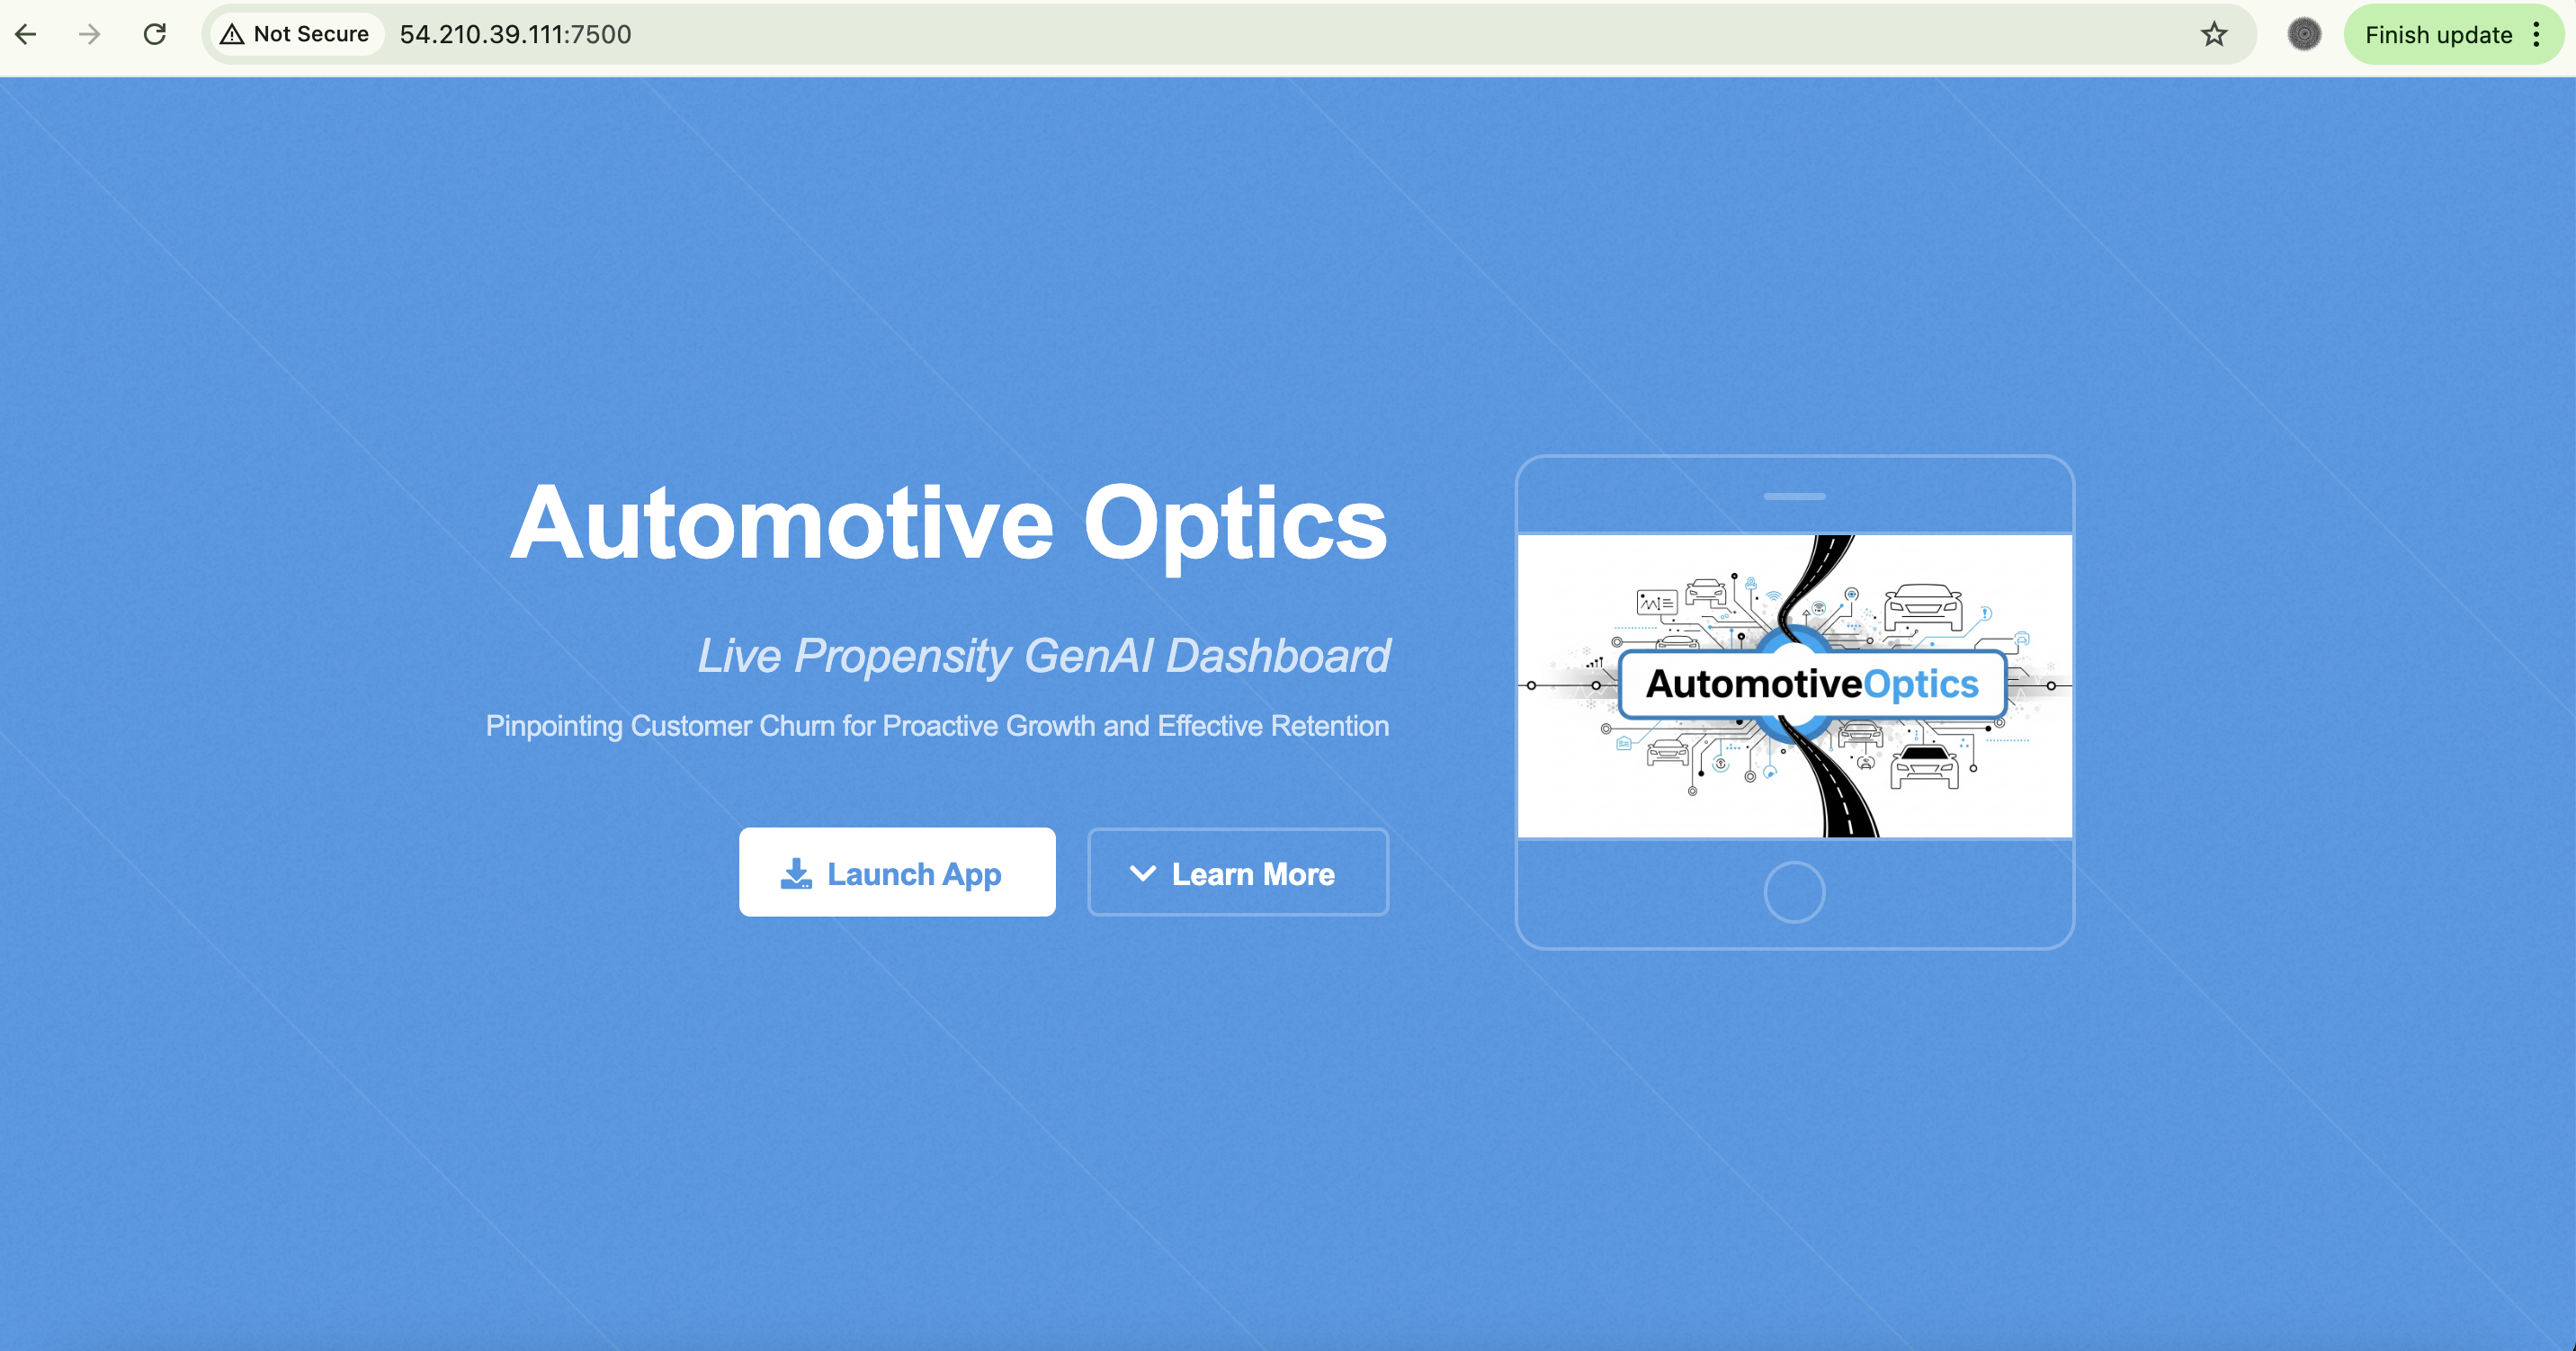
Landing
-
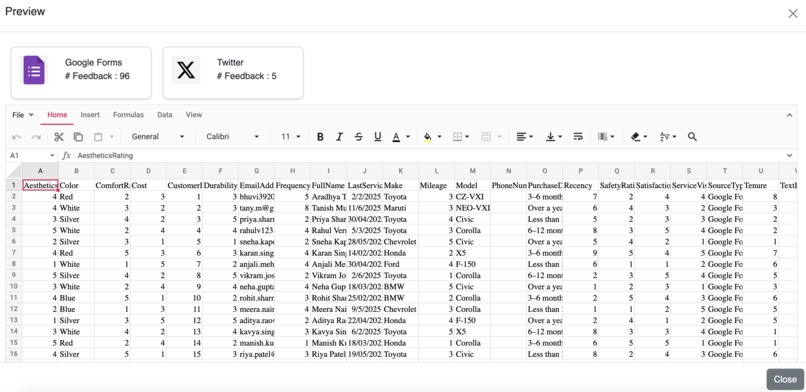
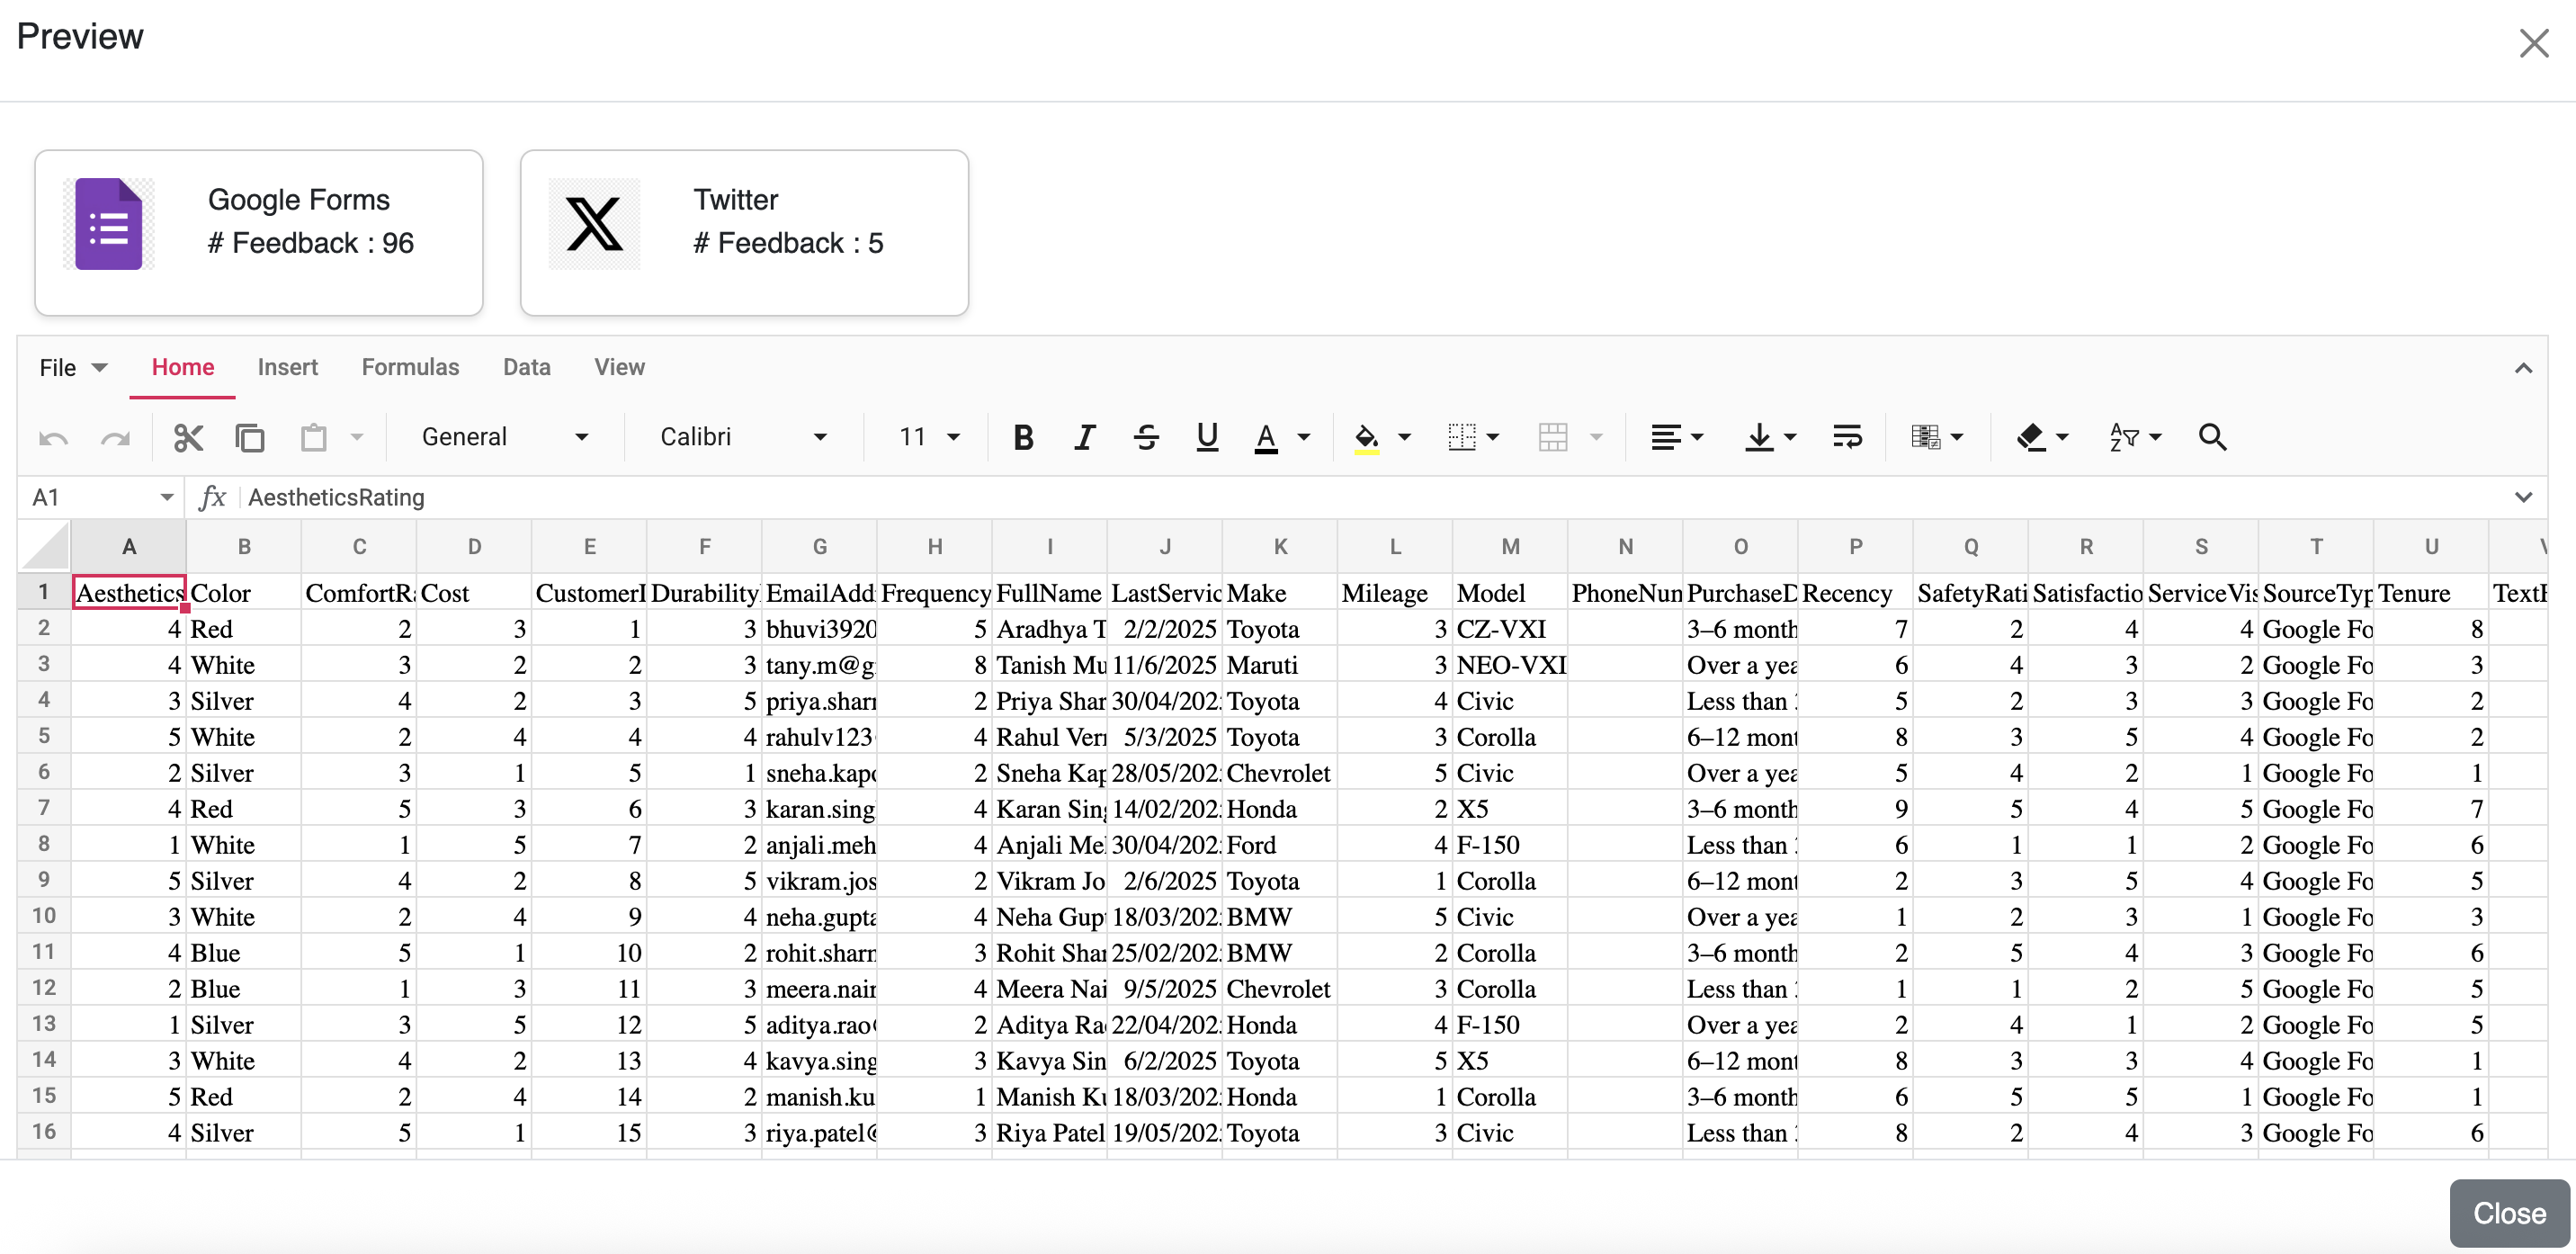
Feedback Data
-

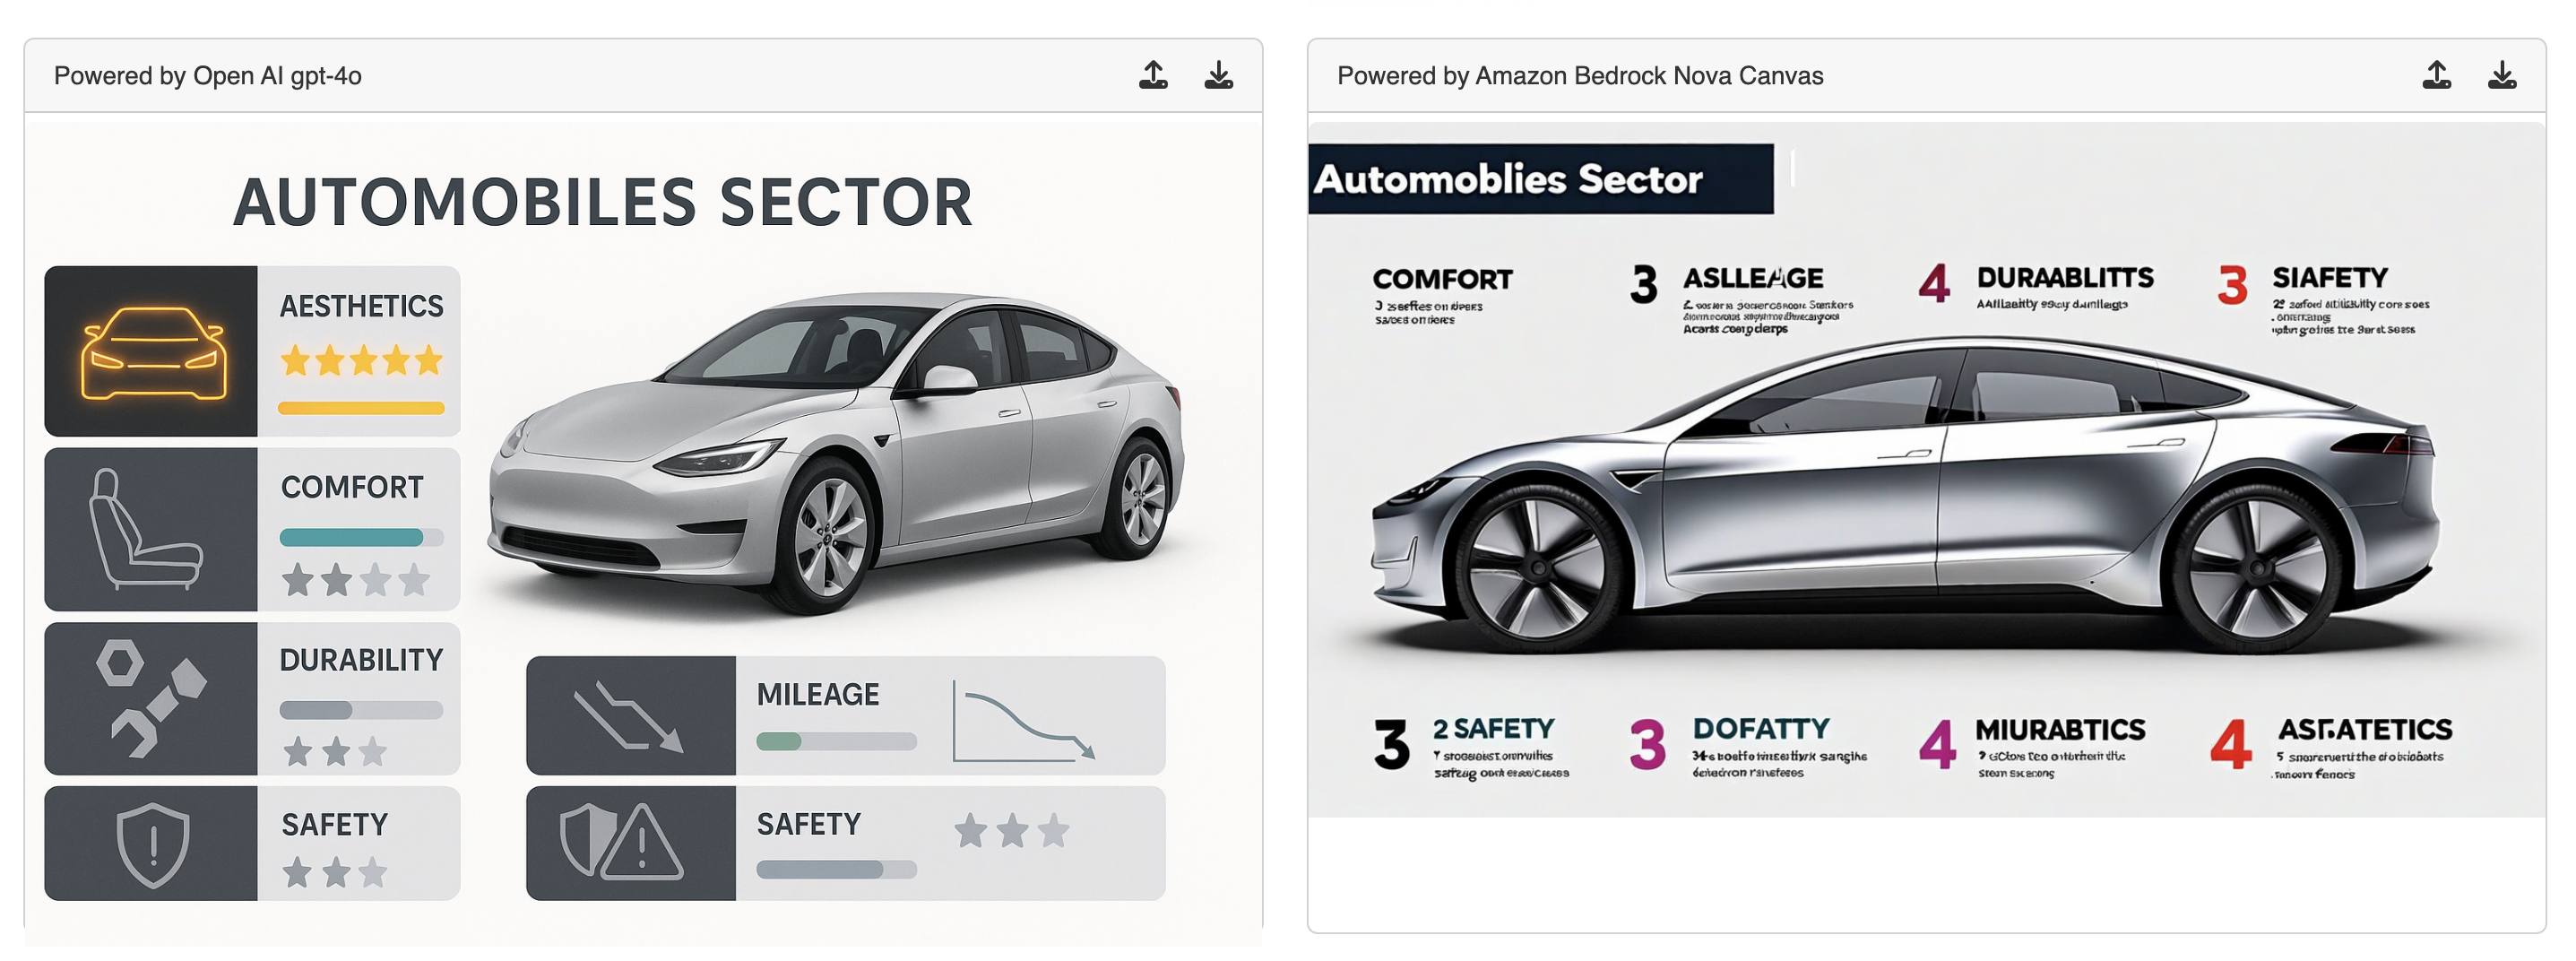
Image generation
-

Image generation
💡 Inspiration
In today's hyper-competitive automotive industry, customer retention is not just a goal; it's critical for survival and growth. A single lost customer represents a significant loss in revenue and brand loyalty.The sheer volume of feedback from sources like fake reviews, social media, and feedback forms, while valuable, often makes it incredibly difficult to pinpoint the exact reasons customers are leaving.
Our inspiration is to build a solution that can analyze this data to uncover the "why" behind churn. Understanding the precise churn reasons is the first step towards developing effective, proactive customer retention and engagement strategies. This kind of solution could truly revolutionize how businesses approach customer loyalty.
⚙️ What it does
Automotive Optics is designed to predict customer churn and customer propensity from various behaviors in the Automobiles industry. It streamlines the entire process from data ingestion to actionable insights:
Flexible Data Ingestion: Businesses can easily configure and connect to multiple data channels (e.g., Google Forms, Twitter, YouTube, Facebook) and their regular feedback systems. Users define collection schedules (daily, weekly, etc.) and specify keywords for our engine to search and collect relevant feedback across 7 critical areas including Safety, Durability, Aesthetics, and more.
Transparent Data Management: All collected raw feedback data is securely stored in Mongo DN which is fully compatible with AWS DynamoDB. Users gain full visibility through a data preview UI, allowing them to inspect the incoming information.
Intelligent Data Normalization & Mapping: We transform raw feedback into a normalized dataset, critical for accurate predictions. For each domain, we provide a set of predefined target columns. A dedicated mapping screen allows users to connect source data to these targets using three flexible methods:
- Direct Map: For straight value transfers.
- Banding: For scaling data into defined min/max ranges.
- Prompt (Amazon Bedrock Nova Lite LLM-powered): Leveraging the Amazon Bedrock Nova Lite LLM, we generate a nuanced score within a configured min/max range based on the sentiment and content of text feedback, uncovering deeper context.
Machine Learning for Churn Prediction: The core of our predictive power lies here. We leverage this rich, normalized dataset to train a Logistic Regression machine learning model specifically for churn prediction. This trained model is then used to forecast the likelihood of customer churn, providing vital proactive insights.
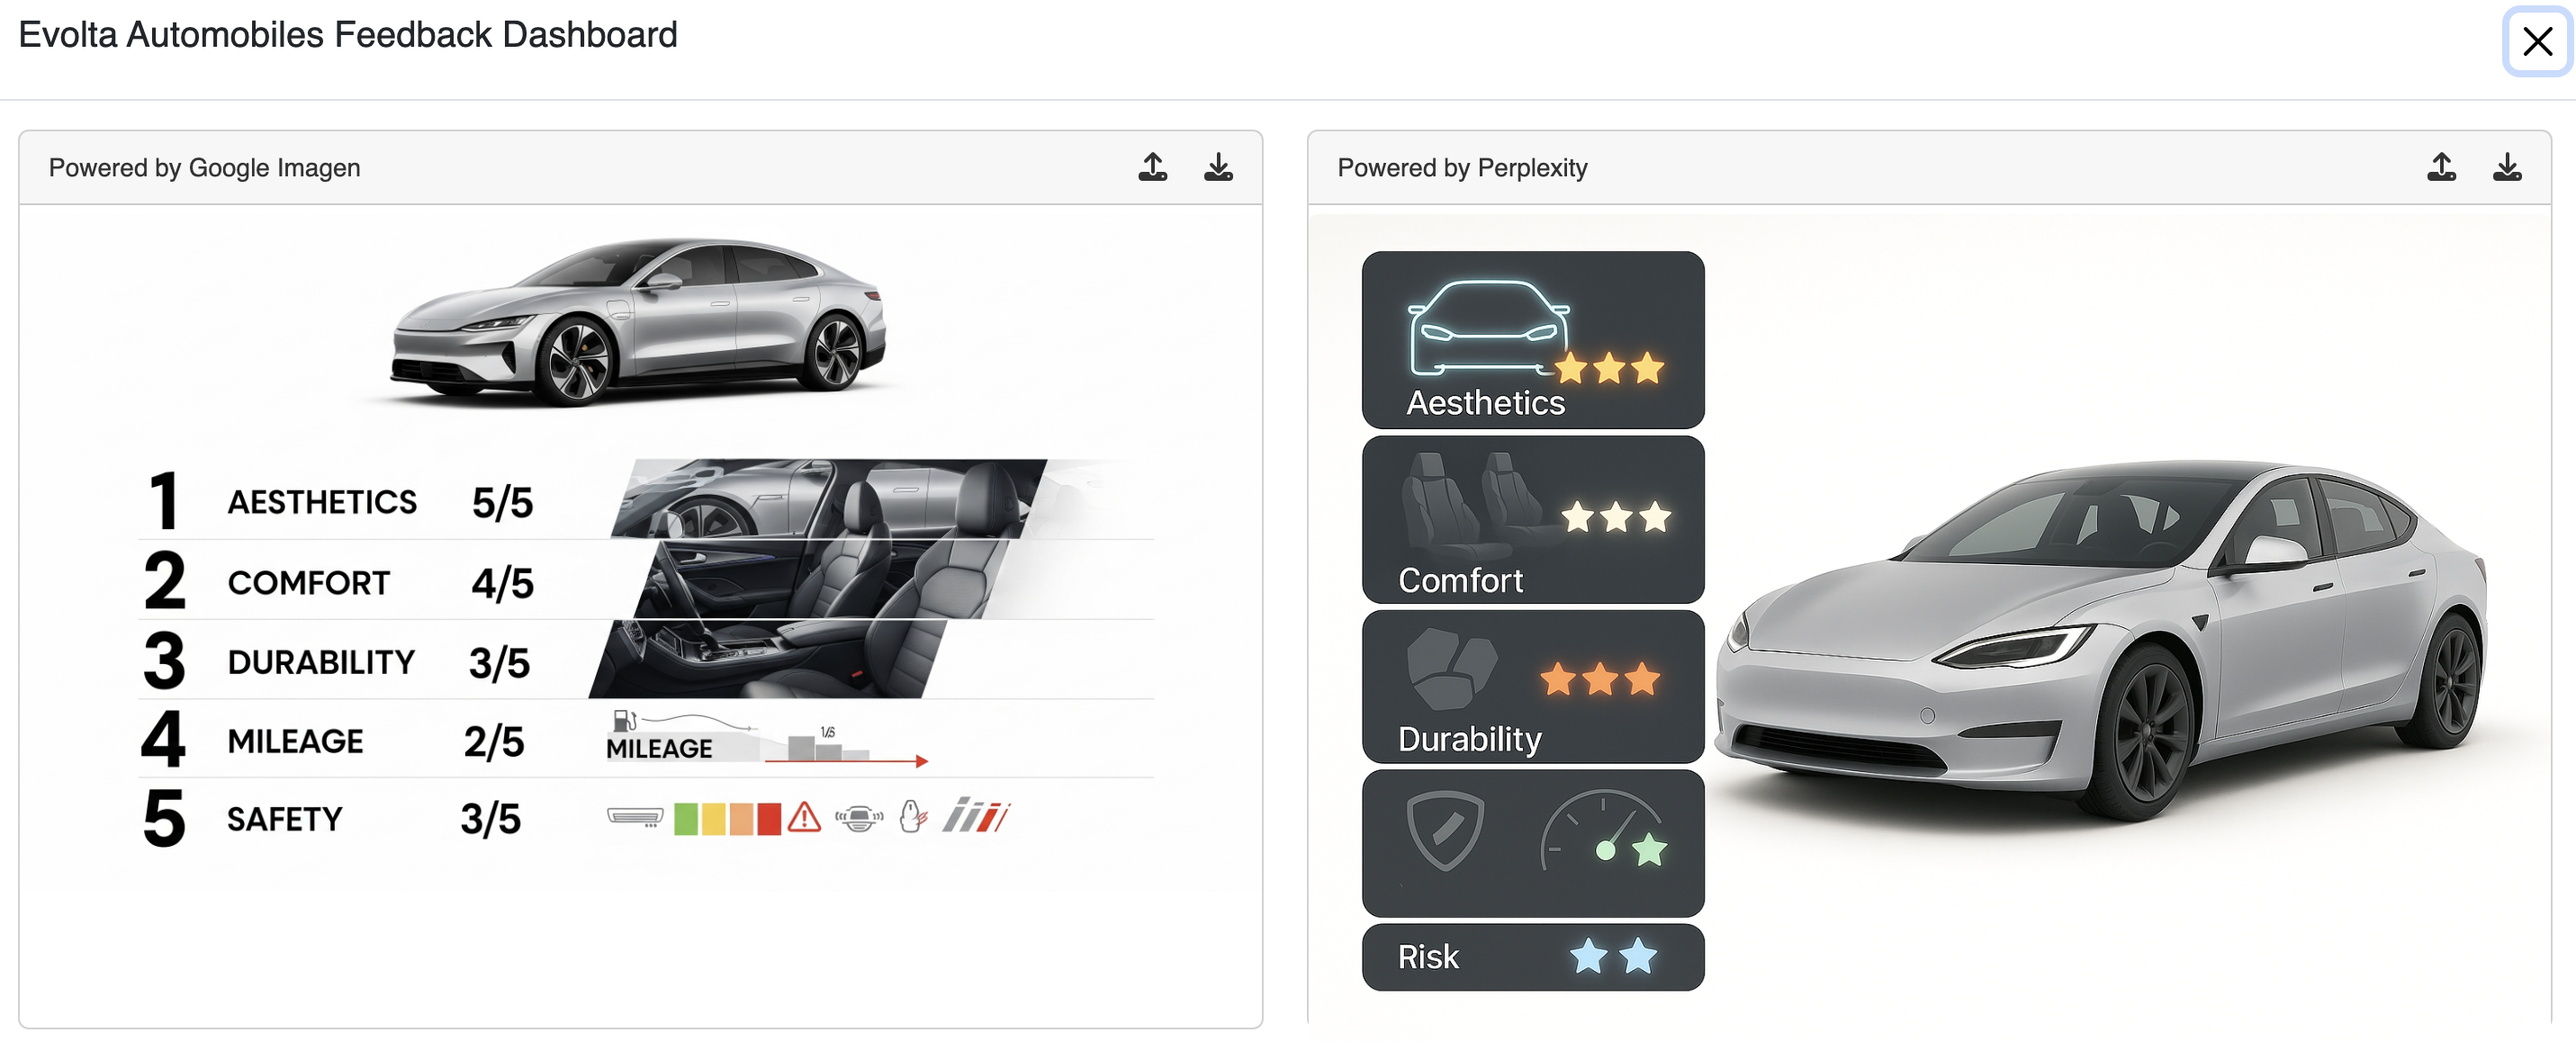
Actionable Insight Dashboards: The platform culminates in a comprehensive dashboard. This dashboard clearly presents churn predictions from our ML models, current churn rates, and various statistical insights. Crucially, after model training and prediction, we identify the top 5 fields significantly affecting churn and generate a compelling visual representation of these factors using the Amazon Bedrock Nova Canvas Library.
- Why Image Generation for Key Factors is Effective: Visualizing the top influencing factors through an automatically generated image (e.g., a dynamic infographic, a styled chart, or a conceptual illustration) significantly enhances comprehension and impact.
- Instant Clarity: Complex statistical relationships are made immediately understandable, even for non-technical users.
- Enhanced Retention: Visuals are more memorable than raw numbers or text, helping stakeholders grasp and retain critical insights about "why" churn is happening.
- Actionable Focus: By visually emphasizing the most impactful variables, businesses can quickly identify and prioritize areas for intervention and strategy adjustment.
- Engaging Communication: Dynamic images create a more engaging and persuasive narrative, making data-driven discussions more effective.
- Why Image Generation for Key Factors is Effective: Visualizing the top influencing factors through an automatically generated image (e.g., a dynamic infographic, a styled chart, or a conceptual illustration) significantly enhances comprehension and impact.
By leveraging the advanced capabilities of Amazon Bedrock Nova Lite LLM and robust ML models like Logistic Regression, LivePropensity uncovers deep insights into customer sentiment, satisfaction, and pain points, effectively explaining the "why" behind their behavior, further amplified by insightful visual explanations.
🏗️ How we built it
We have built a simple but effective and performant stack with
- Flask
- Python
- AWS VM for deployment
- Dynamo DB for storage
- Lambda for business logic
- Bedrock for AI
Let me explain our layers in detail:
Feedback and Reviews Ingestion & Scheduling: Custom python Lambda functions manage API integrations with various social media and survey platforms, allowing configurable scheduling and keyword-based data pulls.
Unstructured Data Processing: All data from sources is stored into Dynamo DB.
Data Mapping, Normalization & Scoring Engine: A data pipeline in Python handles the transformation from raw to normalized datasets. We have built an intelligent prompt which infers the feedback text and converts into a number for scoring. The prompts are powered by Amazon Bedrock Nova Lite LLM. For ex: _ Given the [feedback] by the patient, provide the score for sanitation between 1-10 _
Propensity/Churn Analytics with AI: We developed a dedicated ML pipeline to train, evaluate, and fine-tune our Logistic Regression model on the normalized dataset to determine the top features affecting the Churn.
Image Generation for Insights: Post-ML prediction, we identify the top 5 influencing features and leveraging Amazon Bedrock Nova Canvas Library via its API, we are generating an AI image to showcase the top Churn Factors.
⚠️ Challenges we ran into
Developing Automotive Optics presented several exciting challenges:
Generating One Shot and Comprehensive Visualizations with Nova Canvas: Translating model insights (top 5 factors) into effective prompts for the Amazon Bedrock Nova Canvas Library to generate informative and aesthetically pleasing images posed a unique creative and technical challenge. Ensuring the generated images truly convey the "why" in an accessible format.
Diverse Channel Integration & Scheduling: Building robust, reliable connectors to various external platforms (Twitter, Facebook, Google Forms etc.) with flexible scheduling and keyword filtering proved complex due to API rate limits, data format variations, and authentication flows.
Finding top 5 features affecting Churn:
Integrating Amazon Bedrock Nova Lite LLM at Scale for Scoring: Ensuring efficient and performant communication with the Amazon Bedrock Nova Lite LLM for real-time text-to-score generation within the Flask environment for the "Prompt" mapping method, while maintaining accuracy, required careful optimization.
Building Robust & Accurate ML Models: While Logistic Regression offers good interpretability, selecting and fine-tuning it to perform consistently and accurately across diverse domains, especially when leveraging features derived from highly unstructured data processed by an LLM, presented specific challenges in feature engineering and model validation.
✨ Accomplishments that we're proud of
We are immensely proud of several key accomplishments:
Innovative Visual Explanations with Amazon Bedrock Nova Canvas: Successfully integrated and leveraged the Amazon Bedrock Nova Canvas Library to automatically generate informative and impactful images highlighting the top factors influencing churn, significantly enhancing insight comprehension.
Robust Multi-Channel Data Ingestion: Successfully implemented a flexible system allowing businesses to connect and schedule data collection from diverse sources like Google Forms, Twitter, YouTube, and Facebook using configurable keywords.
Accurate & Adaptable ML-Powered Churn Prediction: Successfully built and deployed a Logistic Regression model that leverages our normalized, LLM-enriched data to provide highly accurate and adaptable churn predictions across various domains.
True Domain Agnosticism: Building a flexible data ingestion, processing, and analysis pipeline that genuinely adapts across diverse domains like Medical, Transport, and Education.
Scalable AWS Deployment: Deploying the entire solution on an AWS EC2 instance demonstrates our ability to build and deploy robust and scalable applications within a controlled environment.
📚 What we learned
This project provided invaluable learning experiences:
Leveraging Generative AI for Explanations: We discovered the immense potential of image generation models like Amazon Bedrock Nova Canvas Library to transform complex model outputs into intuitive, visually engaging explanations, making AI insights accessible to a broader audience.
The Power of Configurable Ingestion: We learned the critical importance of giving users control over data sources, schedules, and keywords for truly flexible and relevant data collection.
Managing Data Lifecycle in AWS DynamoDB: The nuances of storing, previewing, and transforming both raw and processed data efficiently within DynamoDB for a complex, high-performance application.
AWS Ecosystem for End-to-End Solutions: We solidified our expertise in leveraging various AWS services for optimal performance, scalability, and developer experience, from ingestion to deployment.
🚀 What's next for Automotive Optics
The future of Automotive Optics is exciting! Our next steps include:
Expanding "Prompt" Mapping Capabilities: Enhancing Amazon Bedrock Nova Lite LLM's role in data mapping to include more complex entity extraction, relationship identification, and multi-modal scoring (e.g., combining text and image analysis for a single score).
Predictive Action Recommendations: Developing a recommendation engine that suggests specific, automated actions or interventions based on predicted churn or propensity scores, linked directly to the channels used for feedback.
Advanced Explainability & Interactive Visuals: Further enhancing the explainability of our ML models (including Logistic Regression's coefficients and feature importance) and dashboard insights. This includes making the Nova Canvas-generated images more interactive and allowing users to drill down into the underlying data influencing those factors.
Real-time Stream Processing: Investigating the adoption of real-time data streaming (e.g., via AWS Kinesis or Kafka) for near-instantaneous feedback processing and churn updates.
Built With
- amazon-dynamodb
- amcharts
- bedrock
- flask
- nova-canvas
- nova-lite
- python

Log in or sign up for Devpost to join the conversation.