-
-
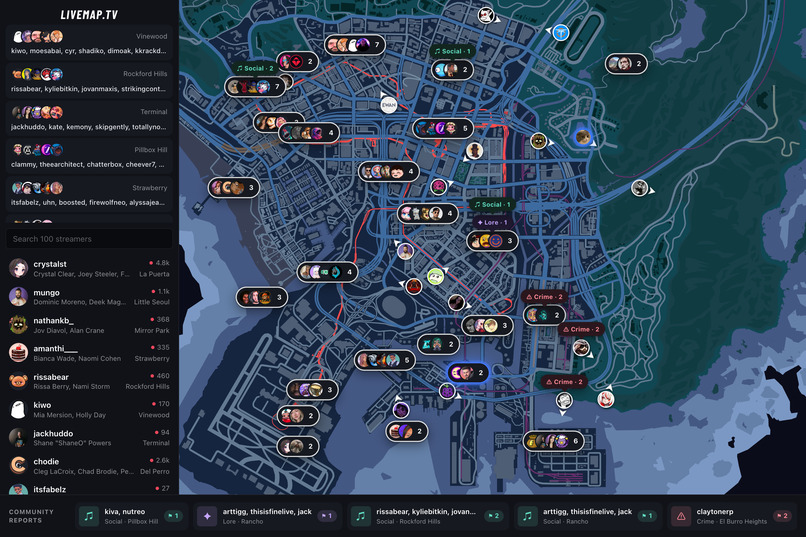
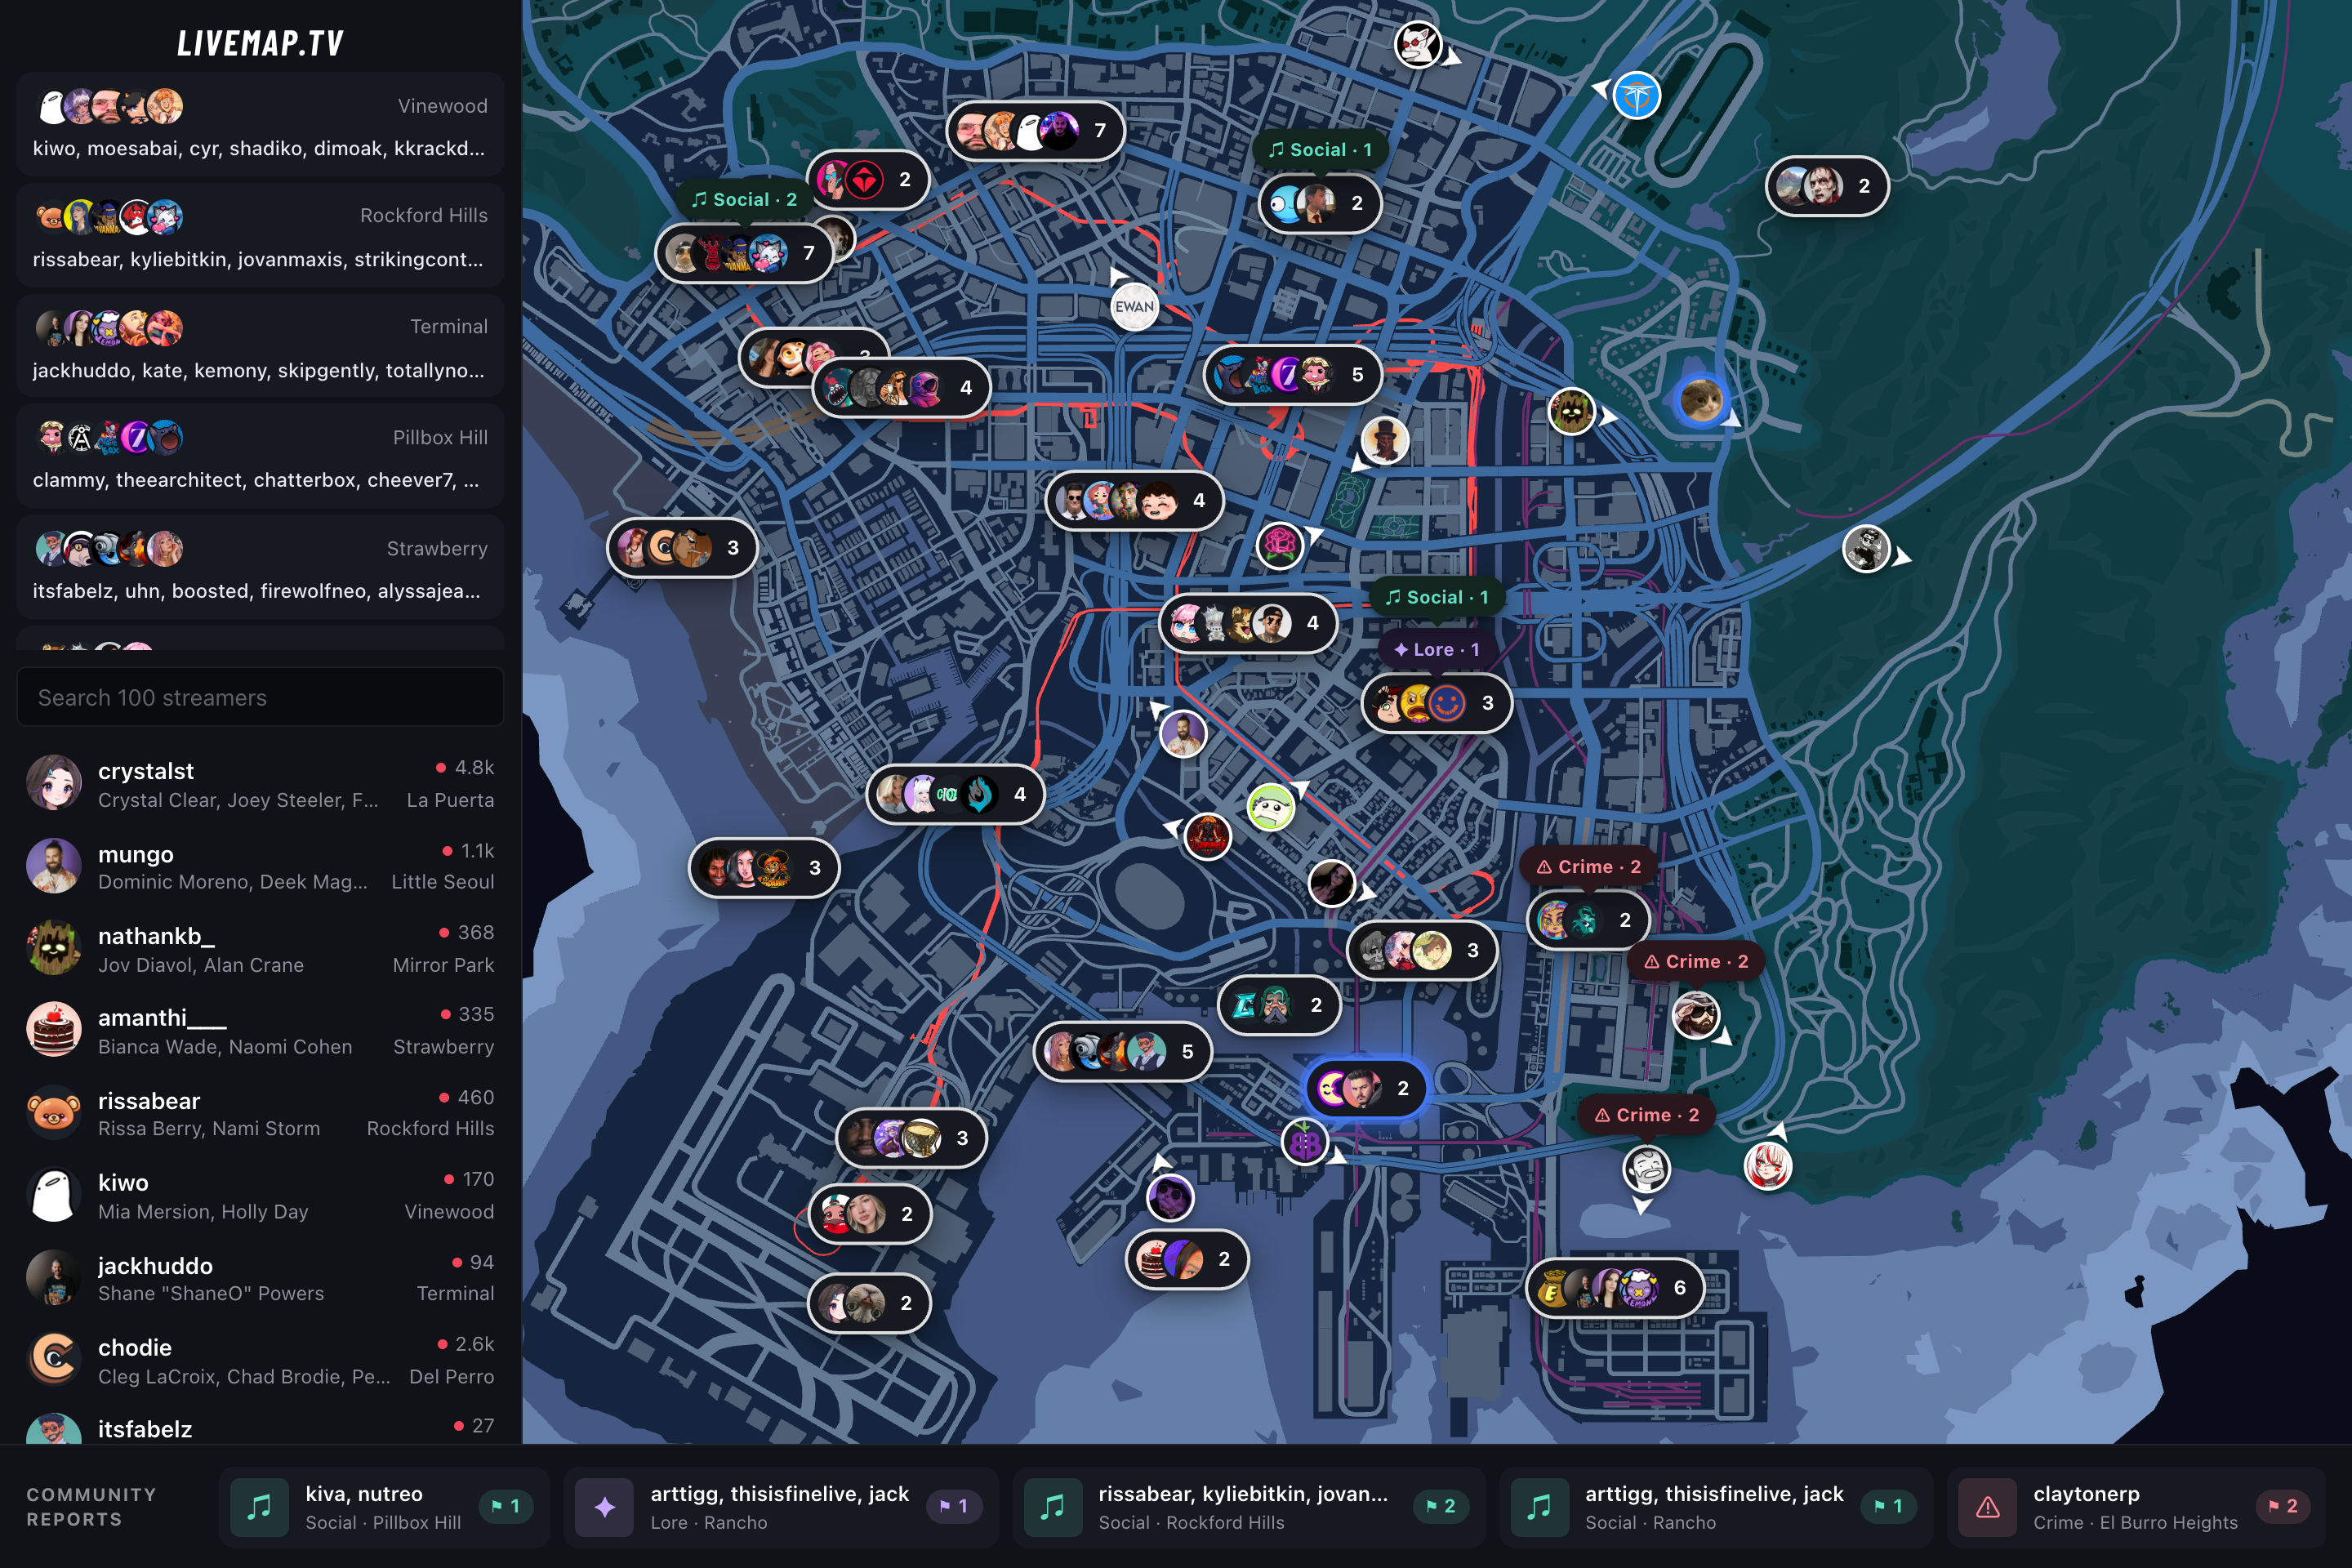
Interactive live map, community-driven reports
-
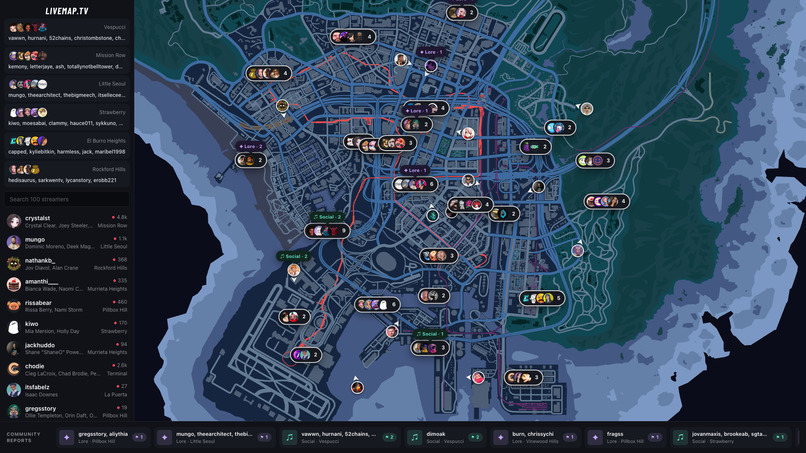
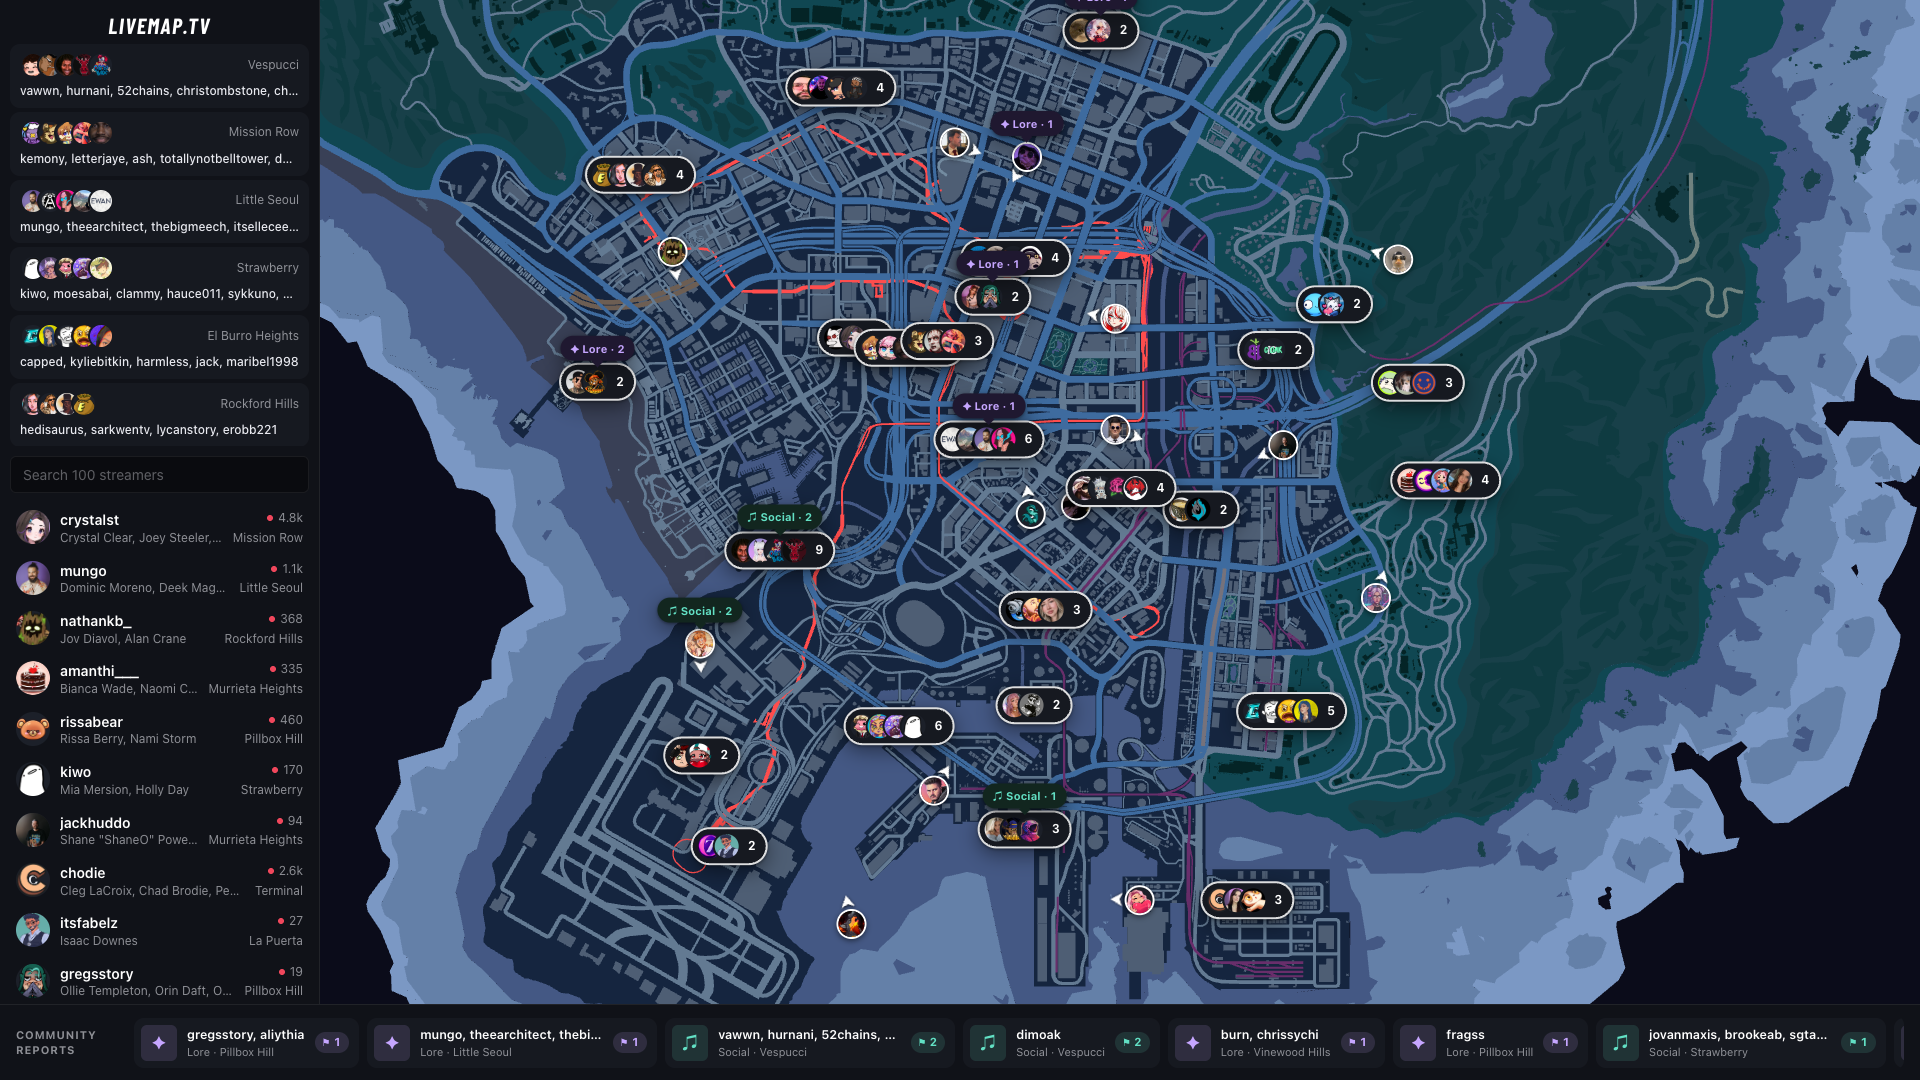
Interactive live map, desktop
-
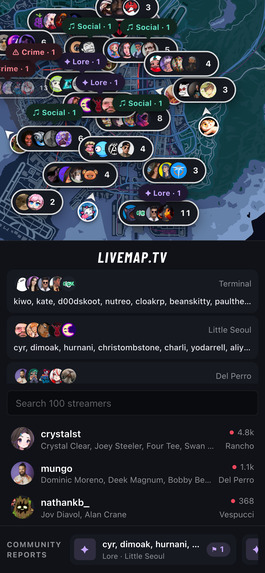
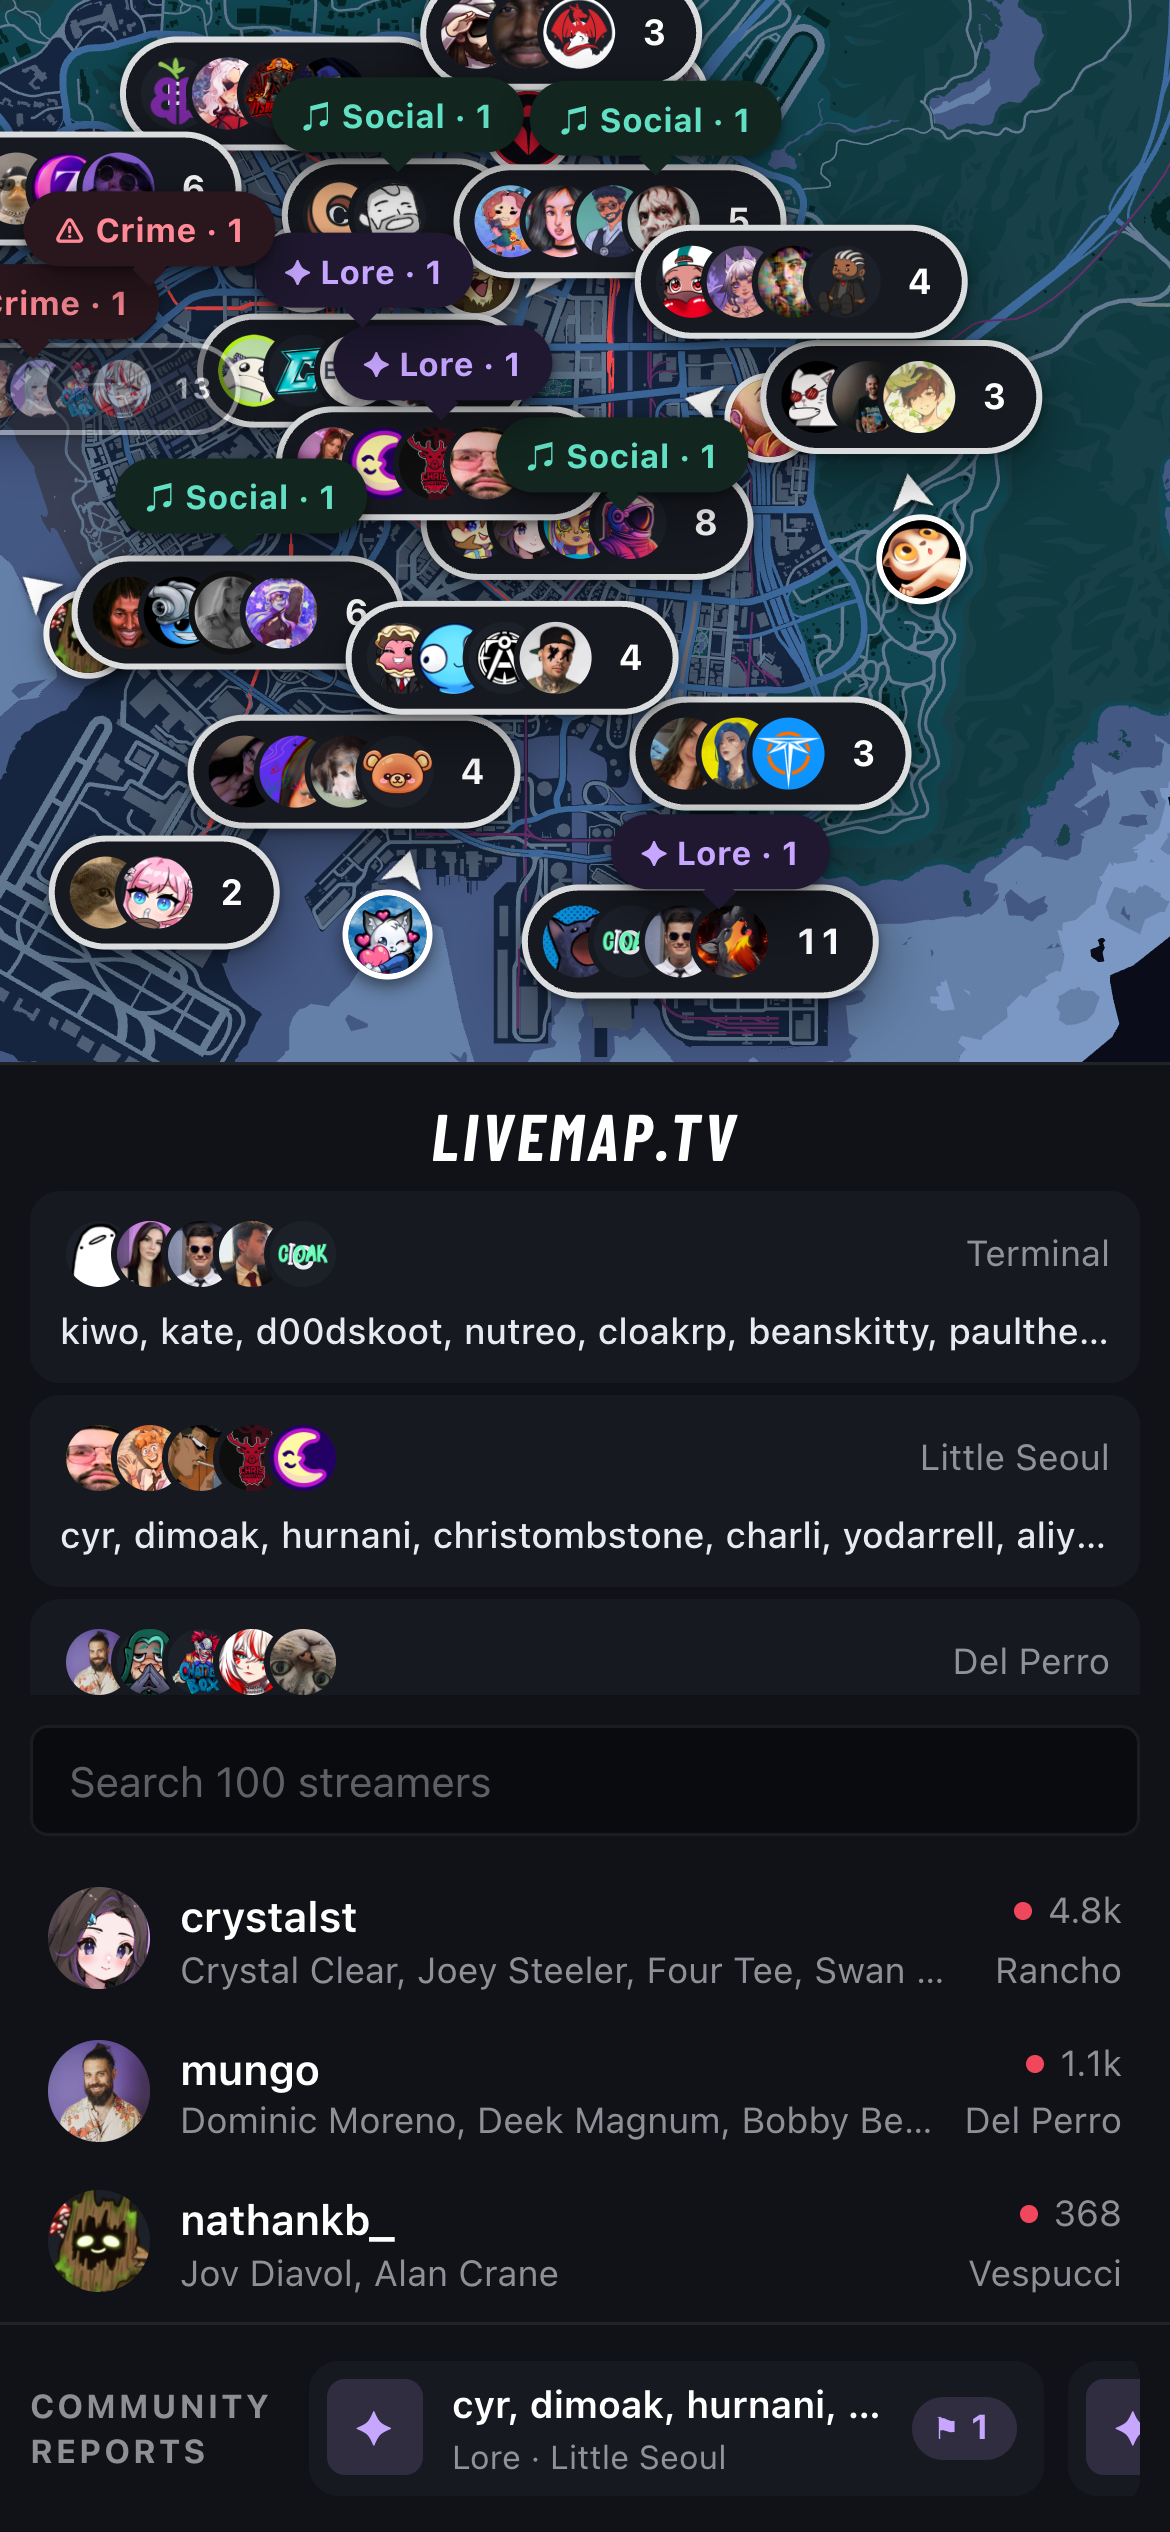
Interactive live map, mobile
-
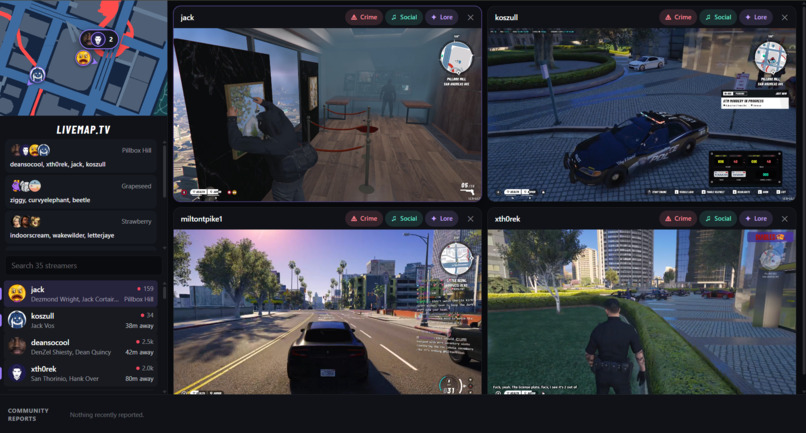
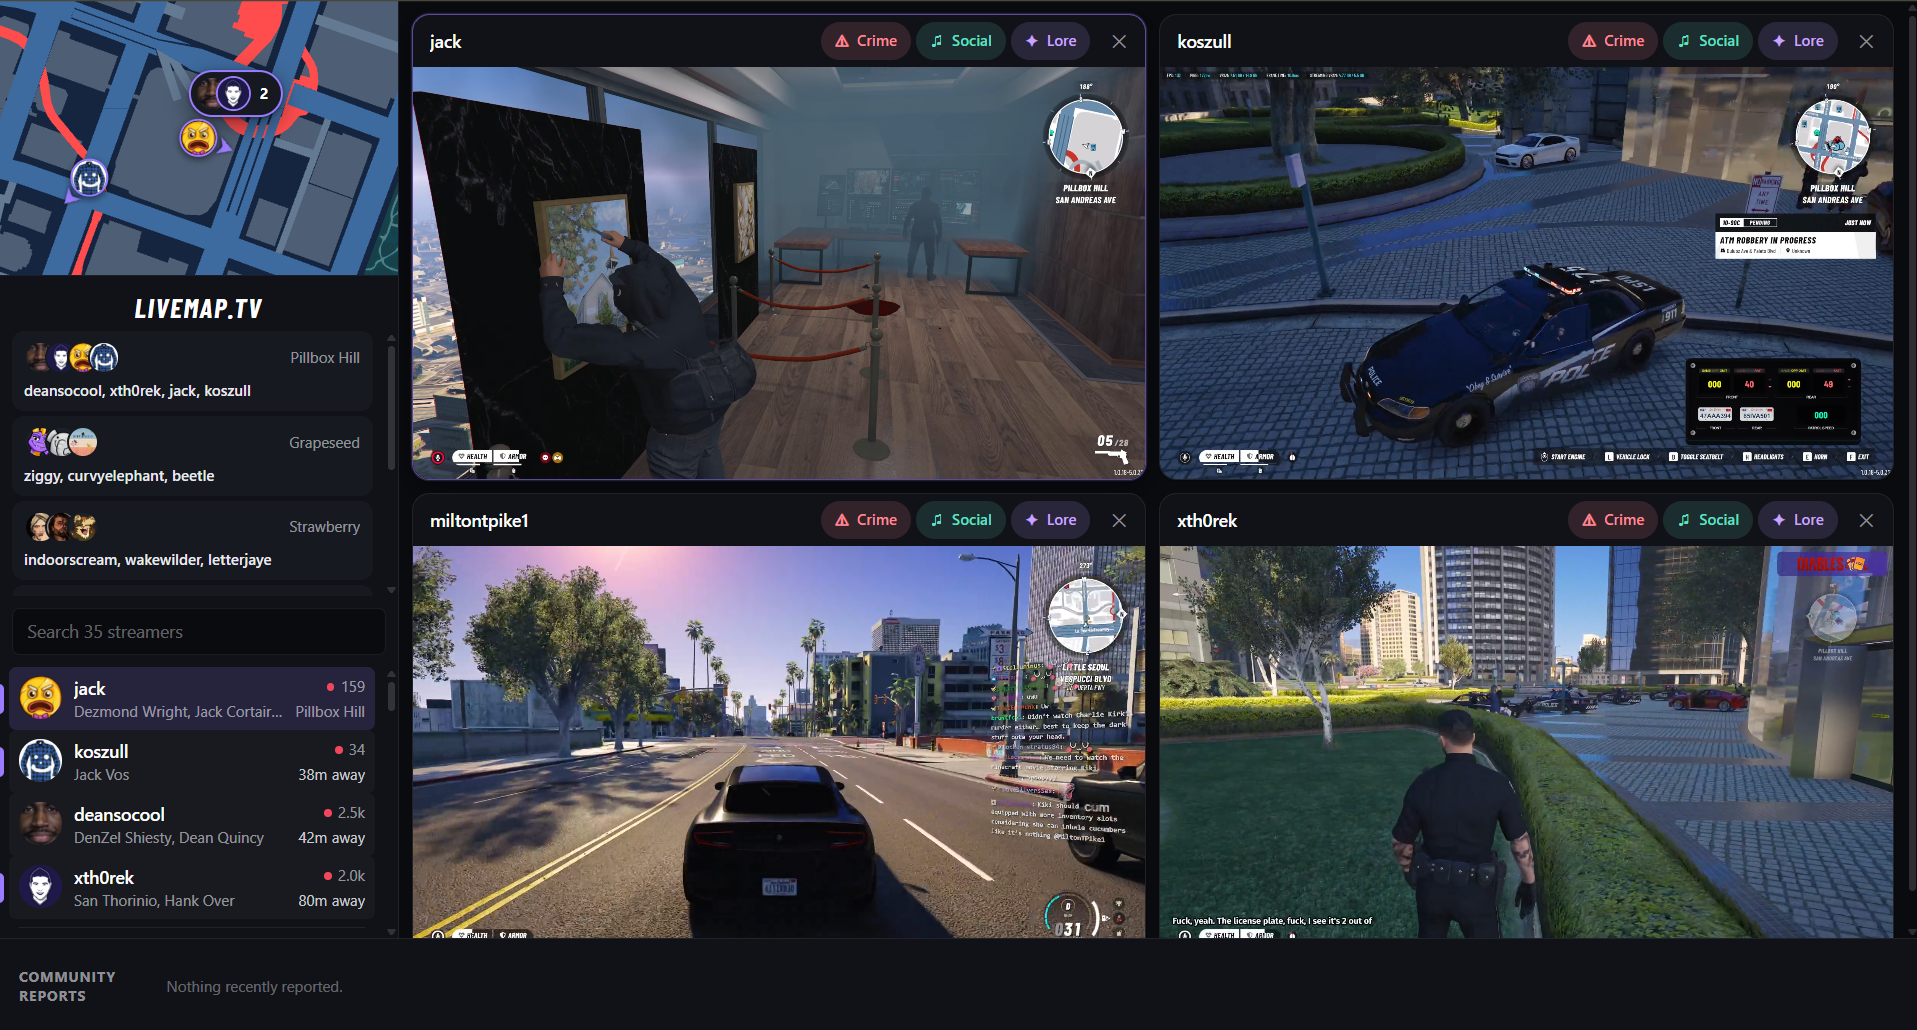
Stream viewer, multiple streams
-
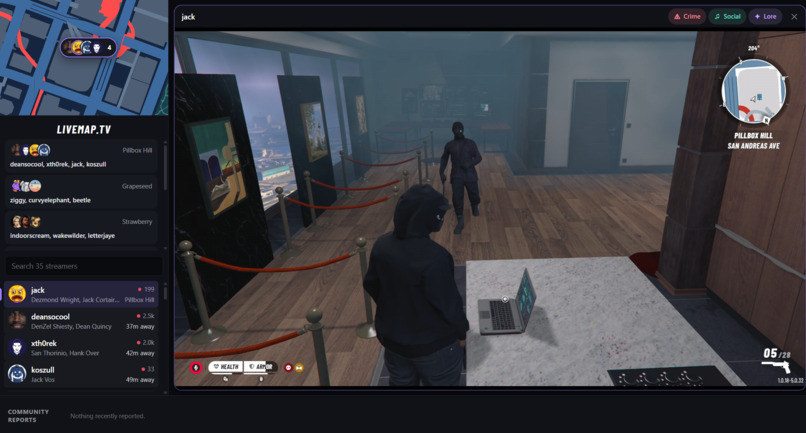
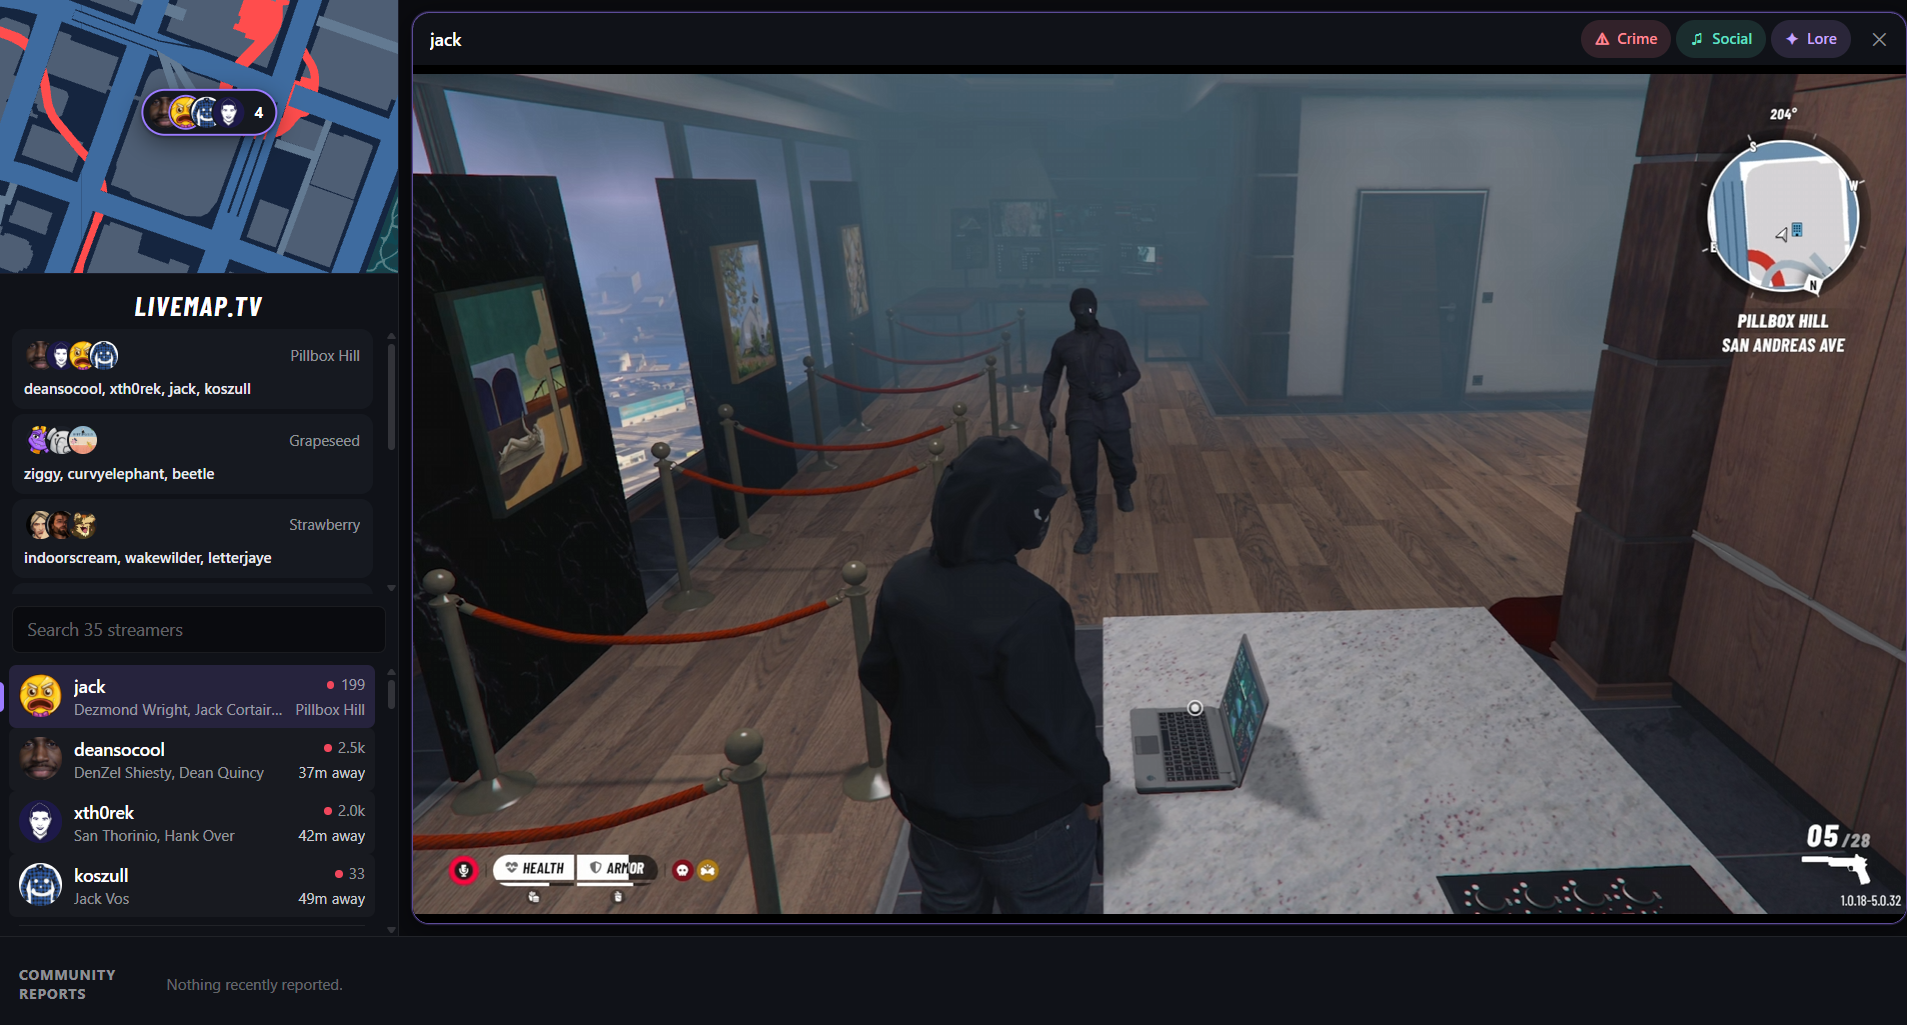
Stream viewer, one stream
Inspiration
Some of the best moments in roleplay happen when several streamers are in the same place at once: a chase, a heist, or important lore. But viewers only see one point of view at a time, and by the time a clip goes around, the moment is over.
We wanted a way to see the whole city at once: who is live, where they are, and where the action is happening right now.
What it does
LIVEMAP.TV puts every live streamer on an interactive city map, updated in real time.
- Find streamers: pan and zoom the map, or search the sidebar. Streamers who are close together are grouped so you can see who's with whom.
- Watch: click any avatar to open their stream. On desktop you can watch several at once.
- Report what's happening: while watching, flag a moment as ⚠ Crime, ♫ Social or ✦ Lore. The report is pinned to everyone nearby and appears on the map and in a live Reports bar.
How we built it
Frontend: TypeScript and Vite, with performance-optimized SVG map rendering, panning, zooming, animated avatars, and a follow-the-streamer camera. Streamer positions arrive over a Server-Sent Events feed, Twitch's own iframes play the video, and the static build is deployed on Cloudflare.
Community events service: a small Node.js server that accepts reports over HTTP or WebSocket. Each (category, streamer) pair is one live event. New clients get a snapshot first, then live updates and expiries. State is in memory only, which keeps the service tiny and fast.
From game coordinates to meters. The feed gives positions in the game's grid coordinates, which we map onto the SVG map:
$$ x_{\text{svg}} = \frac{p_x - x_0}{s_x} $$
$$ y_{\text{svg}} = \frac{p_y - y_0}{s_y} $$
Calibrating this against the map image gave us a real-world scale, so we can measure the distance between streamers in meters:
$$ d(a,b) = u\sqrt{(\Delta x)^2+(\Delta y)^2} $$
Here, \(u\) is the number of meters per SVG unit, and \(\Delta x\) and \(\Delta y\) are the differences between the streamers' SVG coordinates.
Two kinds of "together":
Neighborhoods: Streamers are "together" if \(d(a,b) \le 150\,\text{m}\). This rule chains, so A–B–C is one group even when A and C are farther apart. Reports, the sidebar, and the Reports bar all use these groups.
Screen clusters: Avatars whose circles overlap on screen (centers closer than diameter \(D\)) collapse into one chip with stacked profile pictures.
Both are connected components, which we compute with union–find. For screen clusters, we bucket avatars into a grid of \(D \times D\) cells so each one only checks its 9 neighboring cells. That brings the work down from \(O(n^2)\) to roughly \(O(n)\).
Challenges we ran into
- Avatars piling up. In busy areas, dozens of avatars stacked on top of each other and became impossible to click. Clusters fixed this, but they had to split apart smoothly as people move or the map zooms, and stay fast to recalculate.
- Counting reports honestly. One click reports every streamer nearby, so a single report is copied to \(k\) streamers. Adding those copies would inflate the numbers, so a group shows \(\max_{s \in G} r_s\) instead of \(\sum_{s \in G} r_s\).
- Staying fresh. Reports had to disappear on time, even for clients that went offline. The client reconnects with a fresh snapshot and drops anything that expired while it was disconnected.
- Spam versus friction. We wanted reporting to be one click, so we added a five-second cooldown that persists across streams. Real anti-abuse measures are still to come.
- Custom map interactions. Building pan, zoom, follow and animation without a dedicated map library was more work, but it gave us full control over the experience.
Accomplishments that we're proud of
- A smooth live map with performance-optimized SVG rendering and responsive streamer tracking.
- Reporting in one click that automatically includes everyone in the scene.
- Clusters that merge and split naturally as streamers move and you zoom.
- A small real-time backend that's easy to run, with tests for both the frontend logic and the service.
What we learned
- How to design real-time systems: snapshot first, then incremental updates over SSE and WebSockets.
- Small product details, like how counts are calculated, decide whether people trust the data.
- Deployments on VPSs and Cloudflare!
What's next for livemap.tv
- Account-based reporting with deduplication and rate limiting
- Saved event history and highlight replays
- Notifications when a big moment starts near your favorite streamer
Built With
- cloudflare
- javascript
- json
- node-test-runner
- node.js
- openai-codex
- rest-api
- server-sent-events
- spatial-hashing
- svg
- twitch
- twitch-embed
- typescript
- union-find
- vite
- websockets
- wrangler
- ws


