Inspiration
We were inspired by the high-stakes environment of Formula 1 "Mission Control" centers and the sleek, data-dense interfaces seen in sci-fi media like The Expanse and SpaceX launches. We wanted to bring that level of sophisticated, real-time decision support to the GR Cup, turning overwhelming data streams into clear, winning strategies.
What it does
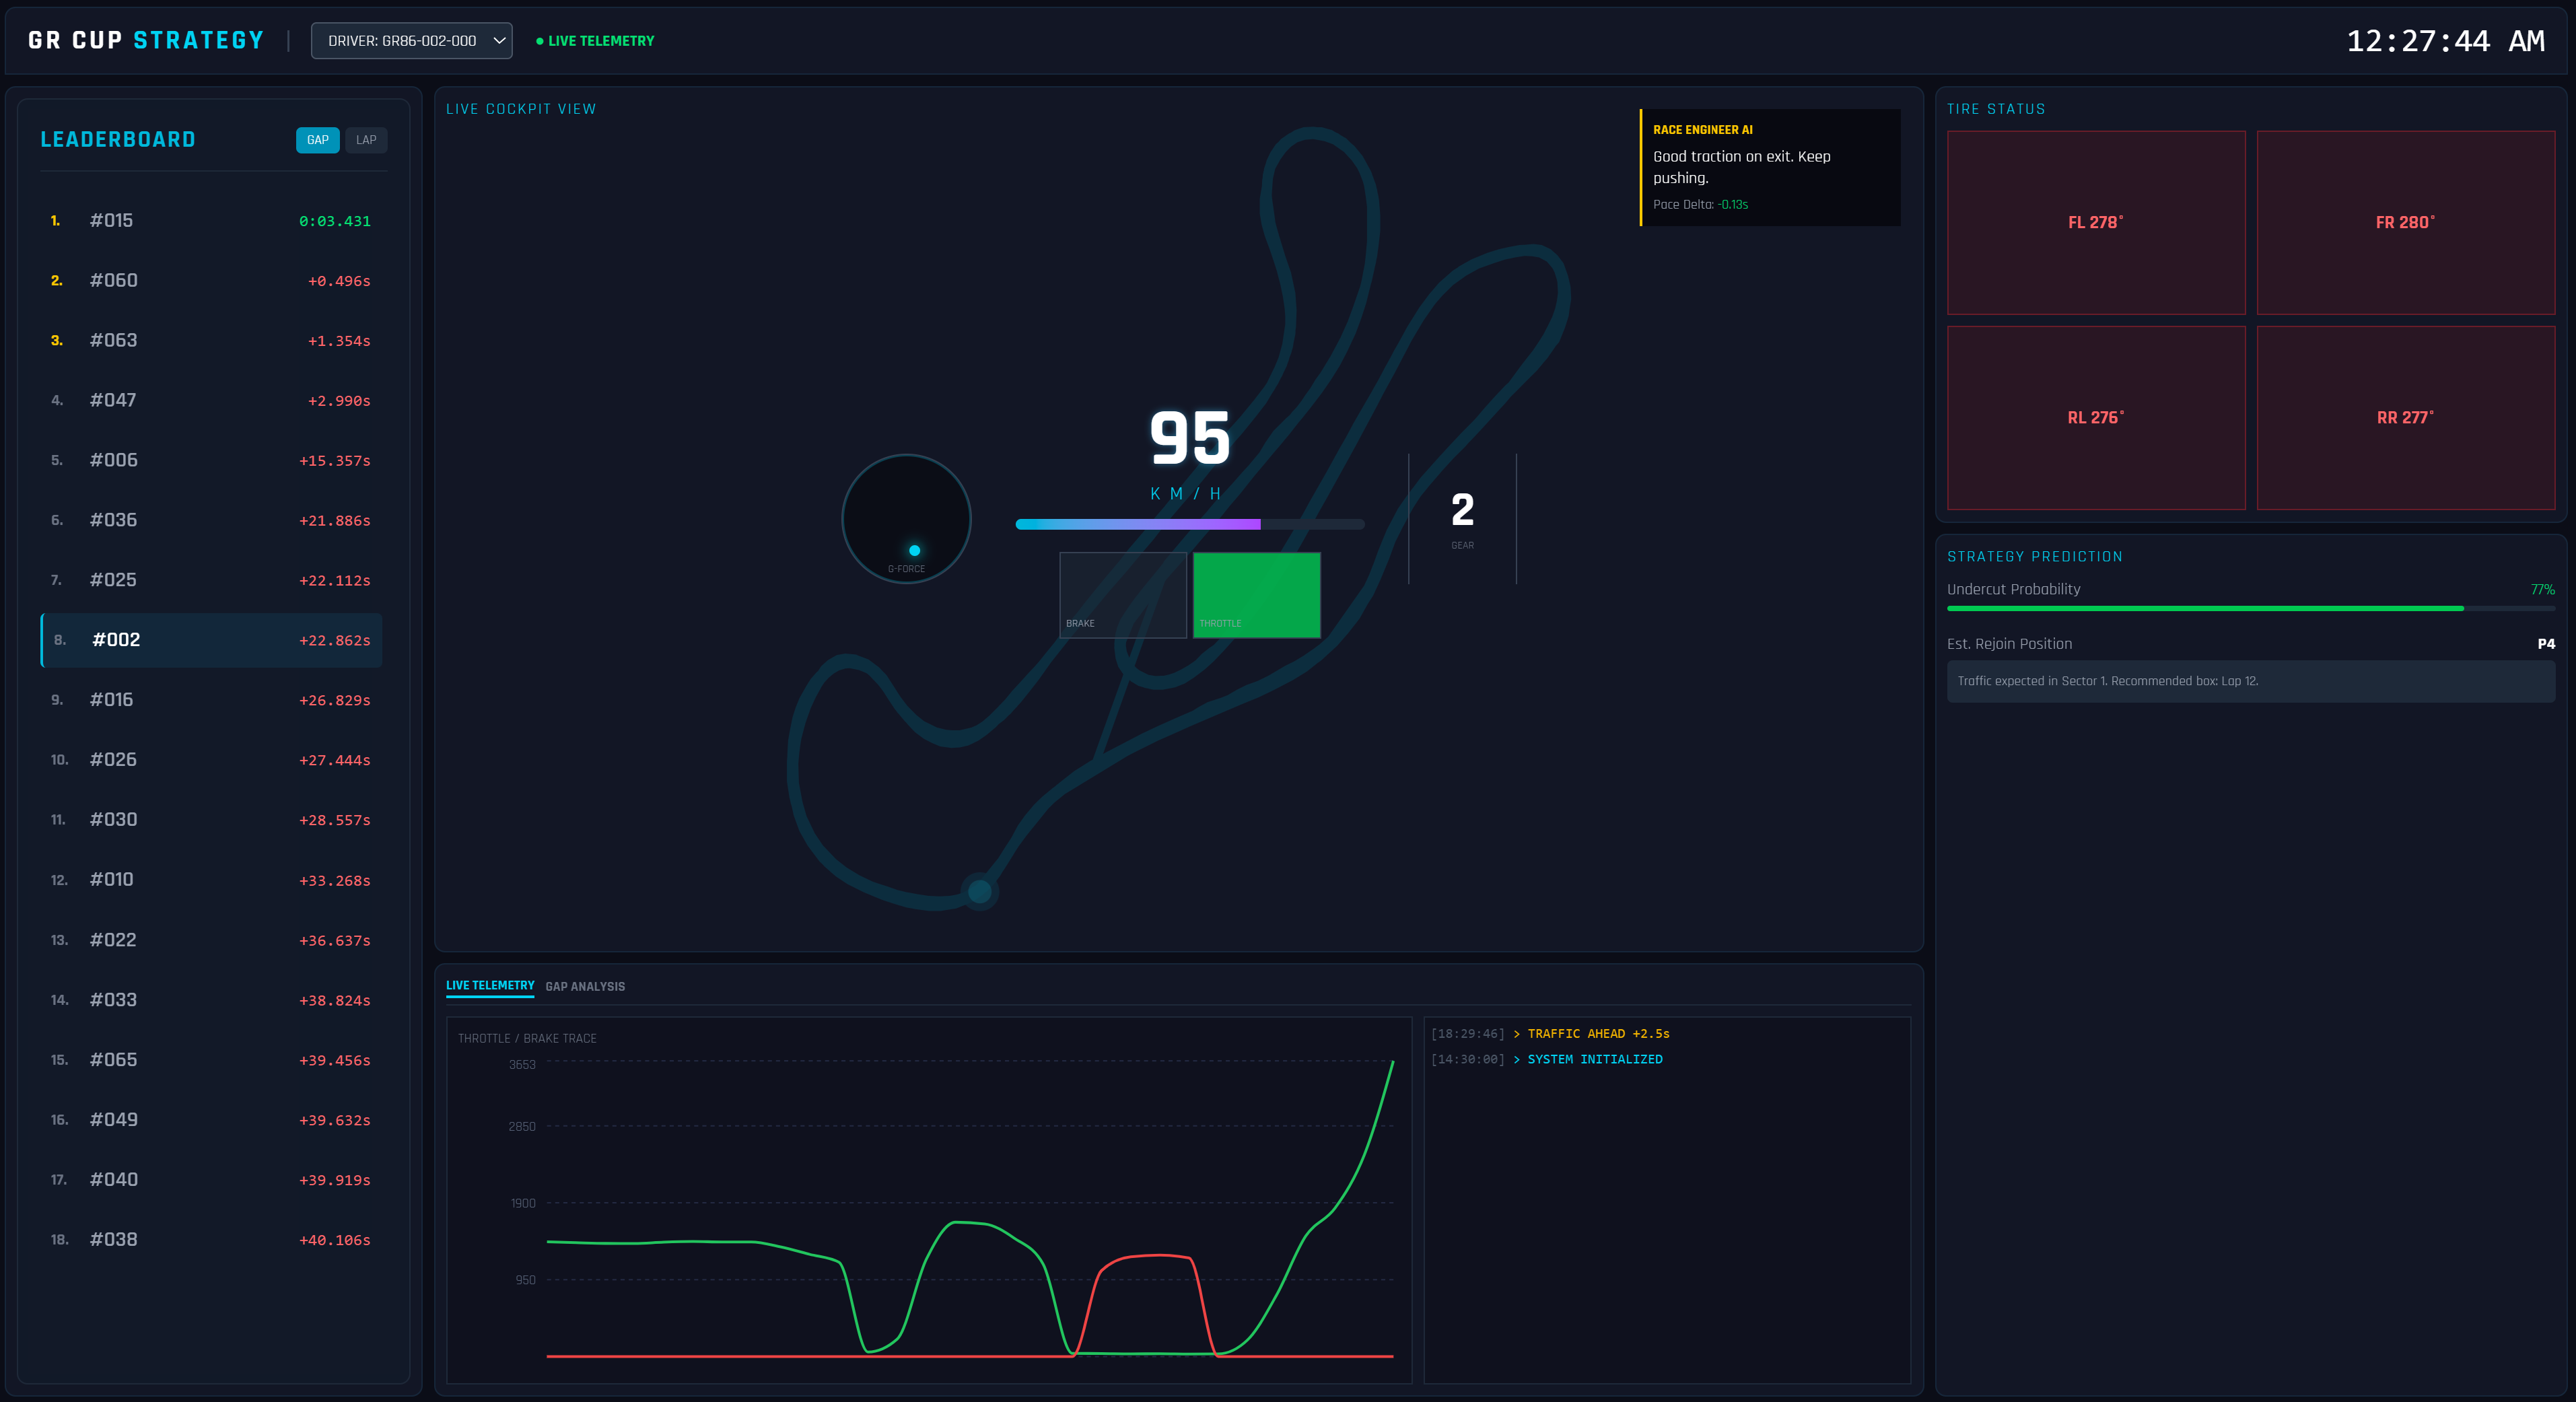
The GR Cup Strategy Dashboard is a comprehensive command center for race engineers. It:
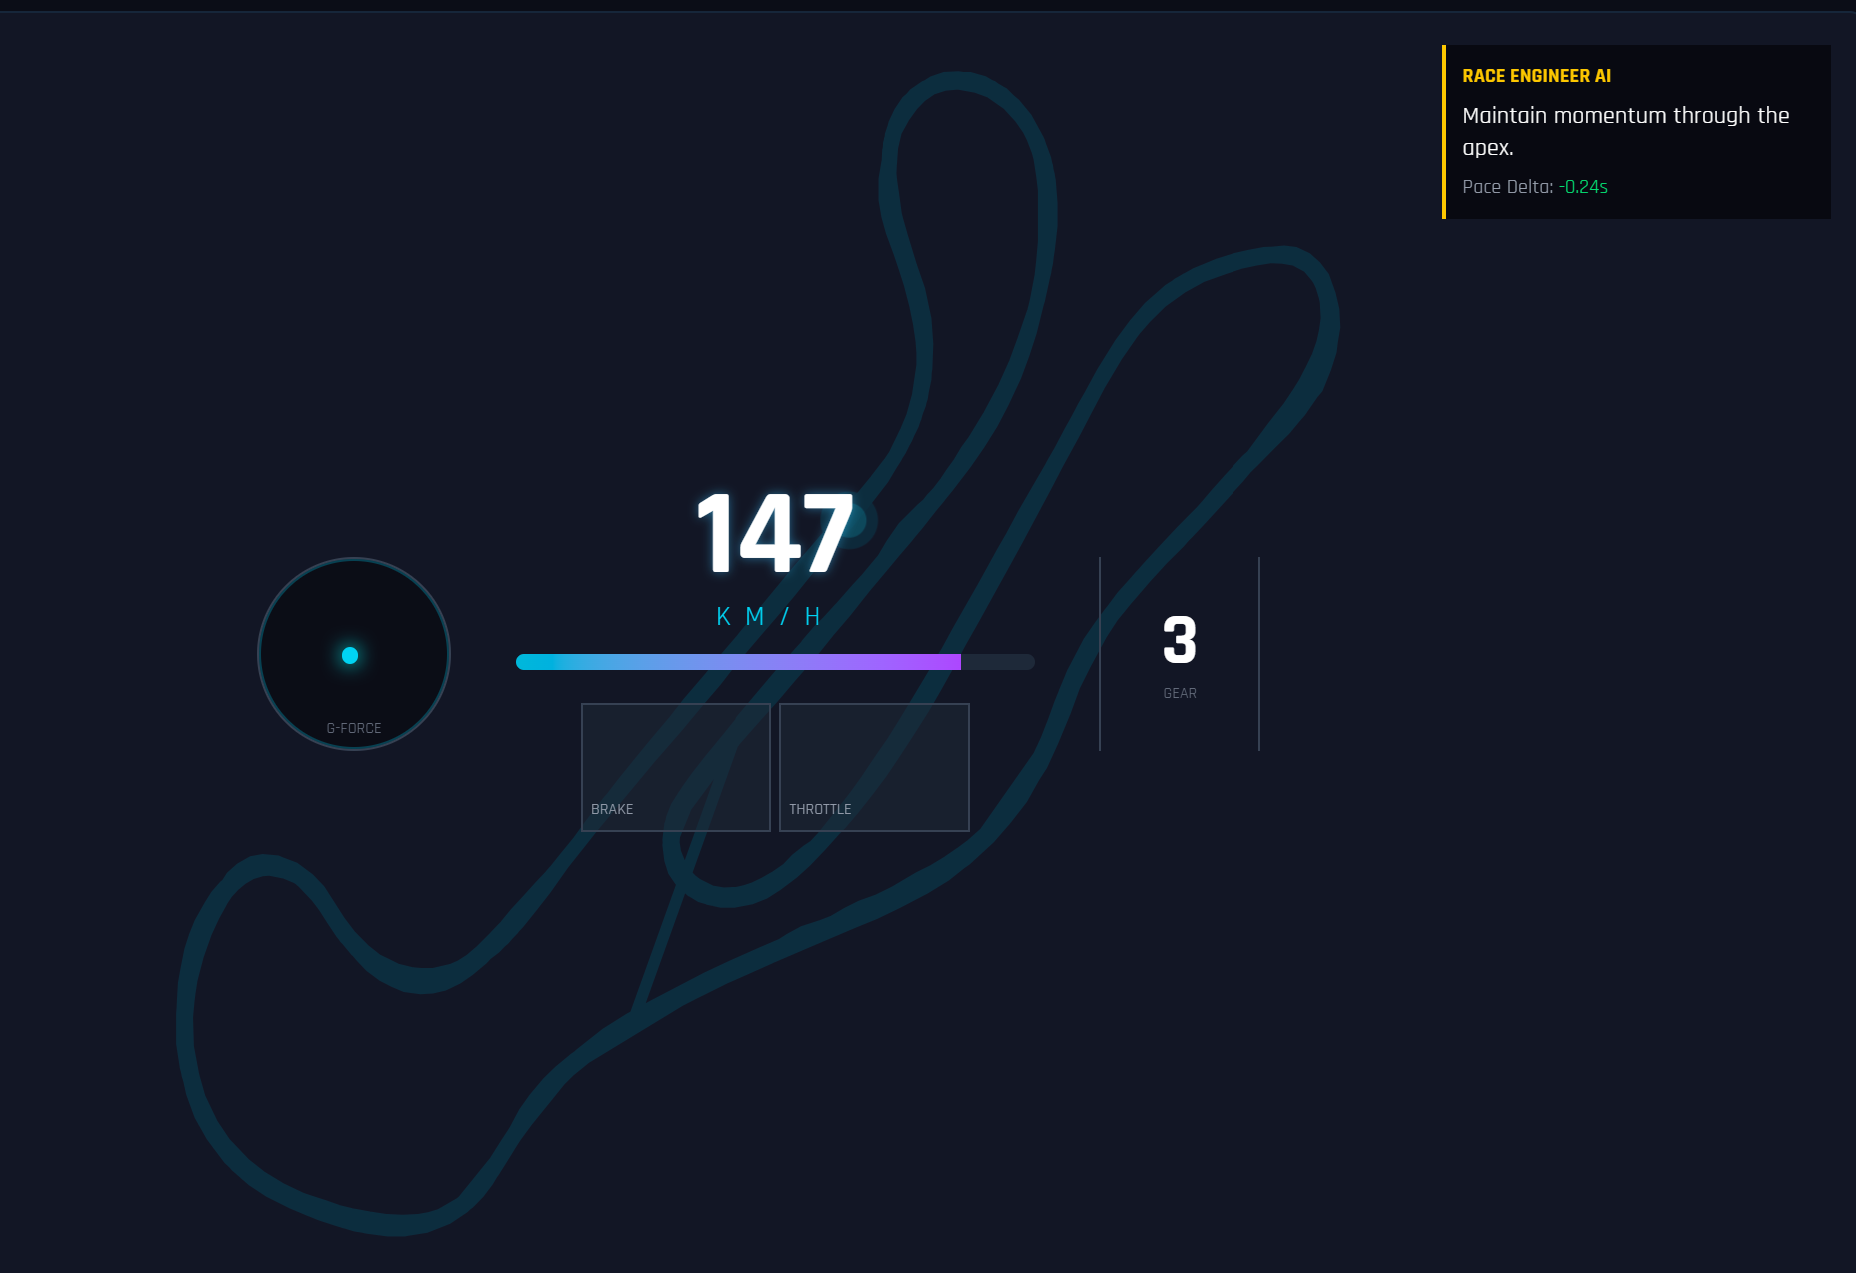
- Visualizes Live Telemetry: Displays real-time speed, G-force, throttle/brake traces, and car position on a dynamic track map.
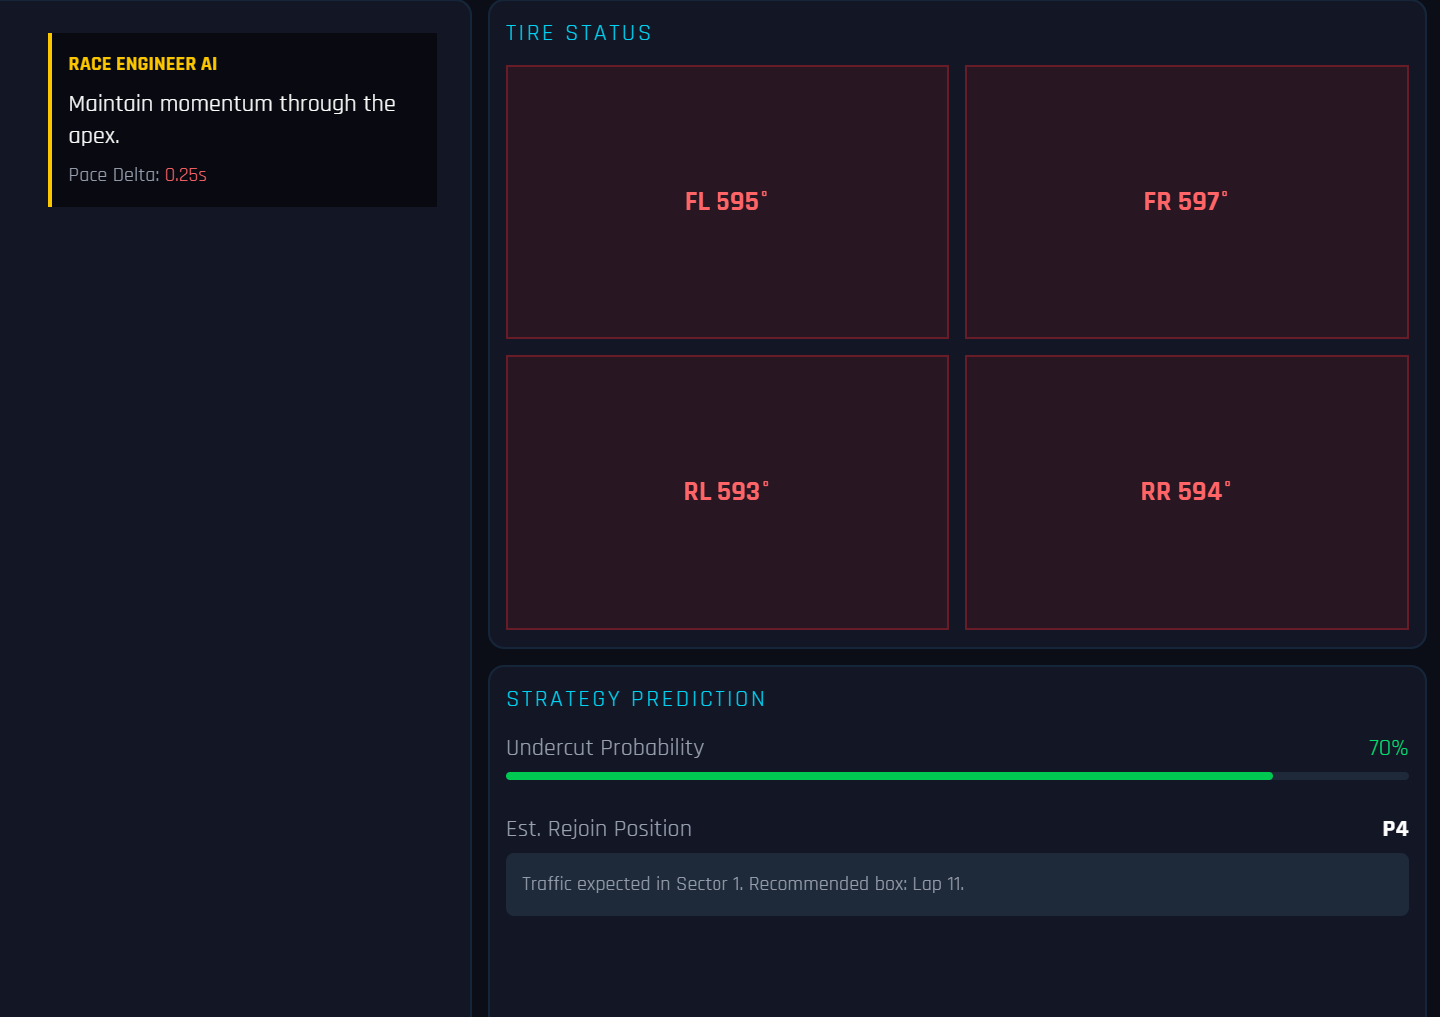
- Provides AI Coaching: The "Race Engineer AI" analyzes cornering performance and tire health to give instant driver feedback (e.g., "Focus on exit speed").
- Predicts Strategy: Calculates "Undercut Probability" and monitors gaps to competitors to recommend the perfect pit window.
- Tracks Competitors: A live leaderboard with gap analysis trends helps teams spot when they are catching the car ahead.
How we built it
We built the system using a high-performance modern stack:
- Frontend: React with Vite for blazing fast rendering. We used Tailwind CSS for the custom "SpaceX" aesthetic and Recharts for the dynamic data visualization.
- Backend: FastAPI (Python) serves as the high-speed data engine. We used Pandas and NumPy to process the CSV telemetry data, calculate derived metrics (like tire stress and gap deltas), and simulate a live WebSocket stream.
- Data Processing: We implemented custom algorithms to downsample high-frequency data for the web while maintaining signal fidelity.
Challenges we ran into
- Data Synchronization: Syncing the high-frequency telemetry (50Hz+) with the frontend animation loop was tricky. We had to implement a "jitter" buffer and timestamp interpolation to ensure smooth playback without freezing.
- Performance: Rendering complex SVG maps and multiple real-time charts caused initial lag. We solved this by memoizing heavy components and optimizing the WebSocket payload size.
- UI Clutter: Displaying "millions of data points" without overwhelming the user required several design iterations. We adopted a "Mission Control" grid layout to keep critical info front-and-center.
Accomplishments that we're proud of
- The "Race Engineer AI": It feels alive! Seeing the system correctly identify a "Braking Zone" and offer relevant advice in real-time is incredibly satisfying.
- Smooth Visualization: Achieving a steady 60 FPS update rate on the frontend even with multiple moving charts and maps.
- Robust Architecture: The backend handles data gaps and connection drops gracefully, auto-reconnecting without crashing the simulation.
What we learned
- The power of visual hierarchy: In a high-pressure environment, color coding (Green = Good, Red = Bad) and clear typography are more important than raw numbers.
- WebSocket optimization: Sending diffs or downsampled data is crucial for real-time web apps.
- React Performance:
useMemoandReact.memoare essential when dealing with sub-second updates.
What's next for GR Cup Strategy Dashboard
- Real-time Kafka Integration: Moving from CSV simulation to a live Kafka topic consumer for actual race day deployment.
- Predictive Tire Model: Using machine learning to predict tire degradation curves based on track temperature and driving style.
- Multi-Car Support: Expanding the dashboard to monitor an entire team of 3-4 cars simultaneously.


Log in or sign up for Devpost to join the conversation.