-
-
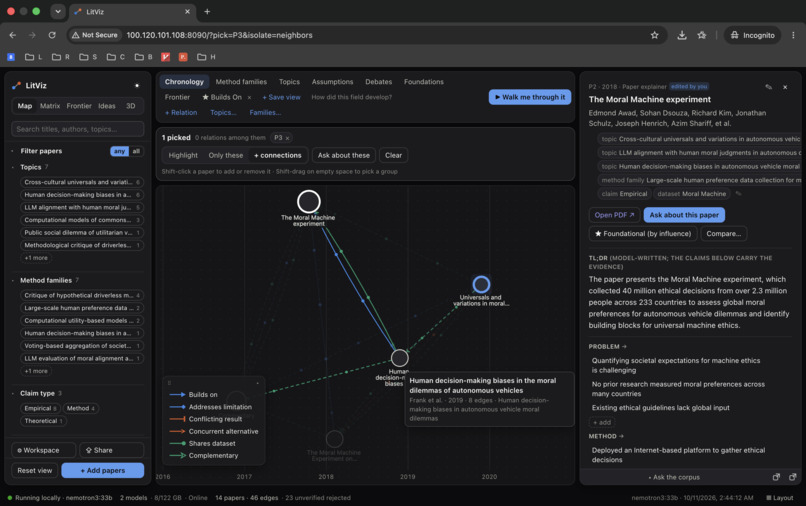
Isolated view
-
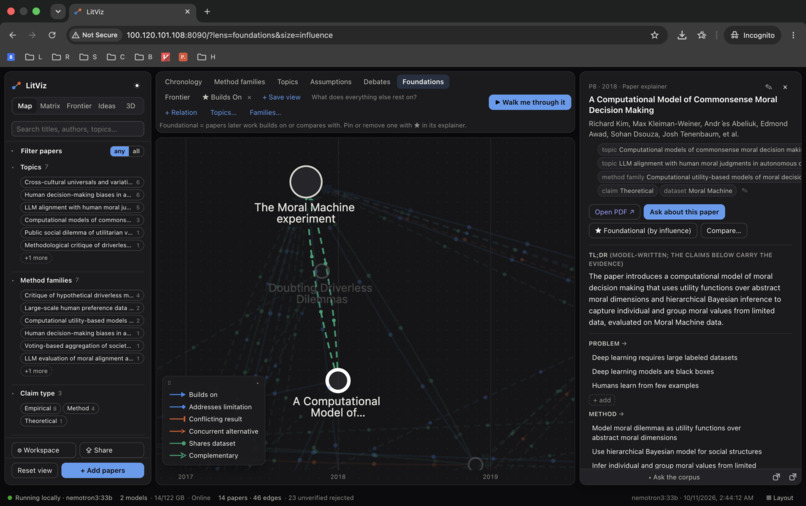
Foundations view
-
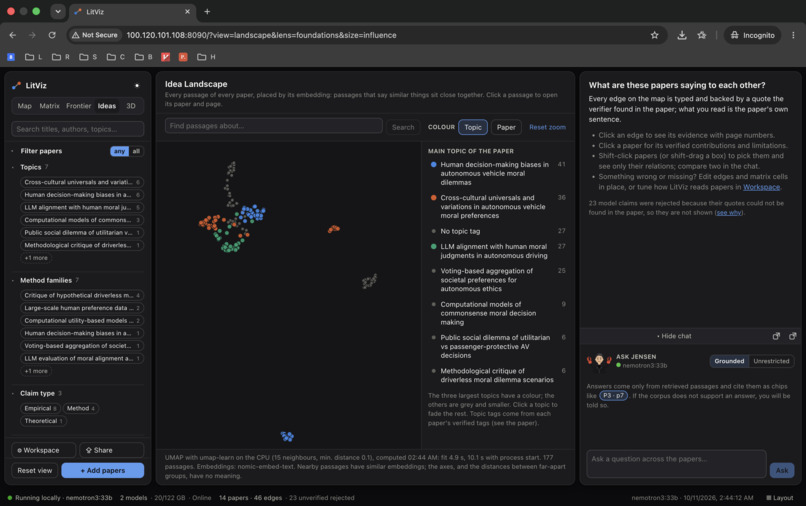
Embeddings view
-
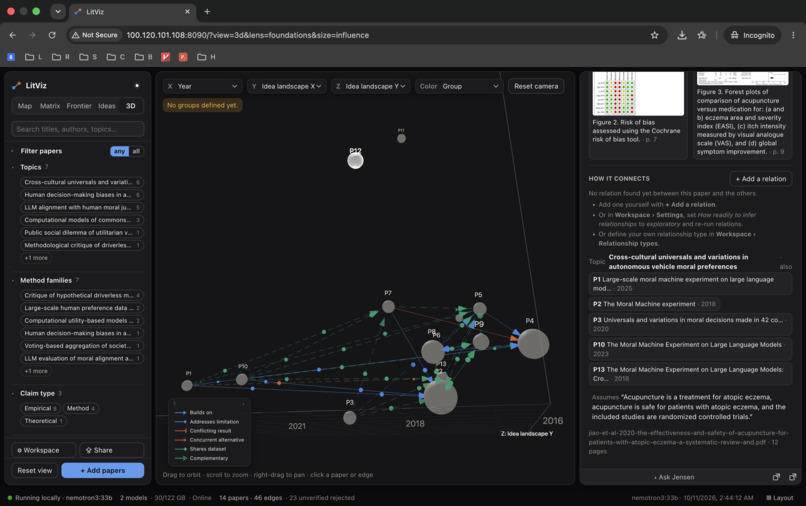
3d view
-
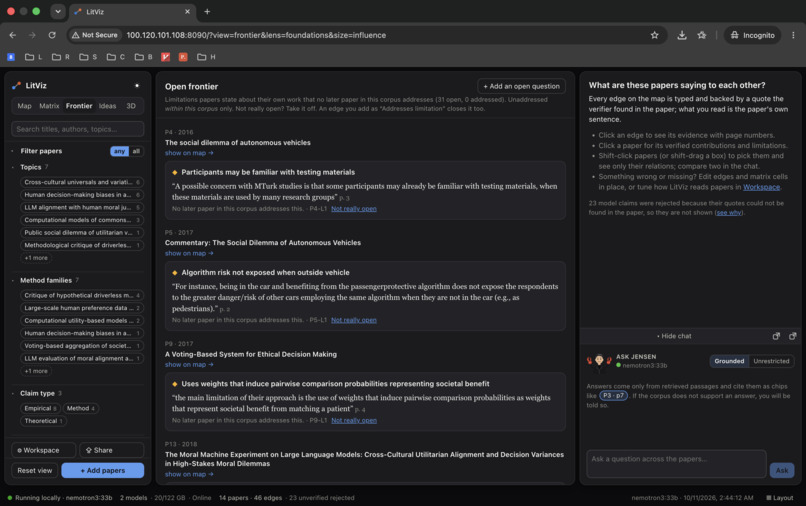
Inferred gaps view
-
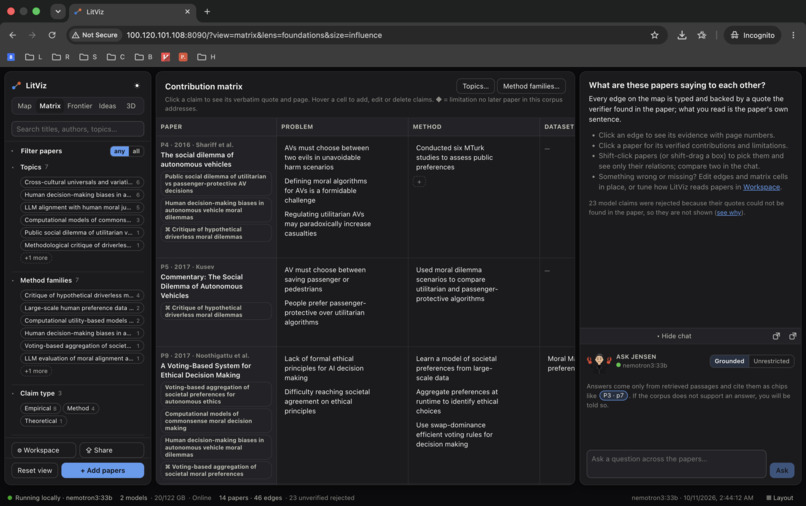
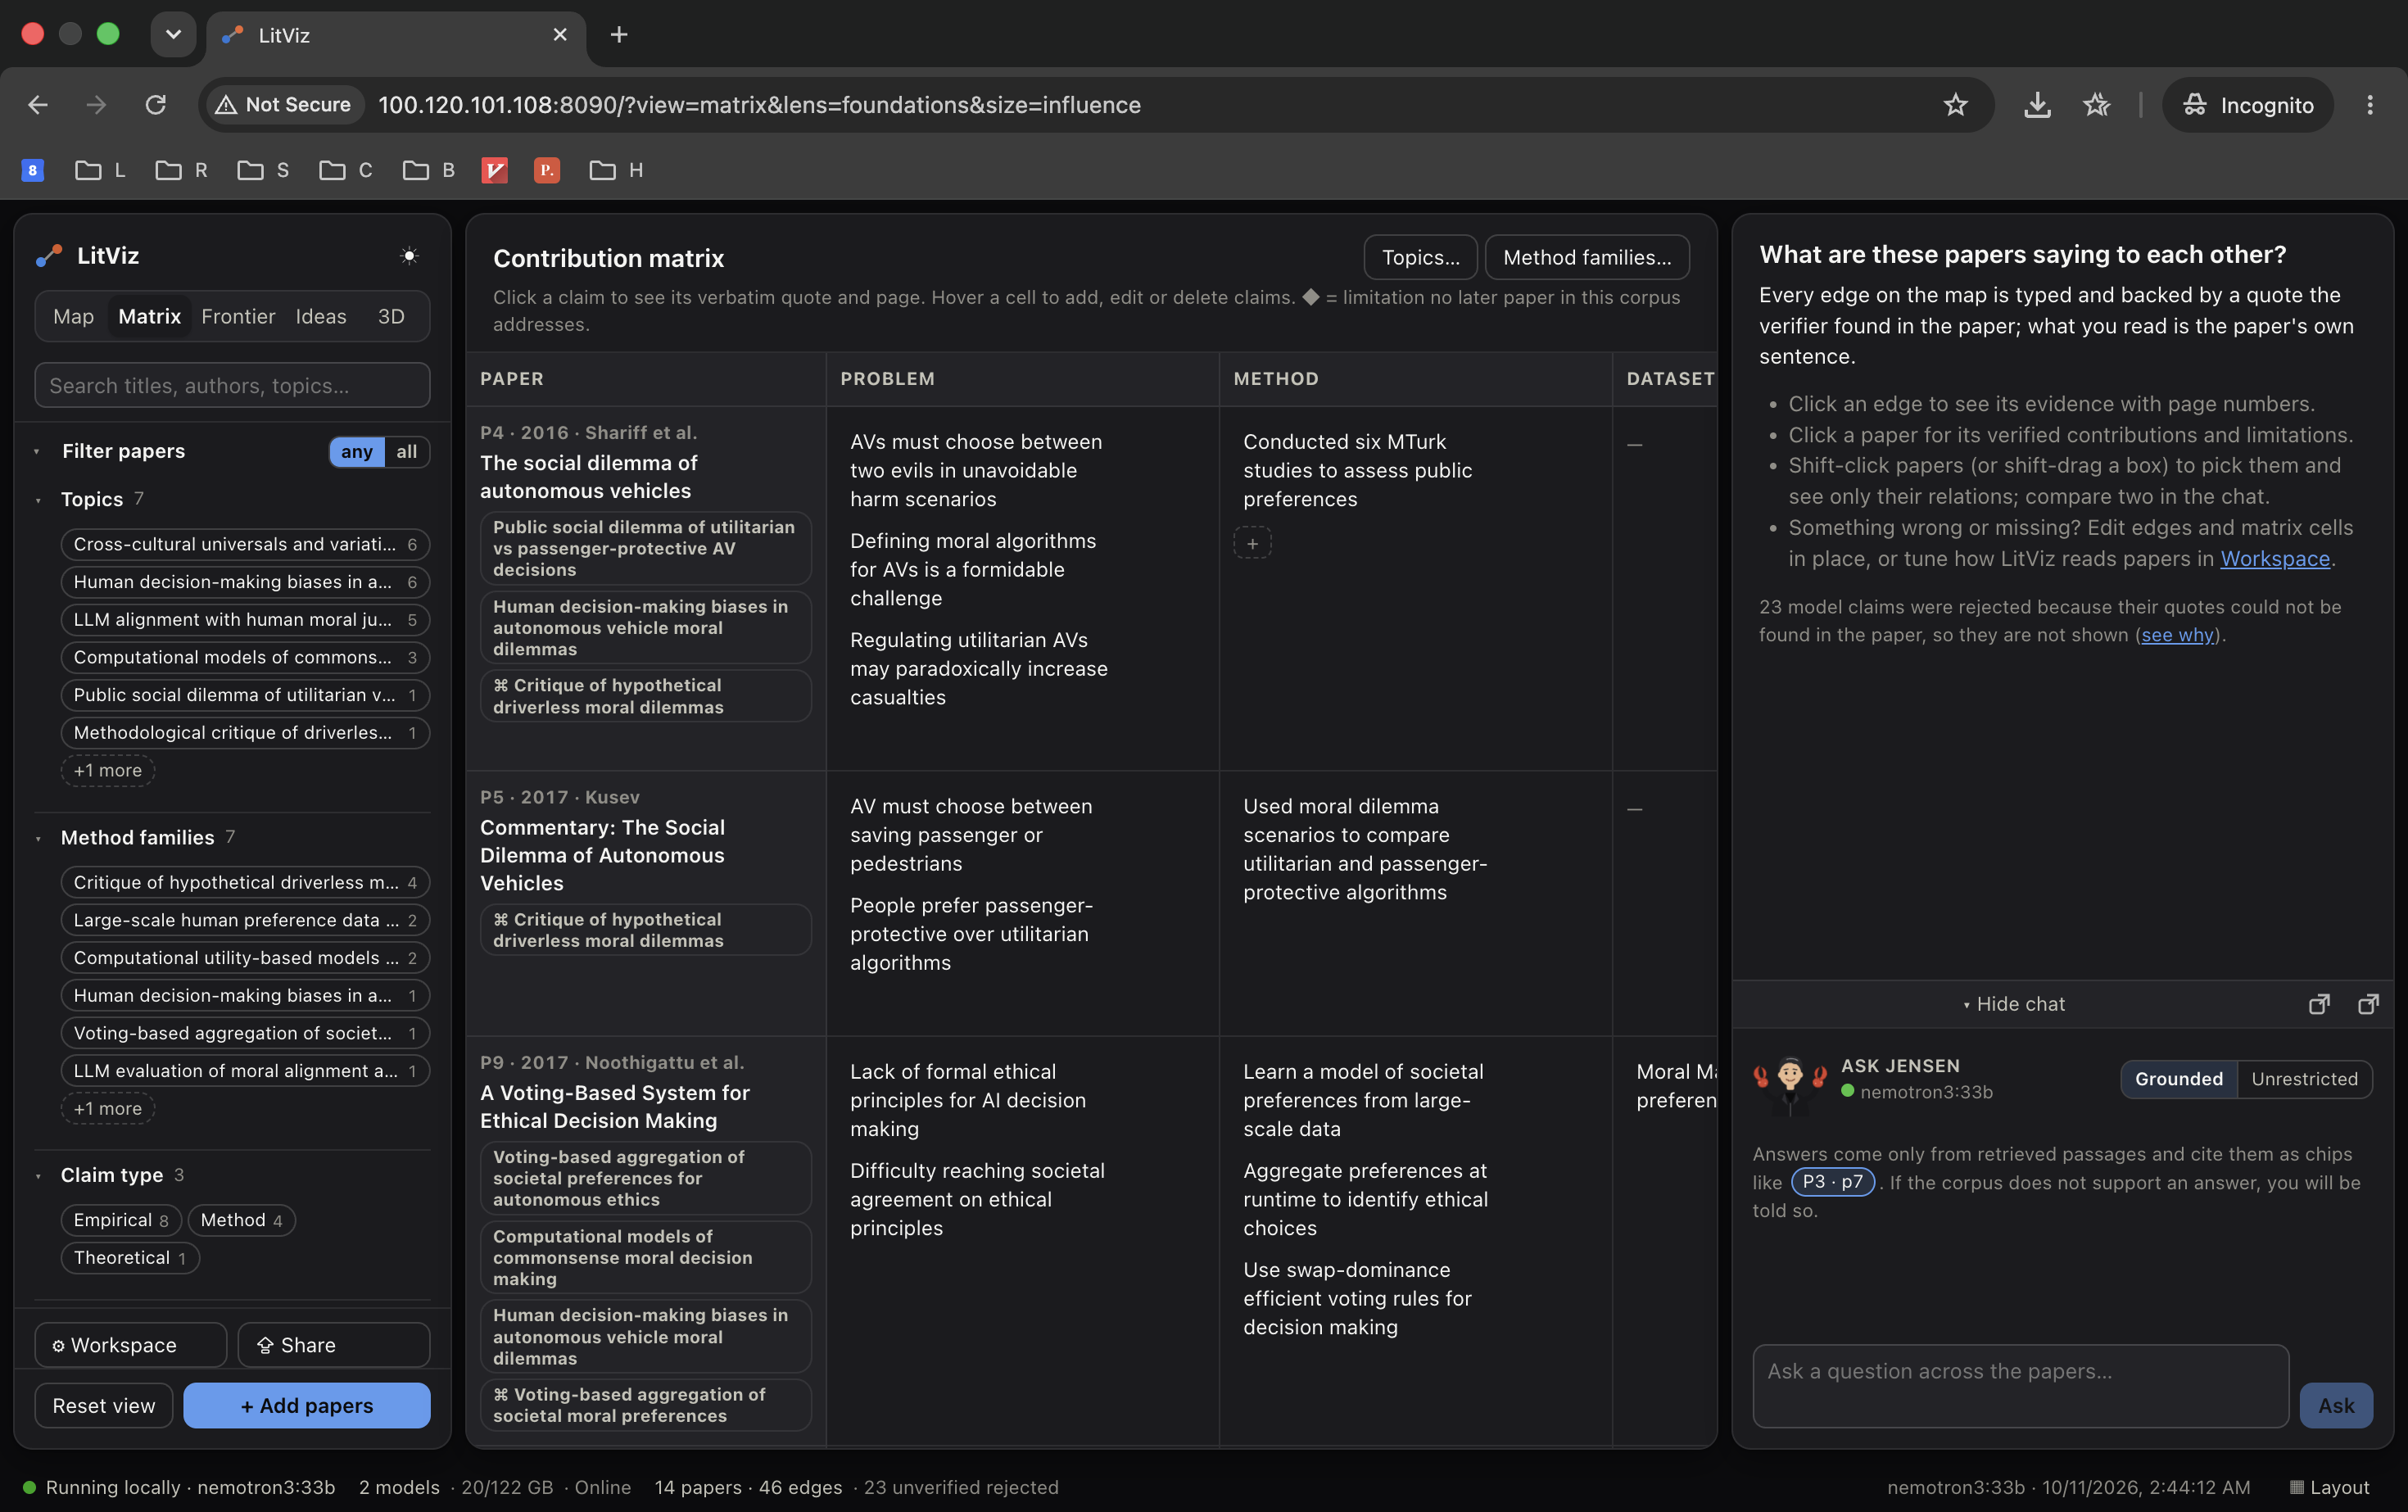
Contribution matrix
-
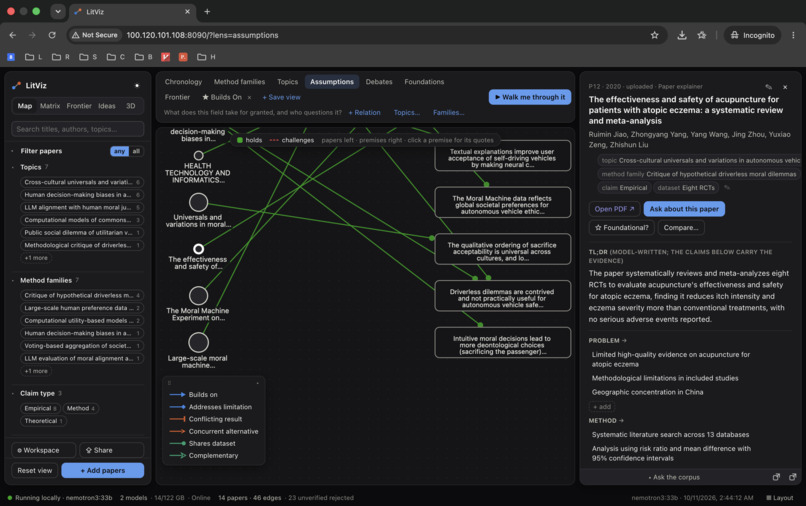
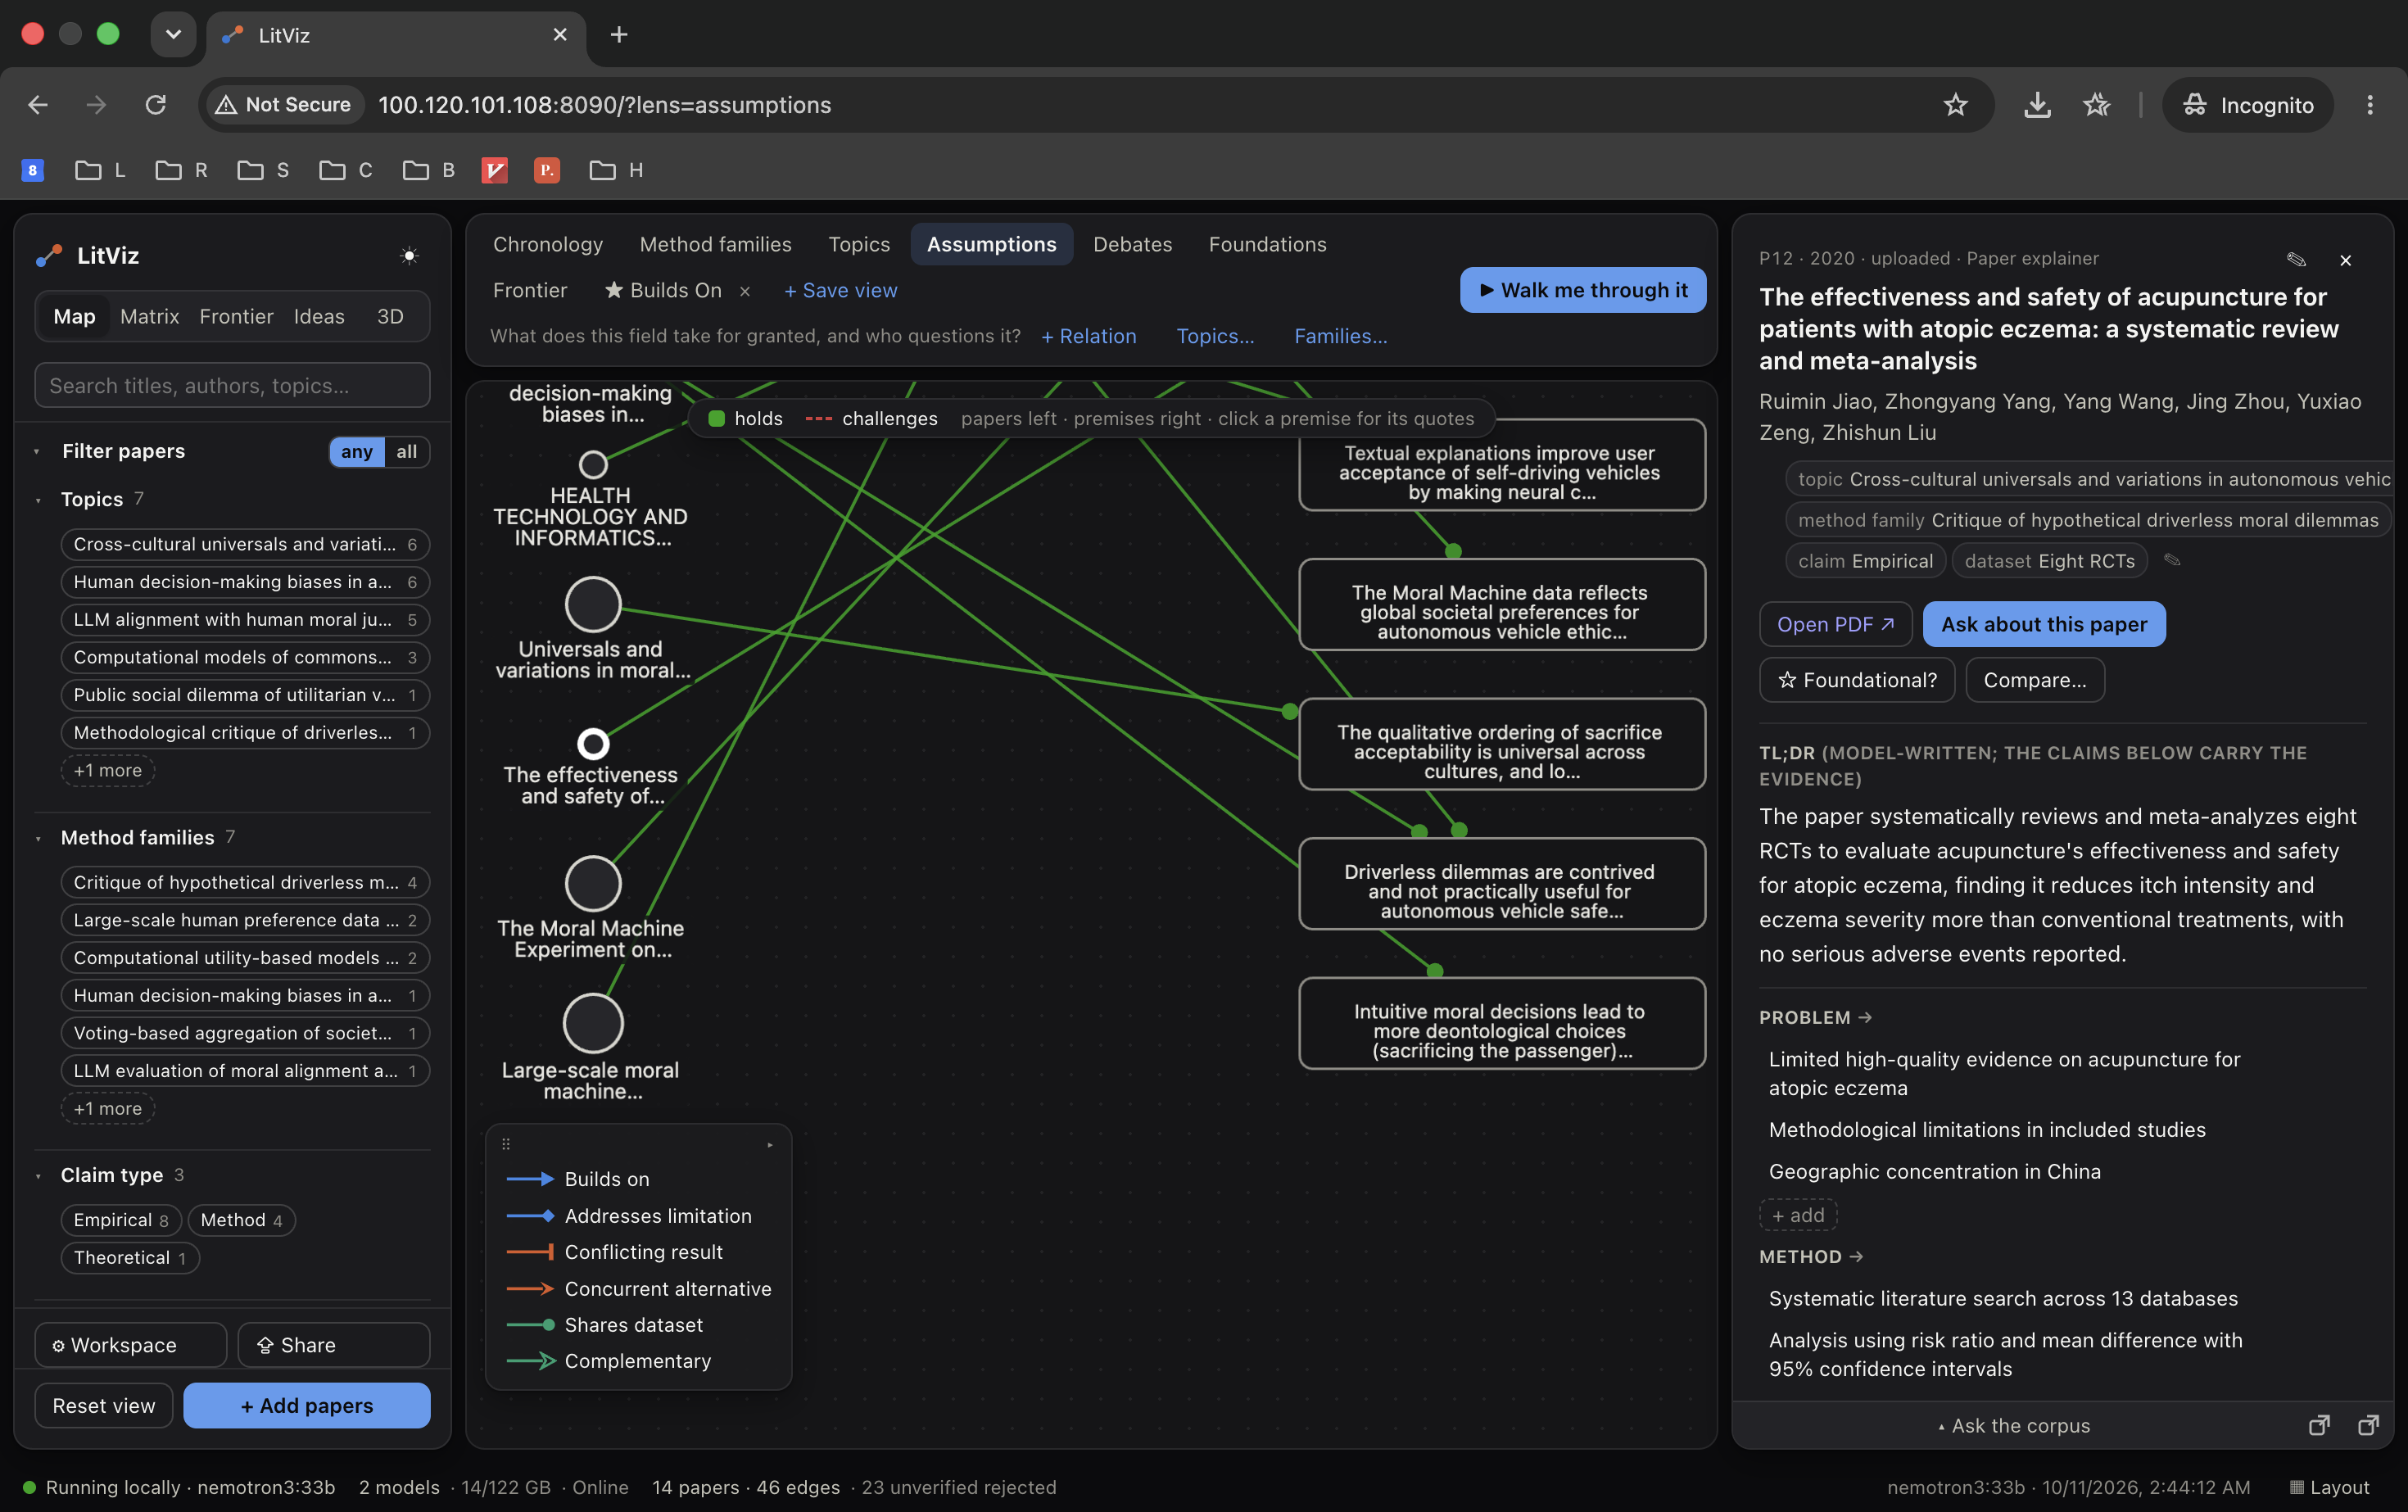
Assumptions view
-
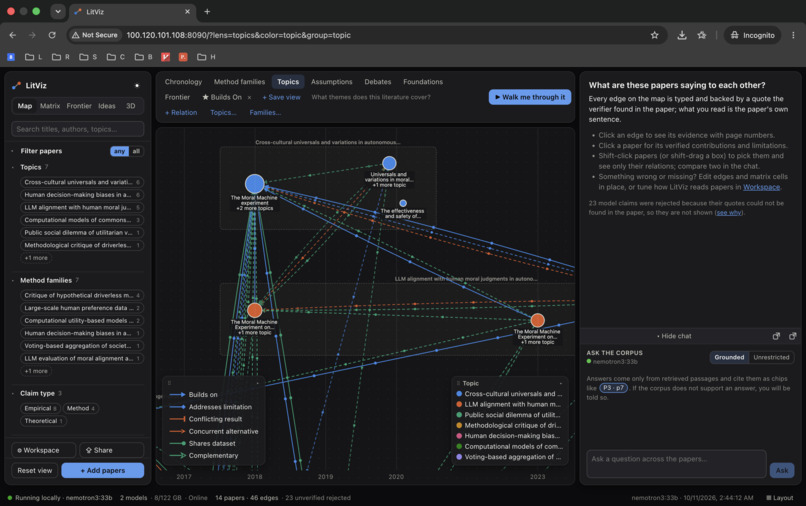
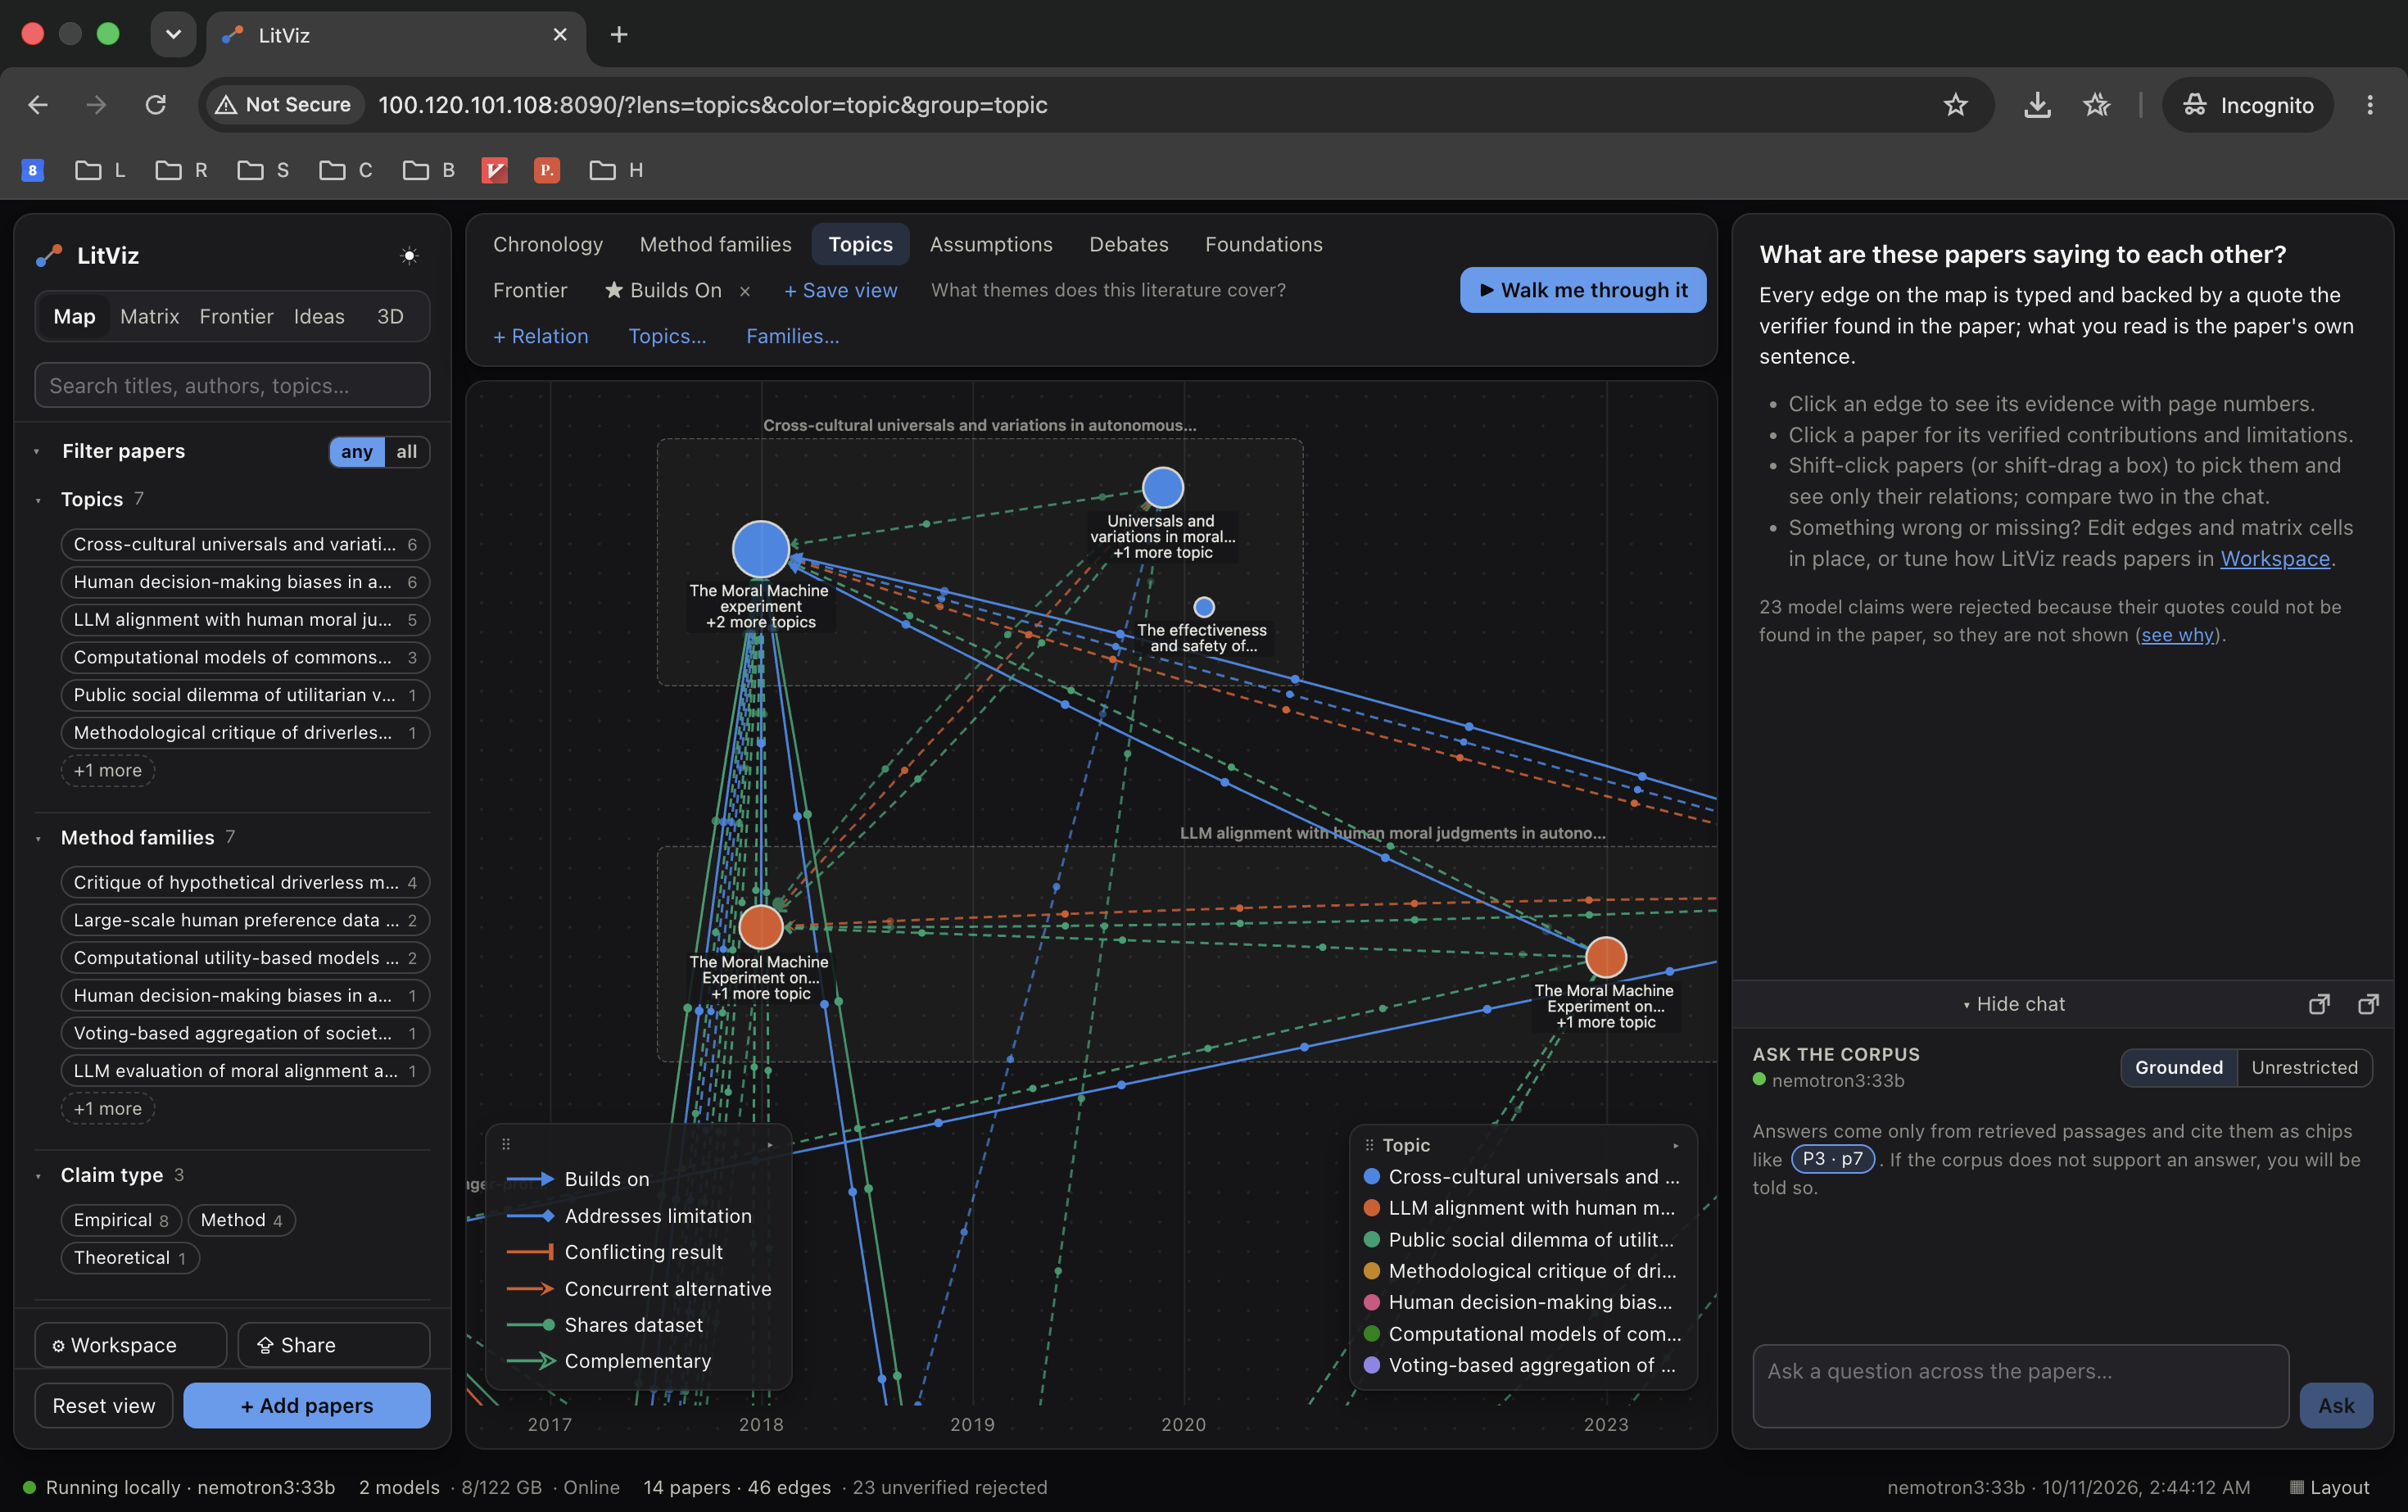
Topics view
-
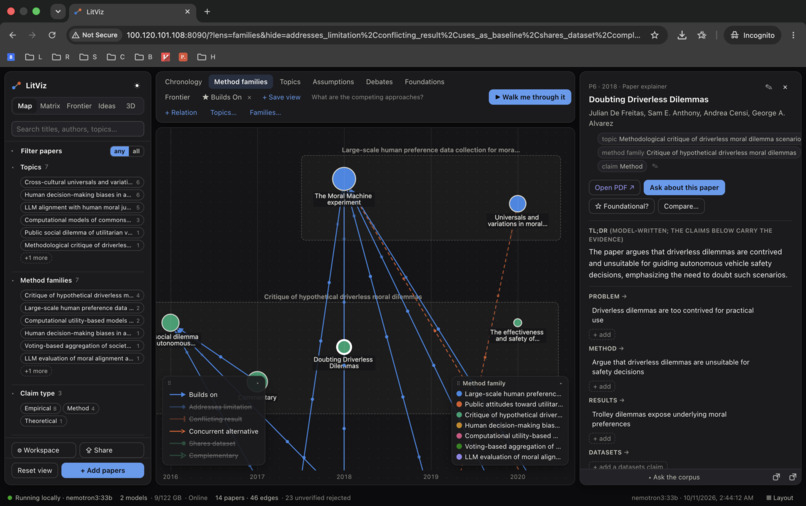
Method families view
-
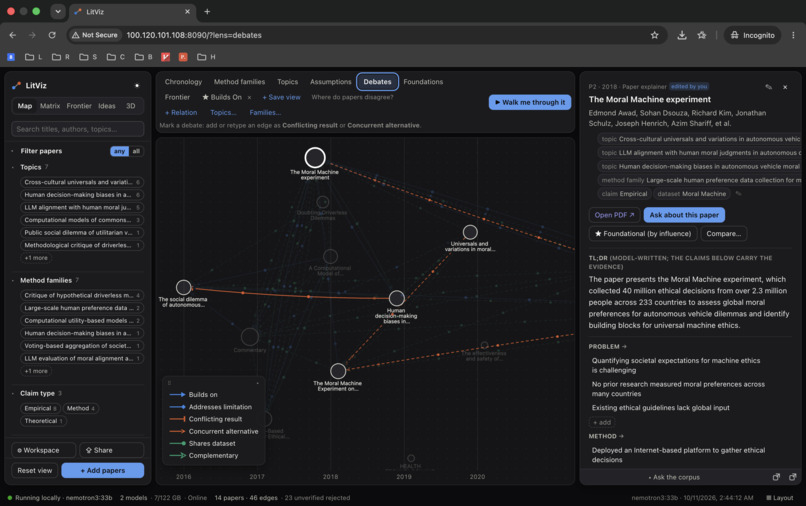
Conflicts with filter
-
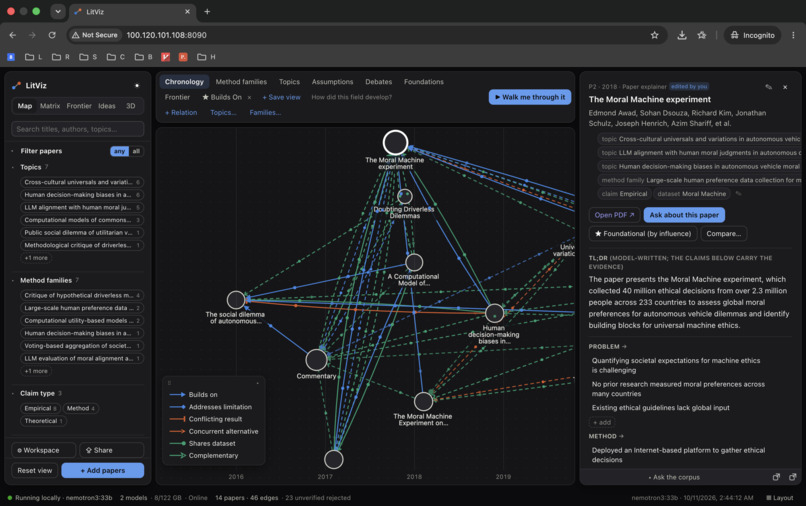
Home page
-
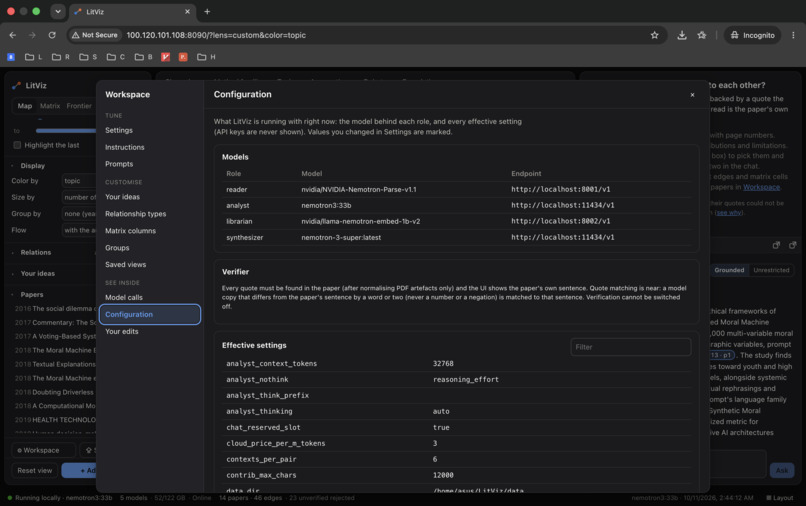
Config view
LitViz
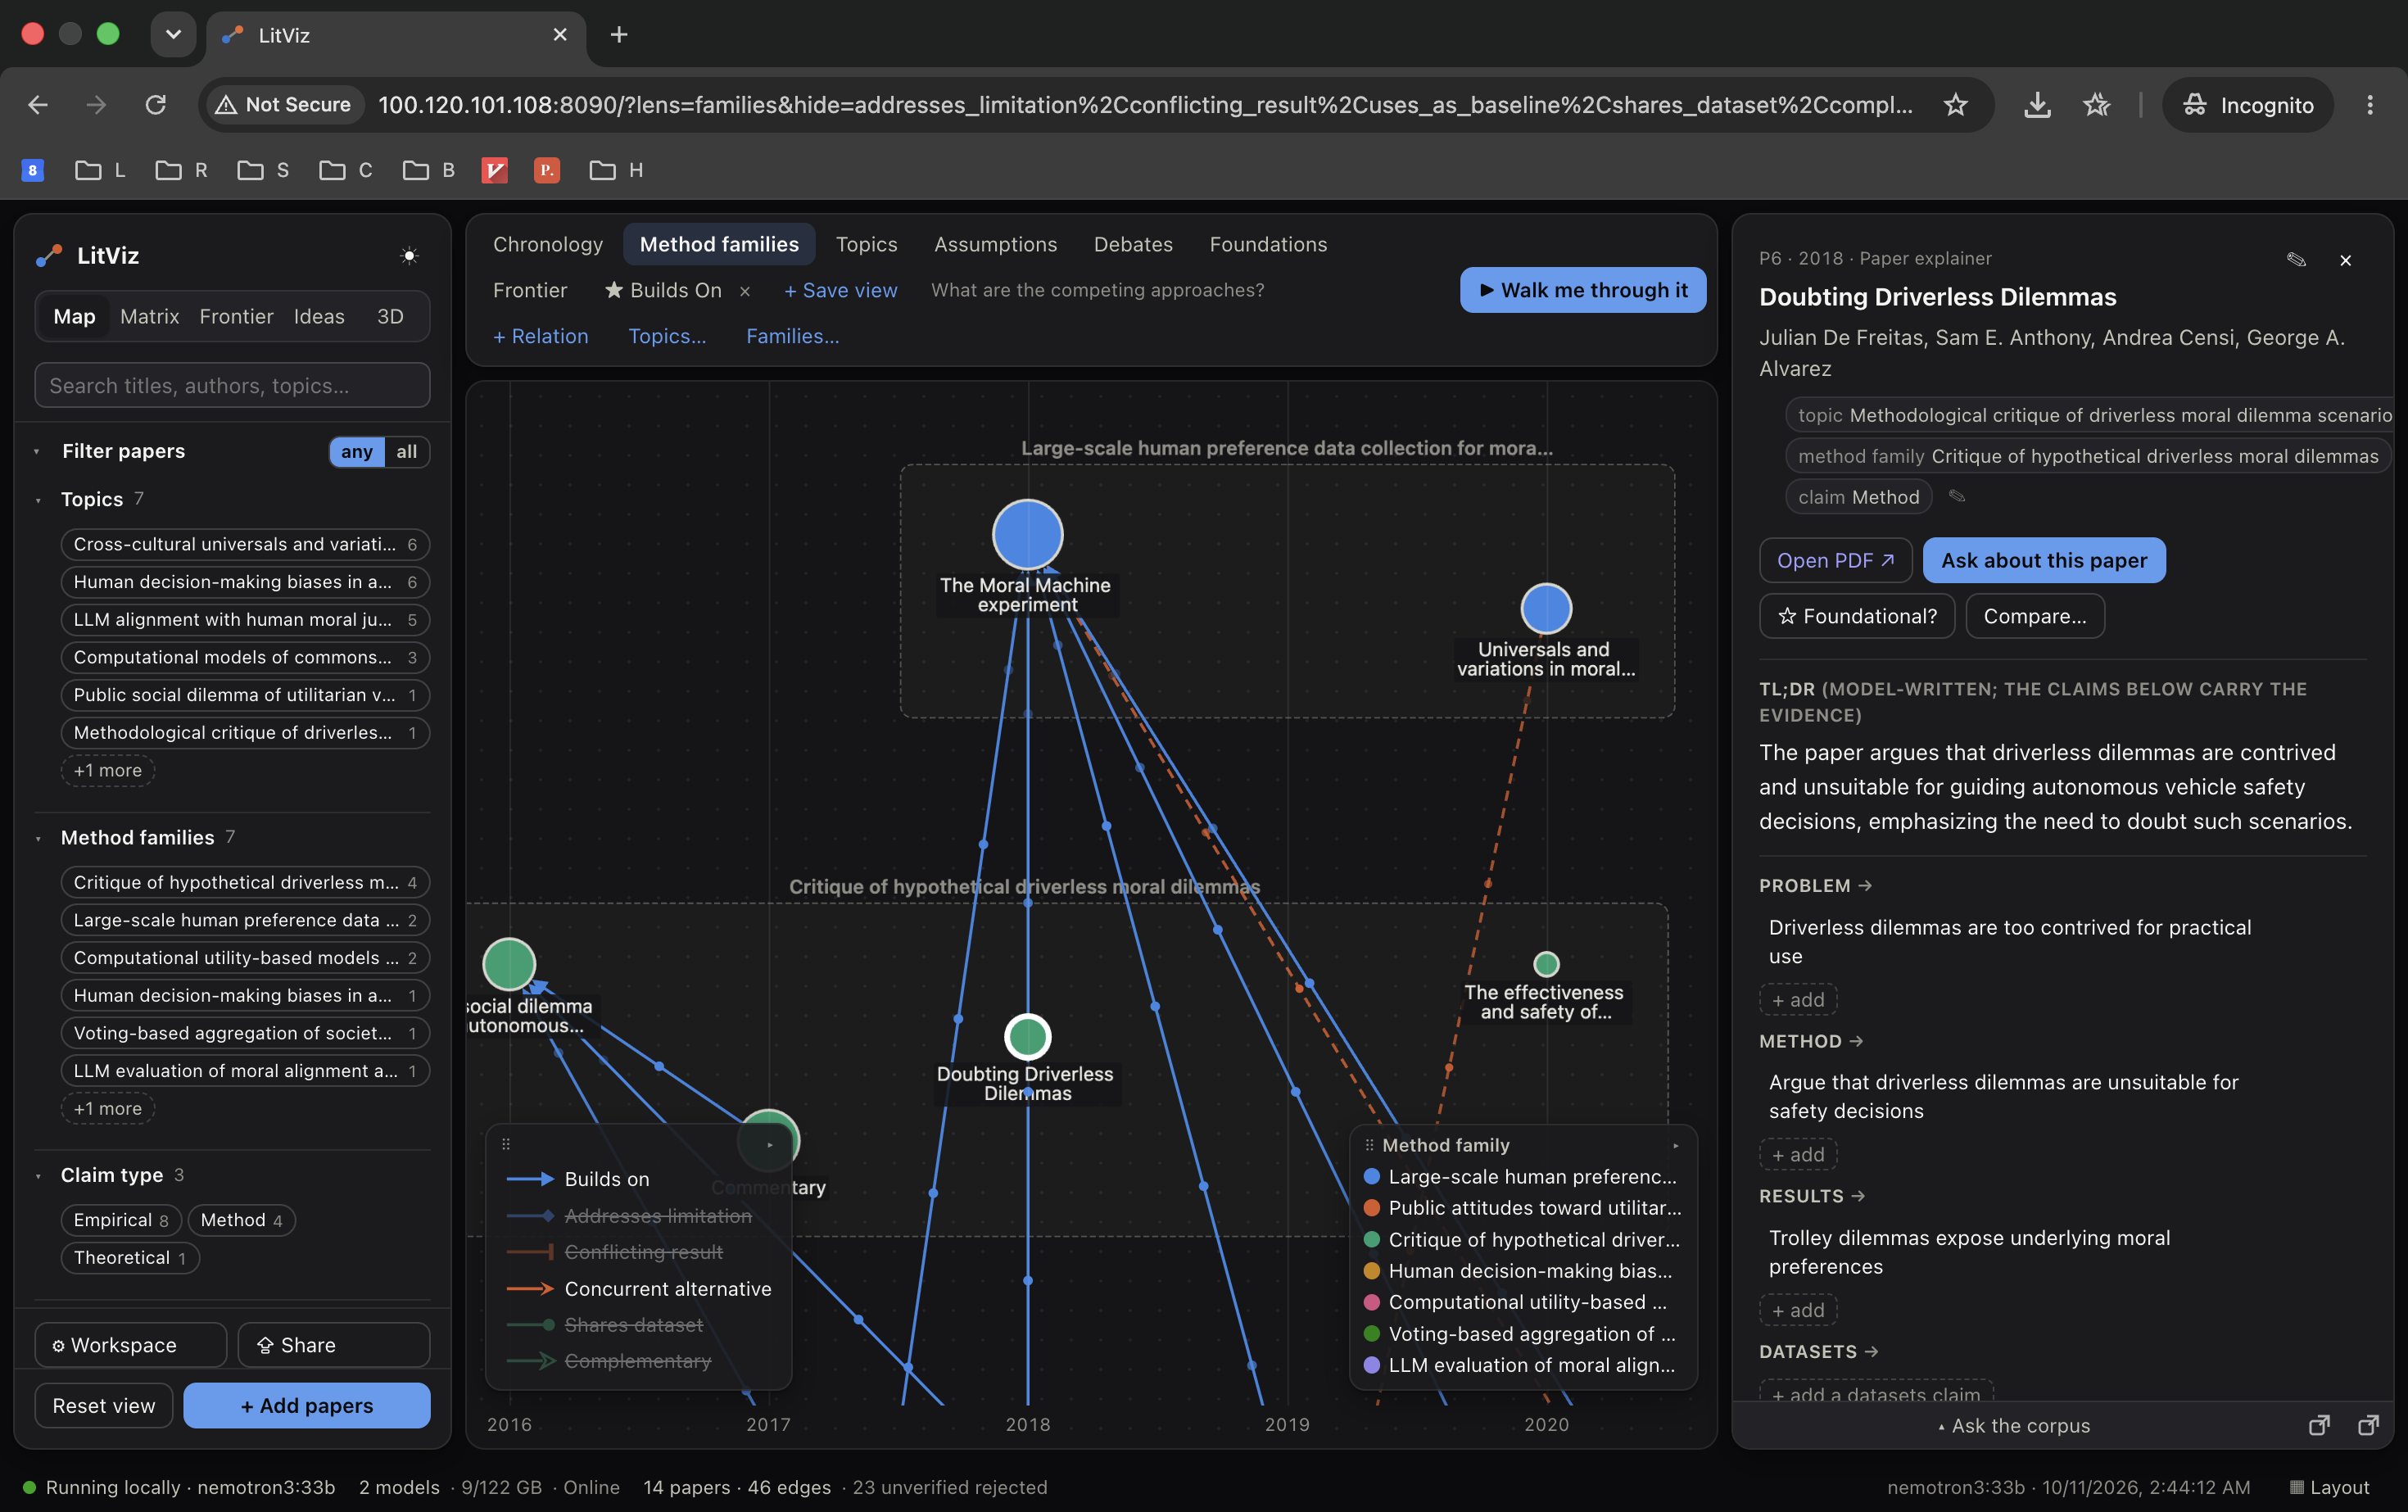
Citation maps show you that papers are connected. LitViz shows you what they are saying to each other, with every link backed by a verbatim quote, running entirely on your own machine.
Inspiration
Researchers are pasting unpublished, NDA'd, and medical data into ChatGPT and Claude every day, because there's no good local alternative.
As a junior CS researcher, I do literature reviews for my research teams. I'd spent weeks hand-building my own pipeline: Semantic Scholar and Asta for retrieval, NotebookLM for grounded answers, Claude artifacts for visuals, ChatGPT for deliberation. It worked, but it was stitched together, and I was uploading my team's half-baked, unpublished ideas to the cloud to make it work.
So during the hackathon, we talked to over 20 researchers in and outside our field. They told us two things:
- Some data legally can't touch the cloud. Medical researchers and anyone working under an NDA want to deliberate with an LLM, but they can't upload what they're working on.
- Nothing is built for thinking through a corpus. Today's tools are general-purpose or retrieval-centered. They help you find papers, not see how the papers you already have connect, disagree, and leave gaps.
LitViz is the tool we wished we had.
What it does
Drop in a folder of research papers and LitViz builds a map of how they relate, entirely on your own hardware.
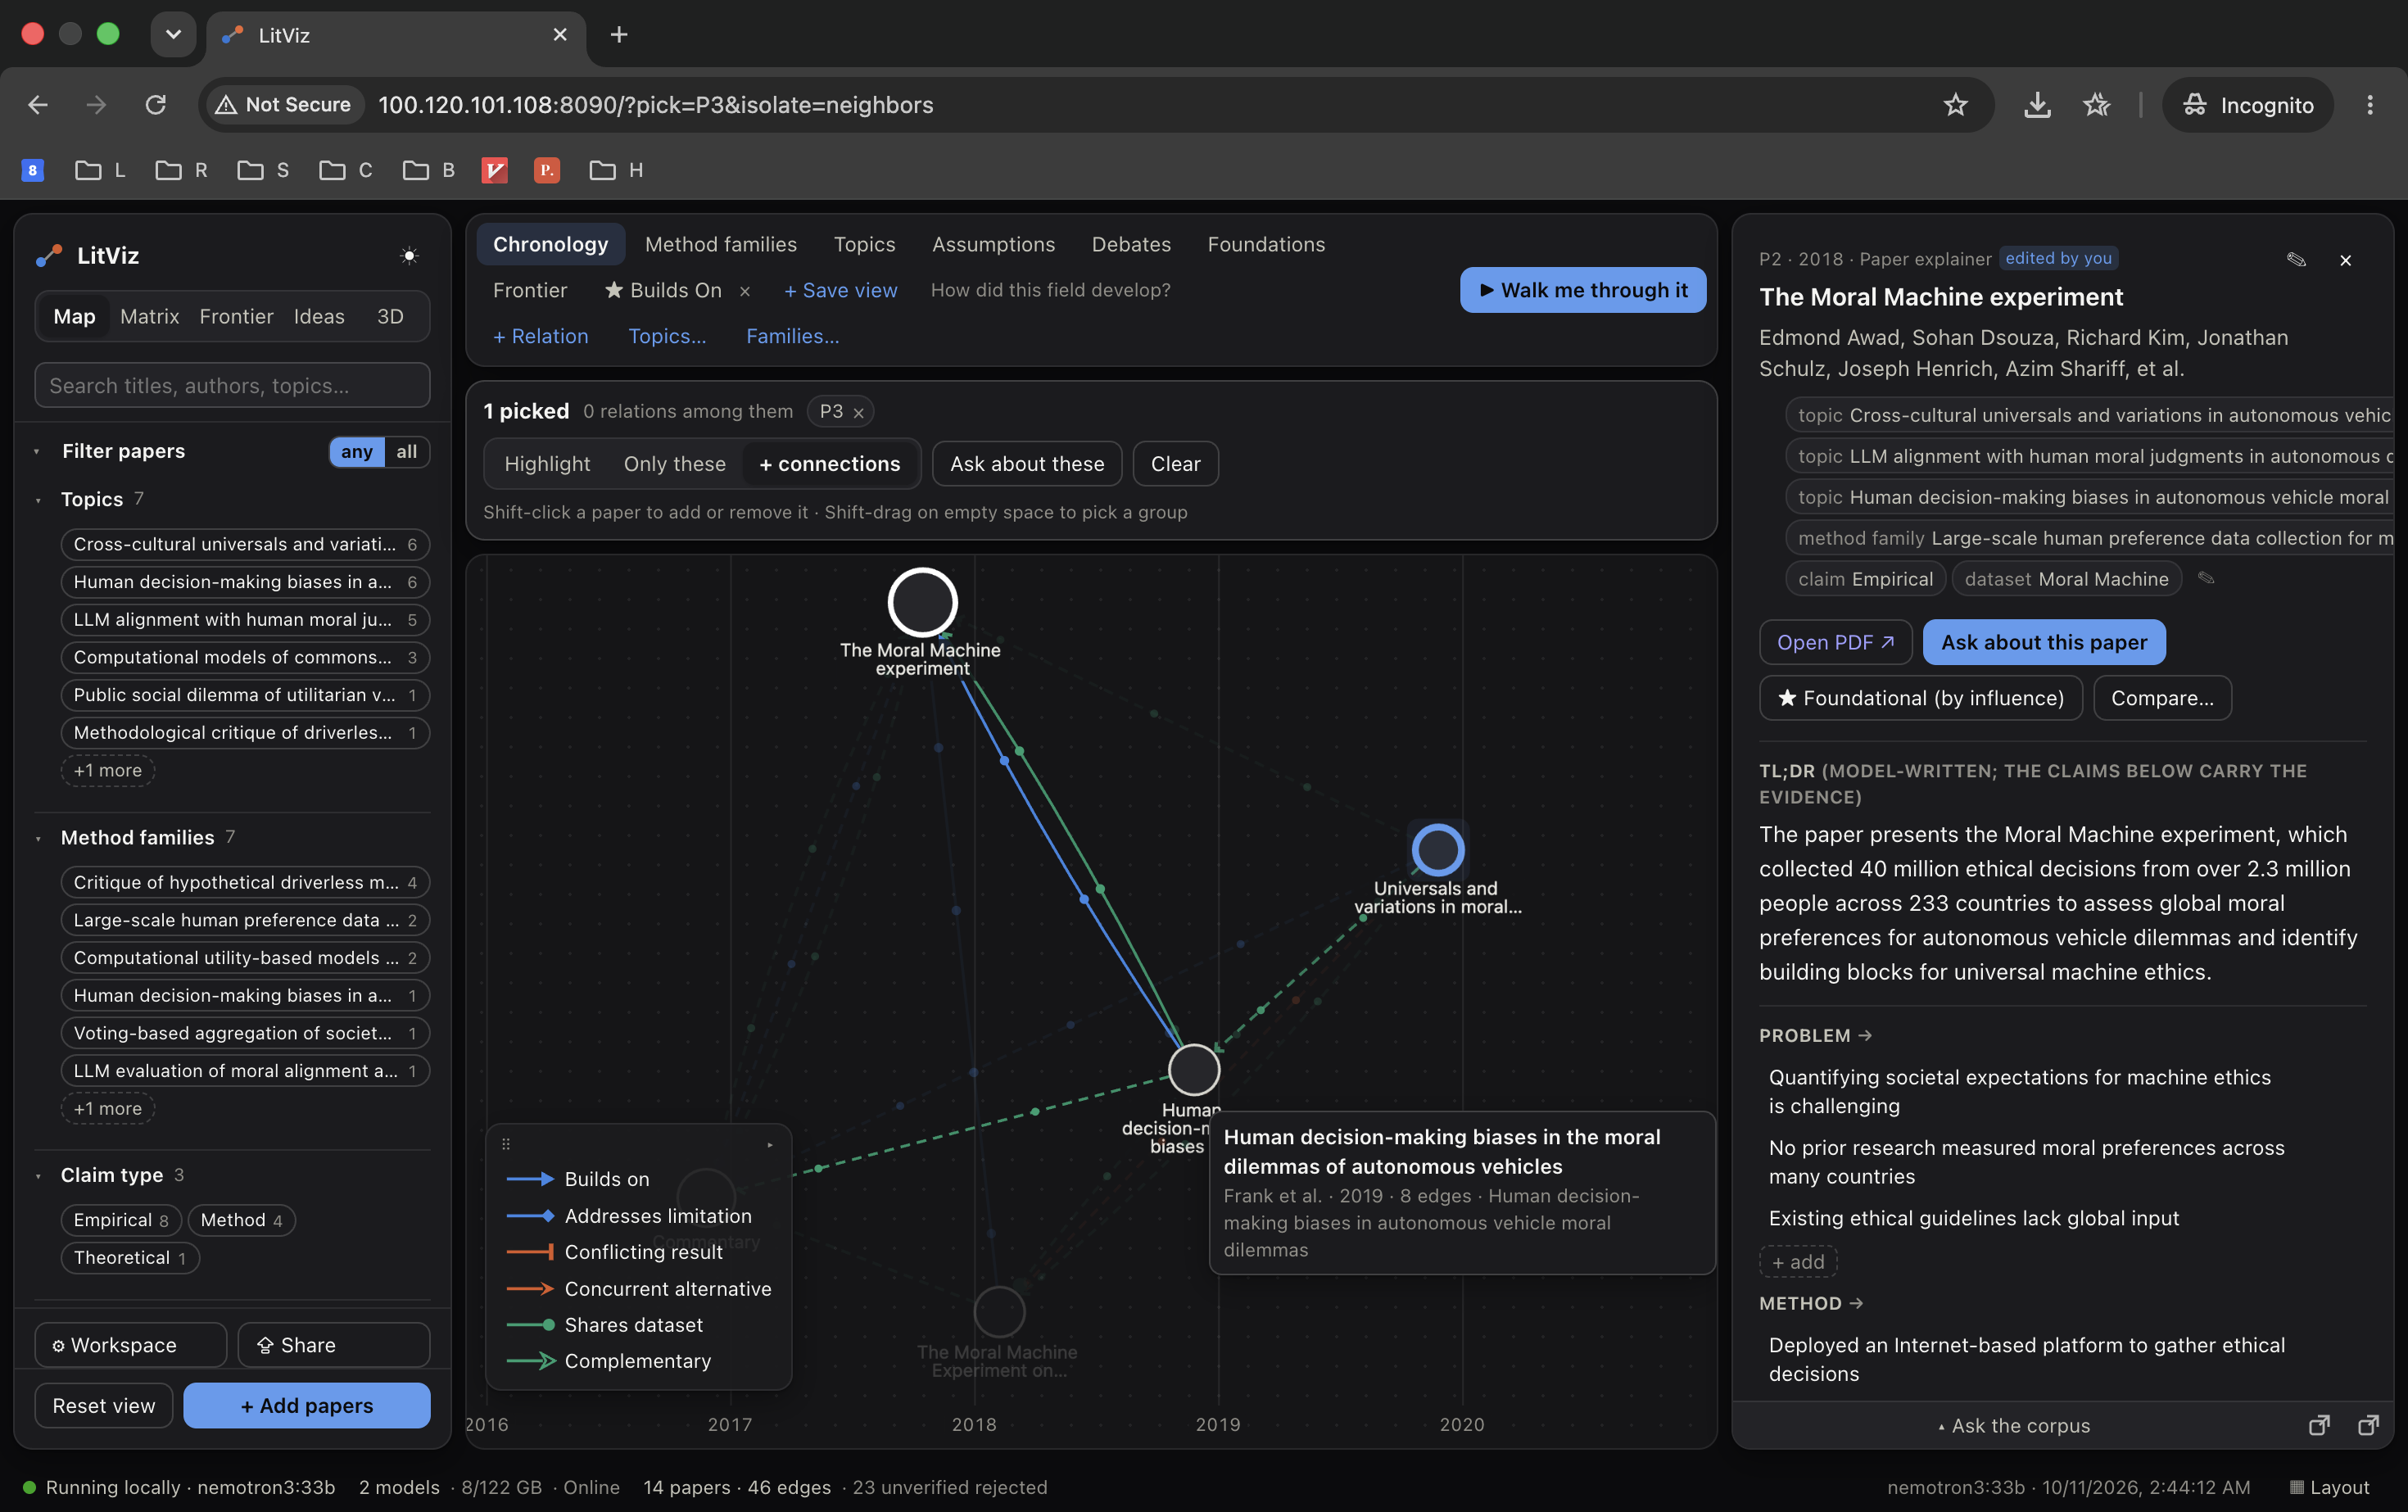
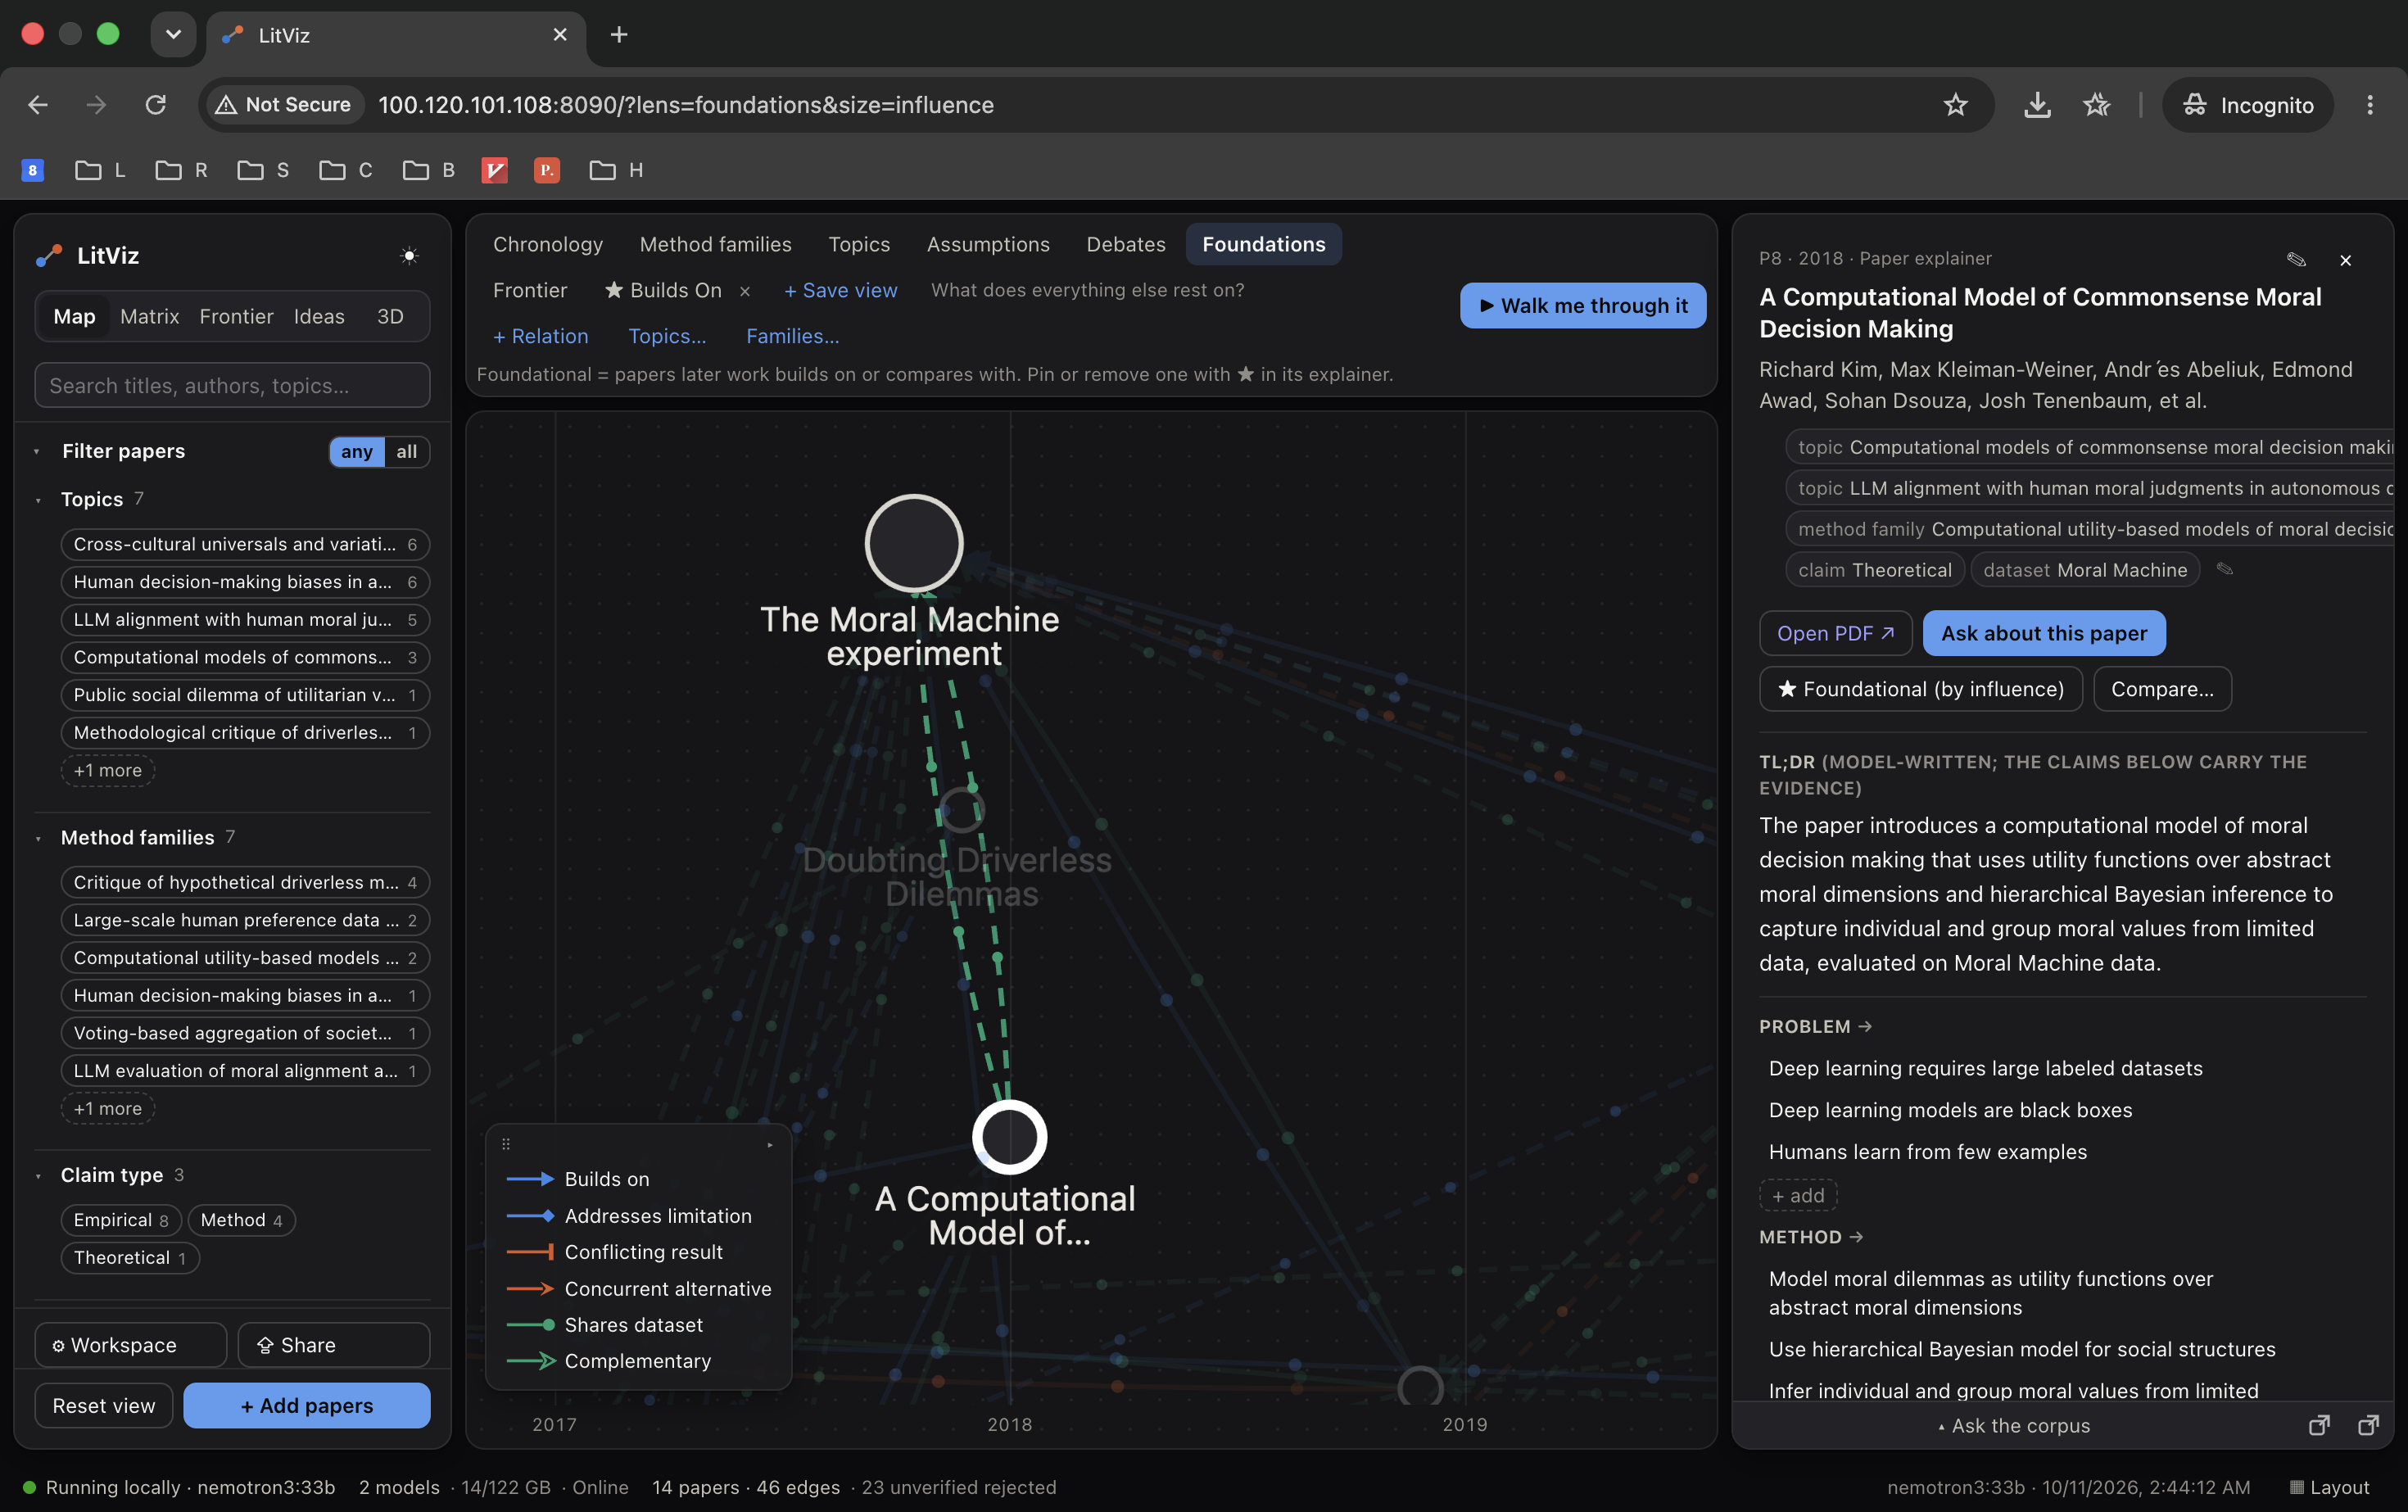
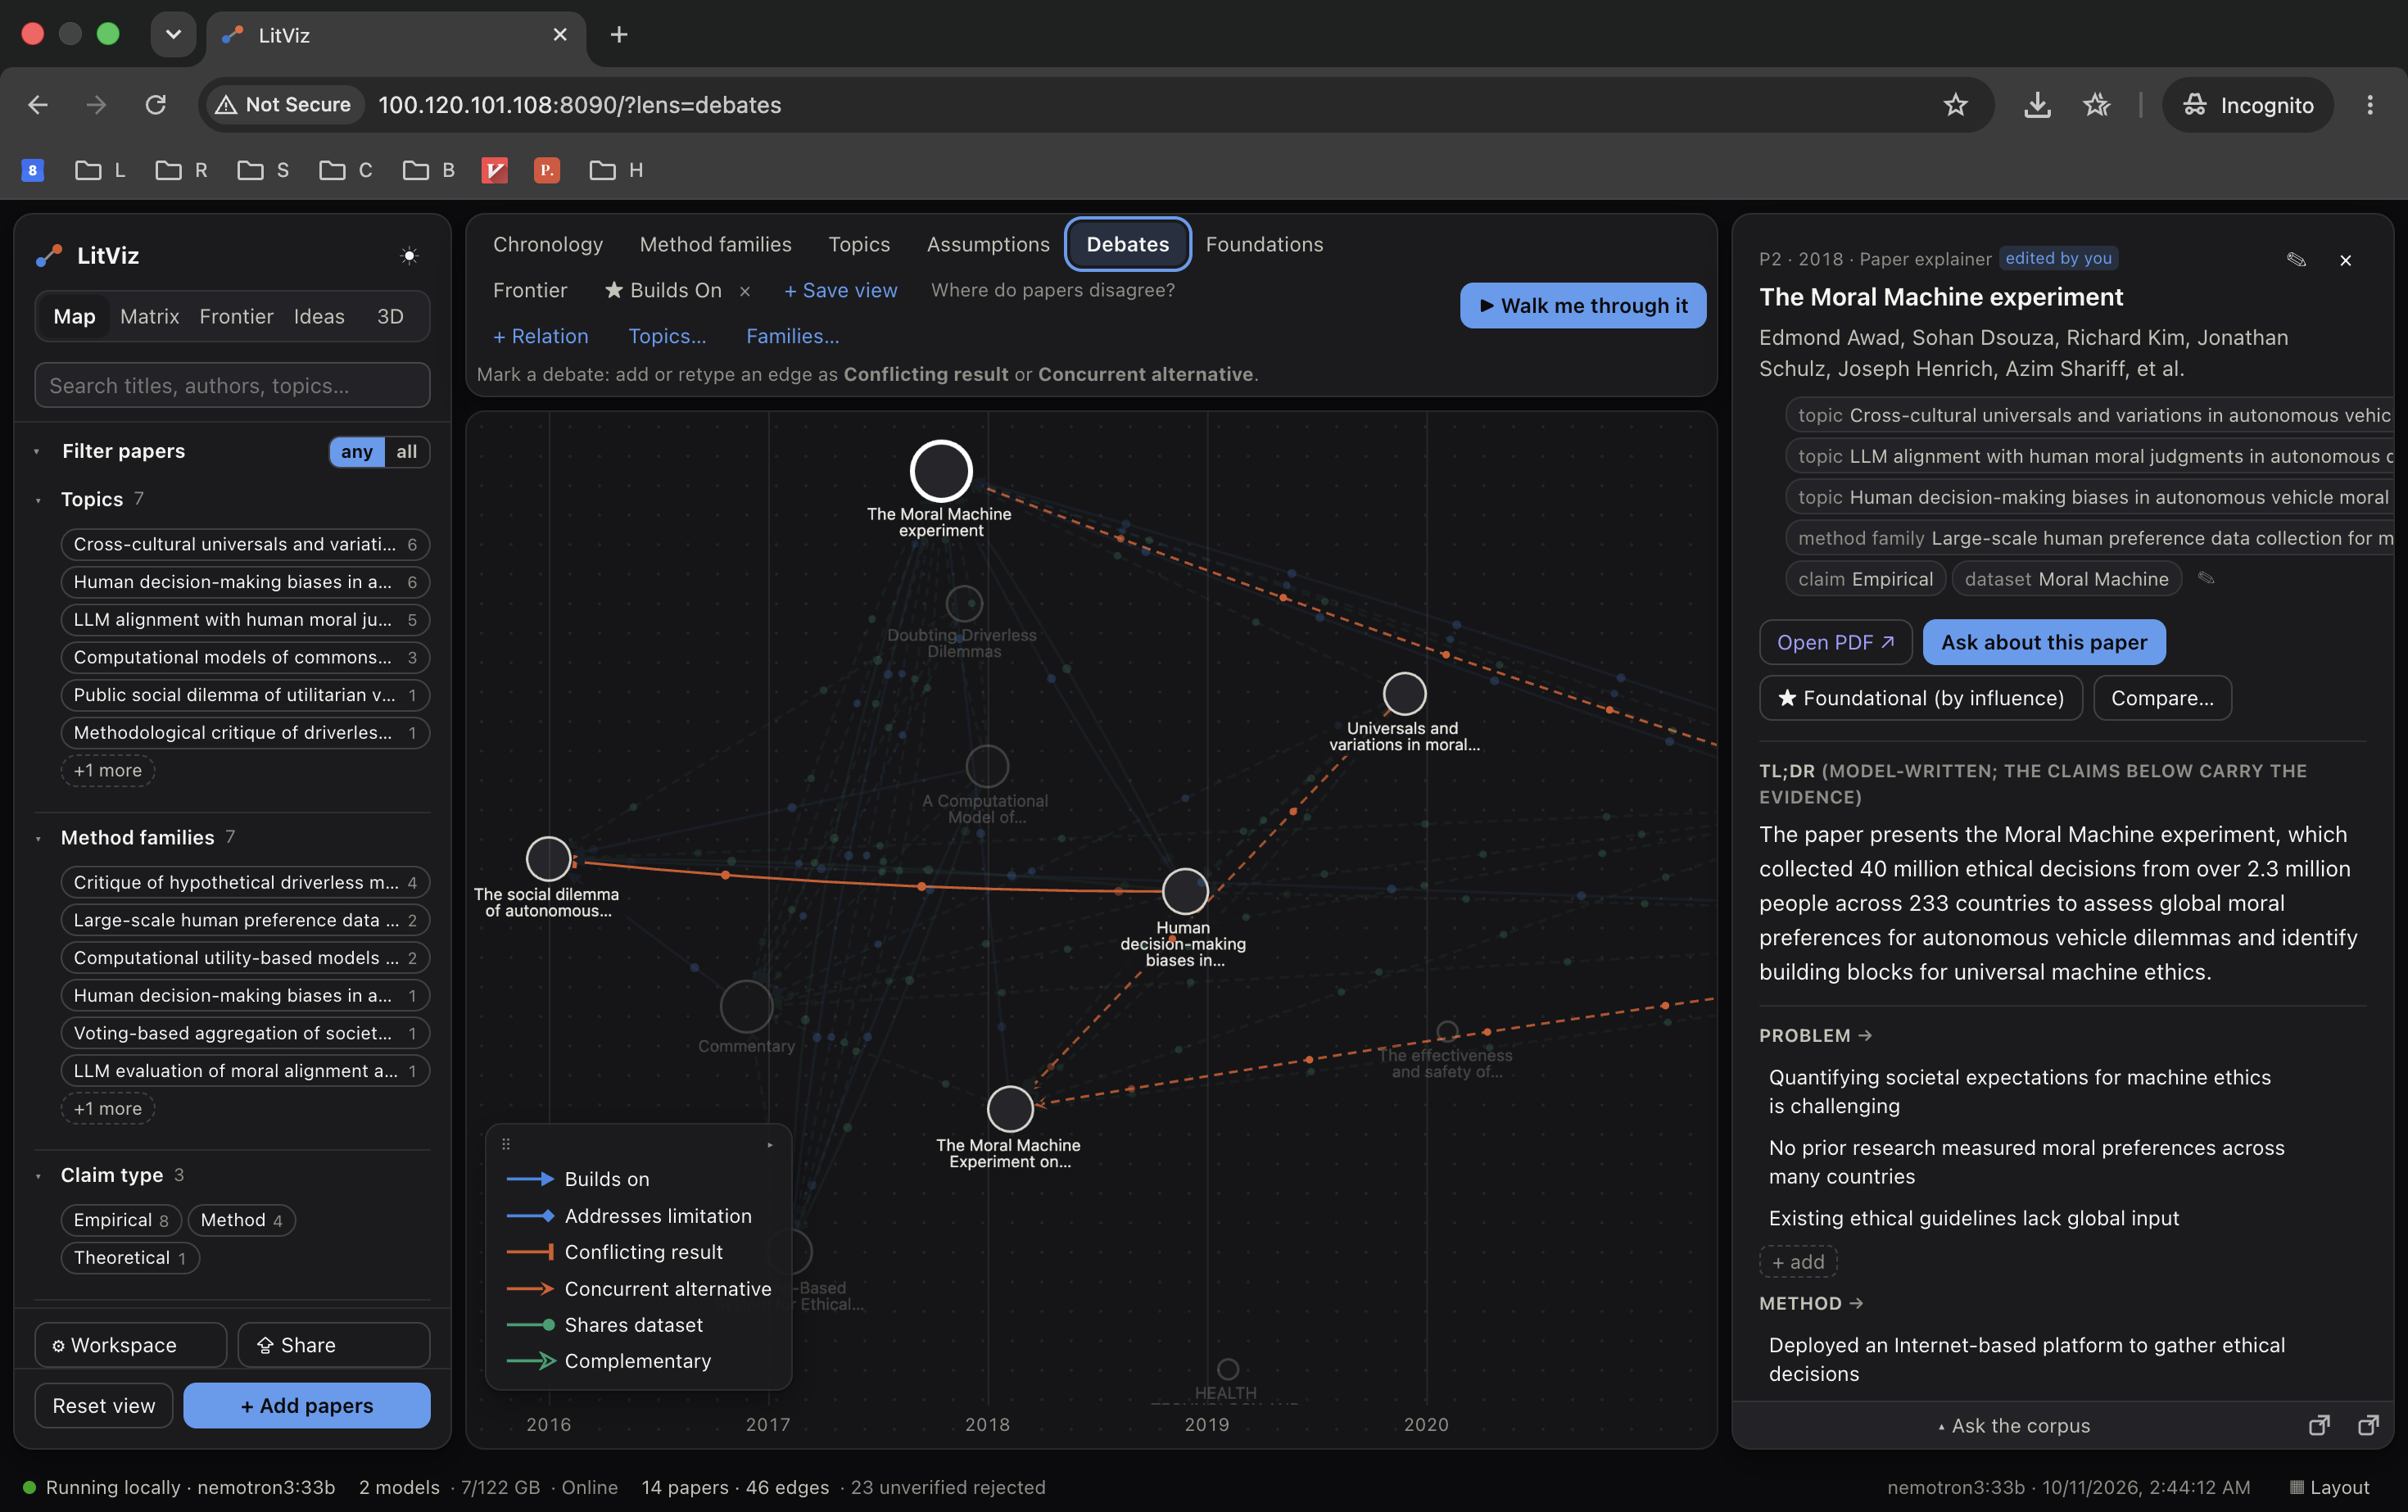
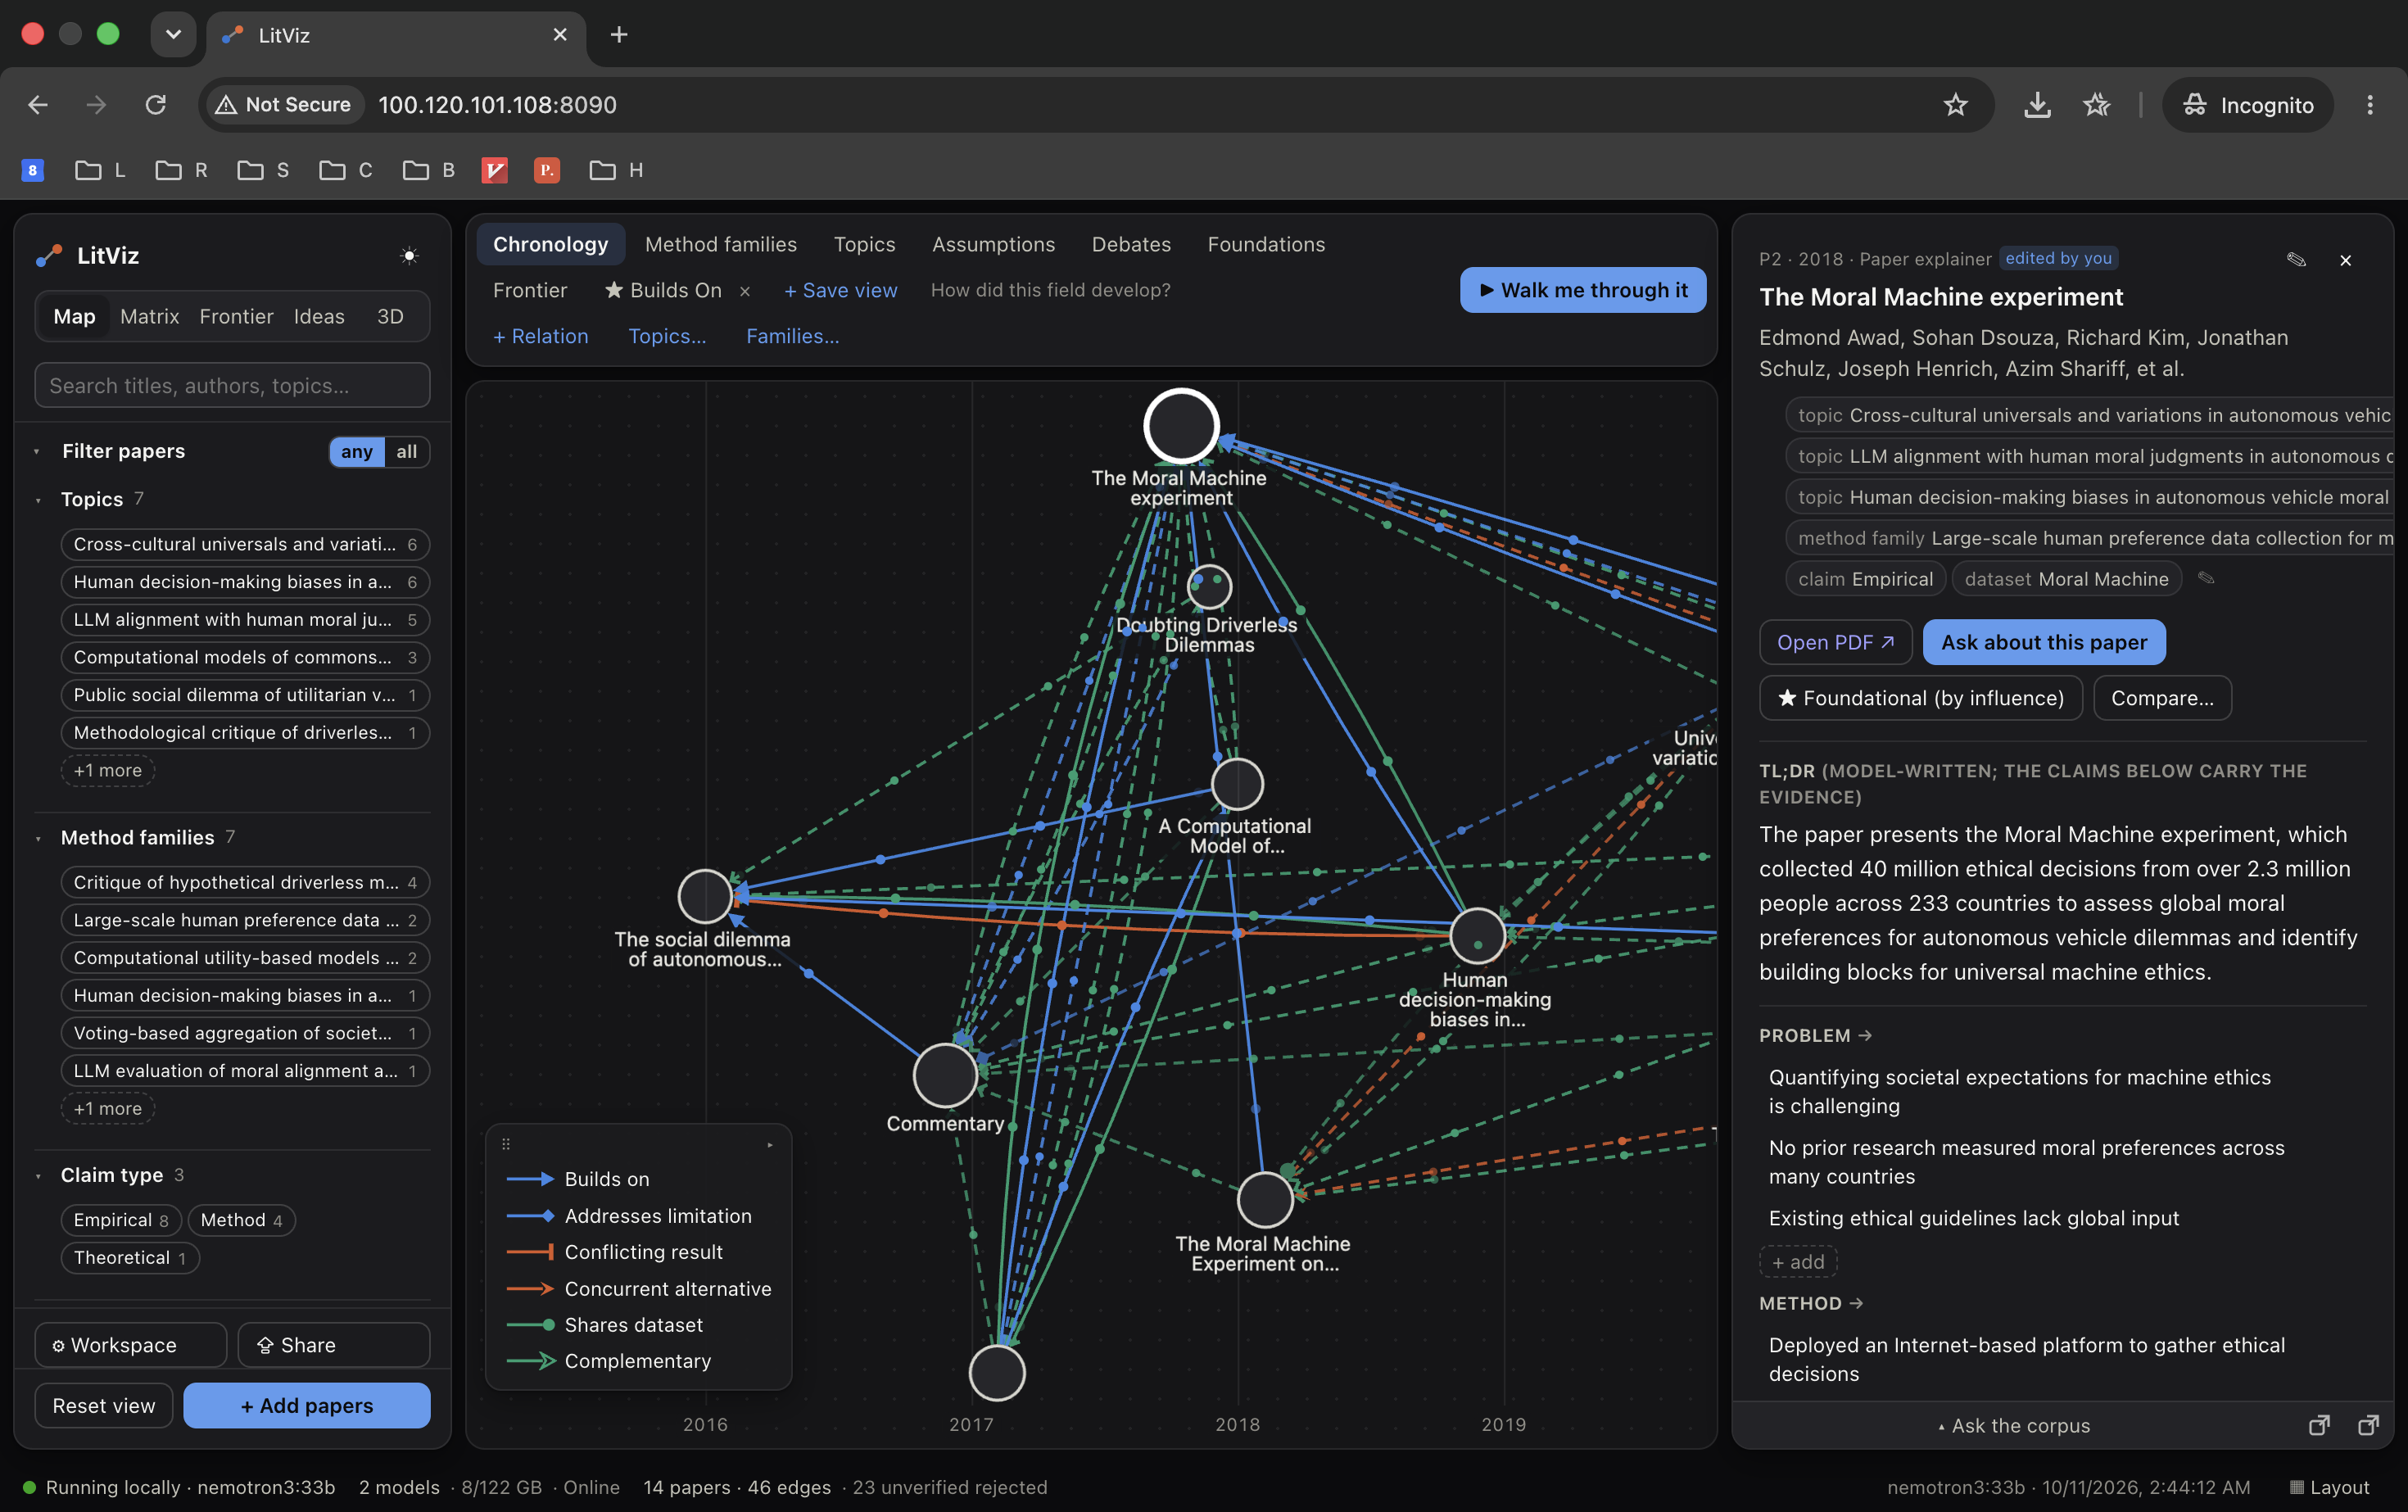
- A map of what papers say to each other. Nodes are papers, placed left to right by year. Edges are typed relationships: builds on, addresses limitation, conflicting result, concurrent alternative, uses as baseline, shares dataset, complementary, plus any type you define. Solid edges come from explicit citations; dashed edges are inferred between papers that don't cite each other.
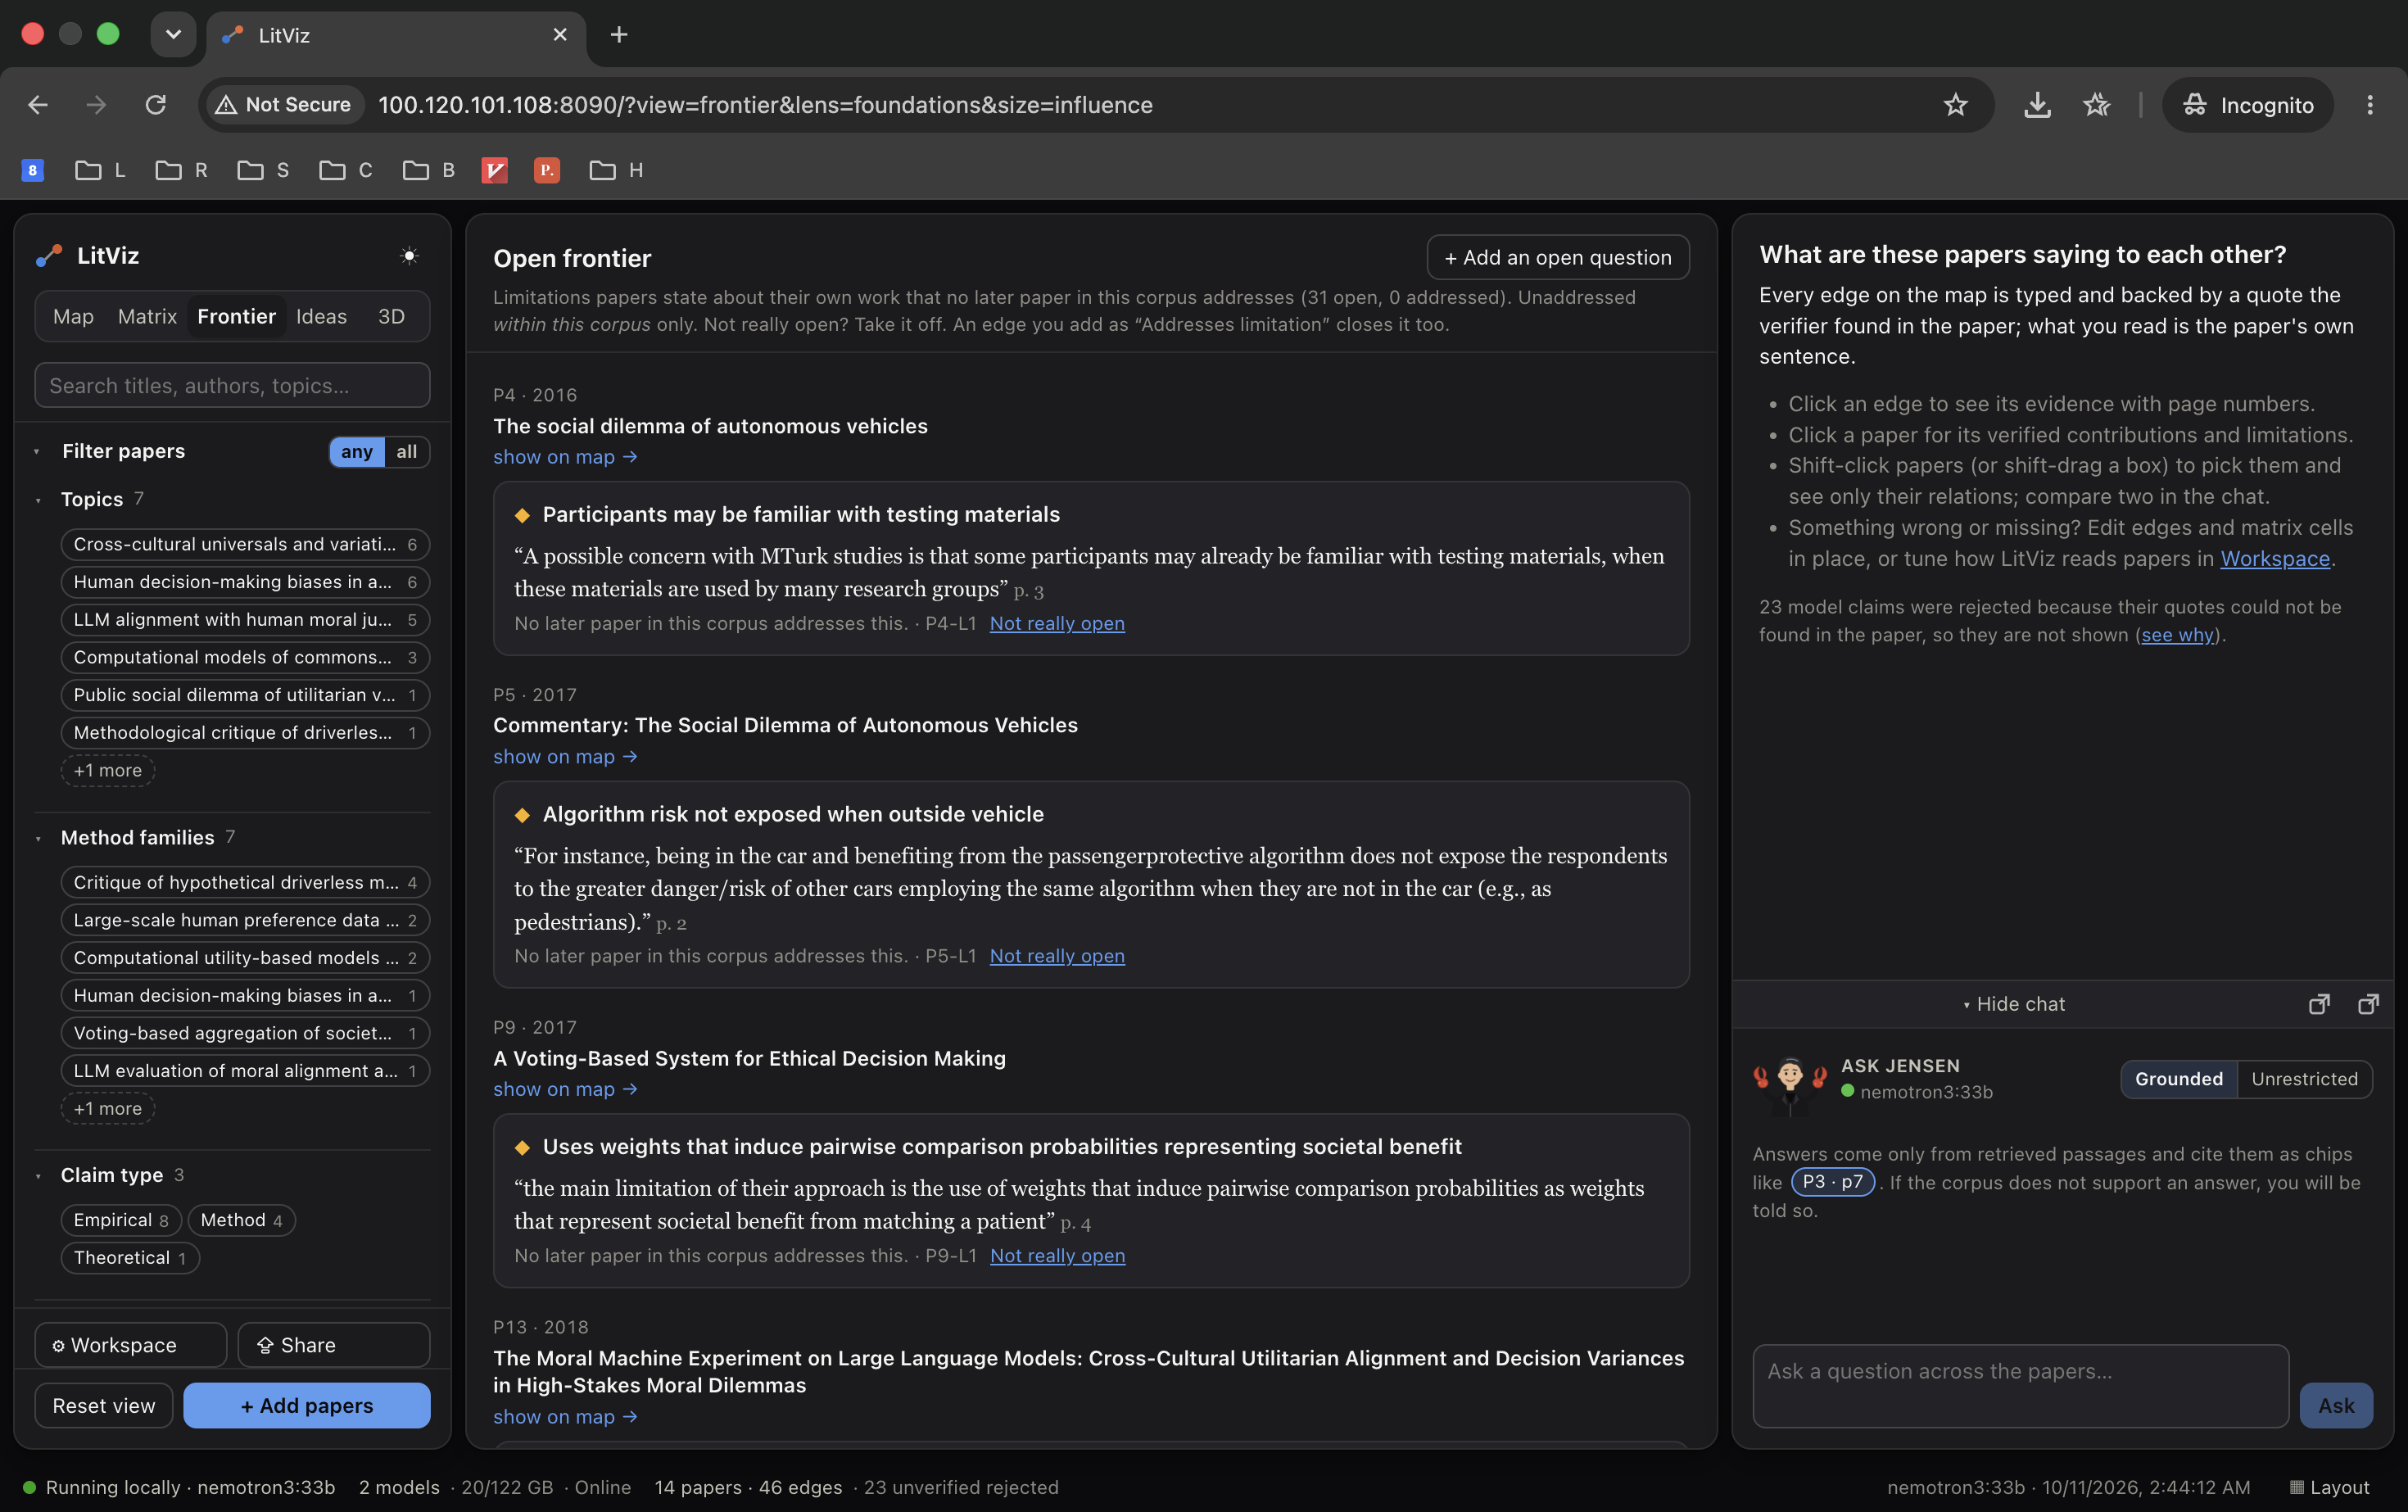
- Verify, don't trust. Click any edge to see the passages that justify it, with paper and page, highlighted in context. Every quote must appear verbatim in the paper, or the edge is dropped.
- Your ideas, placed in the literature. Point LitViz at a folder of your notes, half-baked ideas, and proposals. Each idea is compared against every paper (does it build on, address a limitation of, or complement existing work?), drawn on the map, and shown beside the open questions it may address. Ideas are never counted as literature and stay out of shared snapshots unless you opt in.
- Find the gaps. The Frontier view lists limitations that no later paper in the corpus addresses. The Debates lens shows only conflicting results and competing approaches.
- A contribution matrix. Papers × problem, method, datasets, key results, and limitations, with every cell backed by a quote.
- Grounded chat. Ask about the corpus, one paper, or compare two side by side. Answers cite passages as clickable
[P3:p7]chips, and an uncited answer is never shown as fact. - Interactive paper explainers. Results charts where every number is checked against the paper, formula explorers with sliders, method pipeline diagrams, ablation toggles, and the paper's real figures. Each one is labeled from the paper, reconstructed, or illustration.
- Guided walkthroughs. "Walk me through it" narrates the field as a story or a newcomer's reading order, with every claim cited, and exports to Markdown.
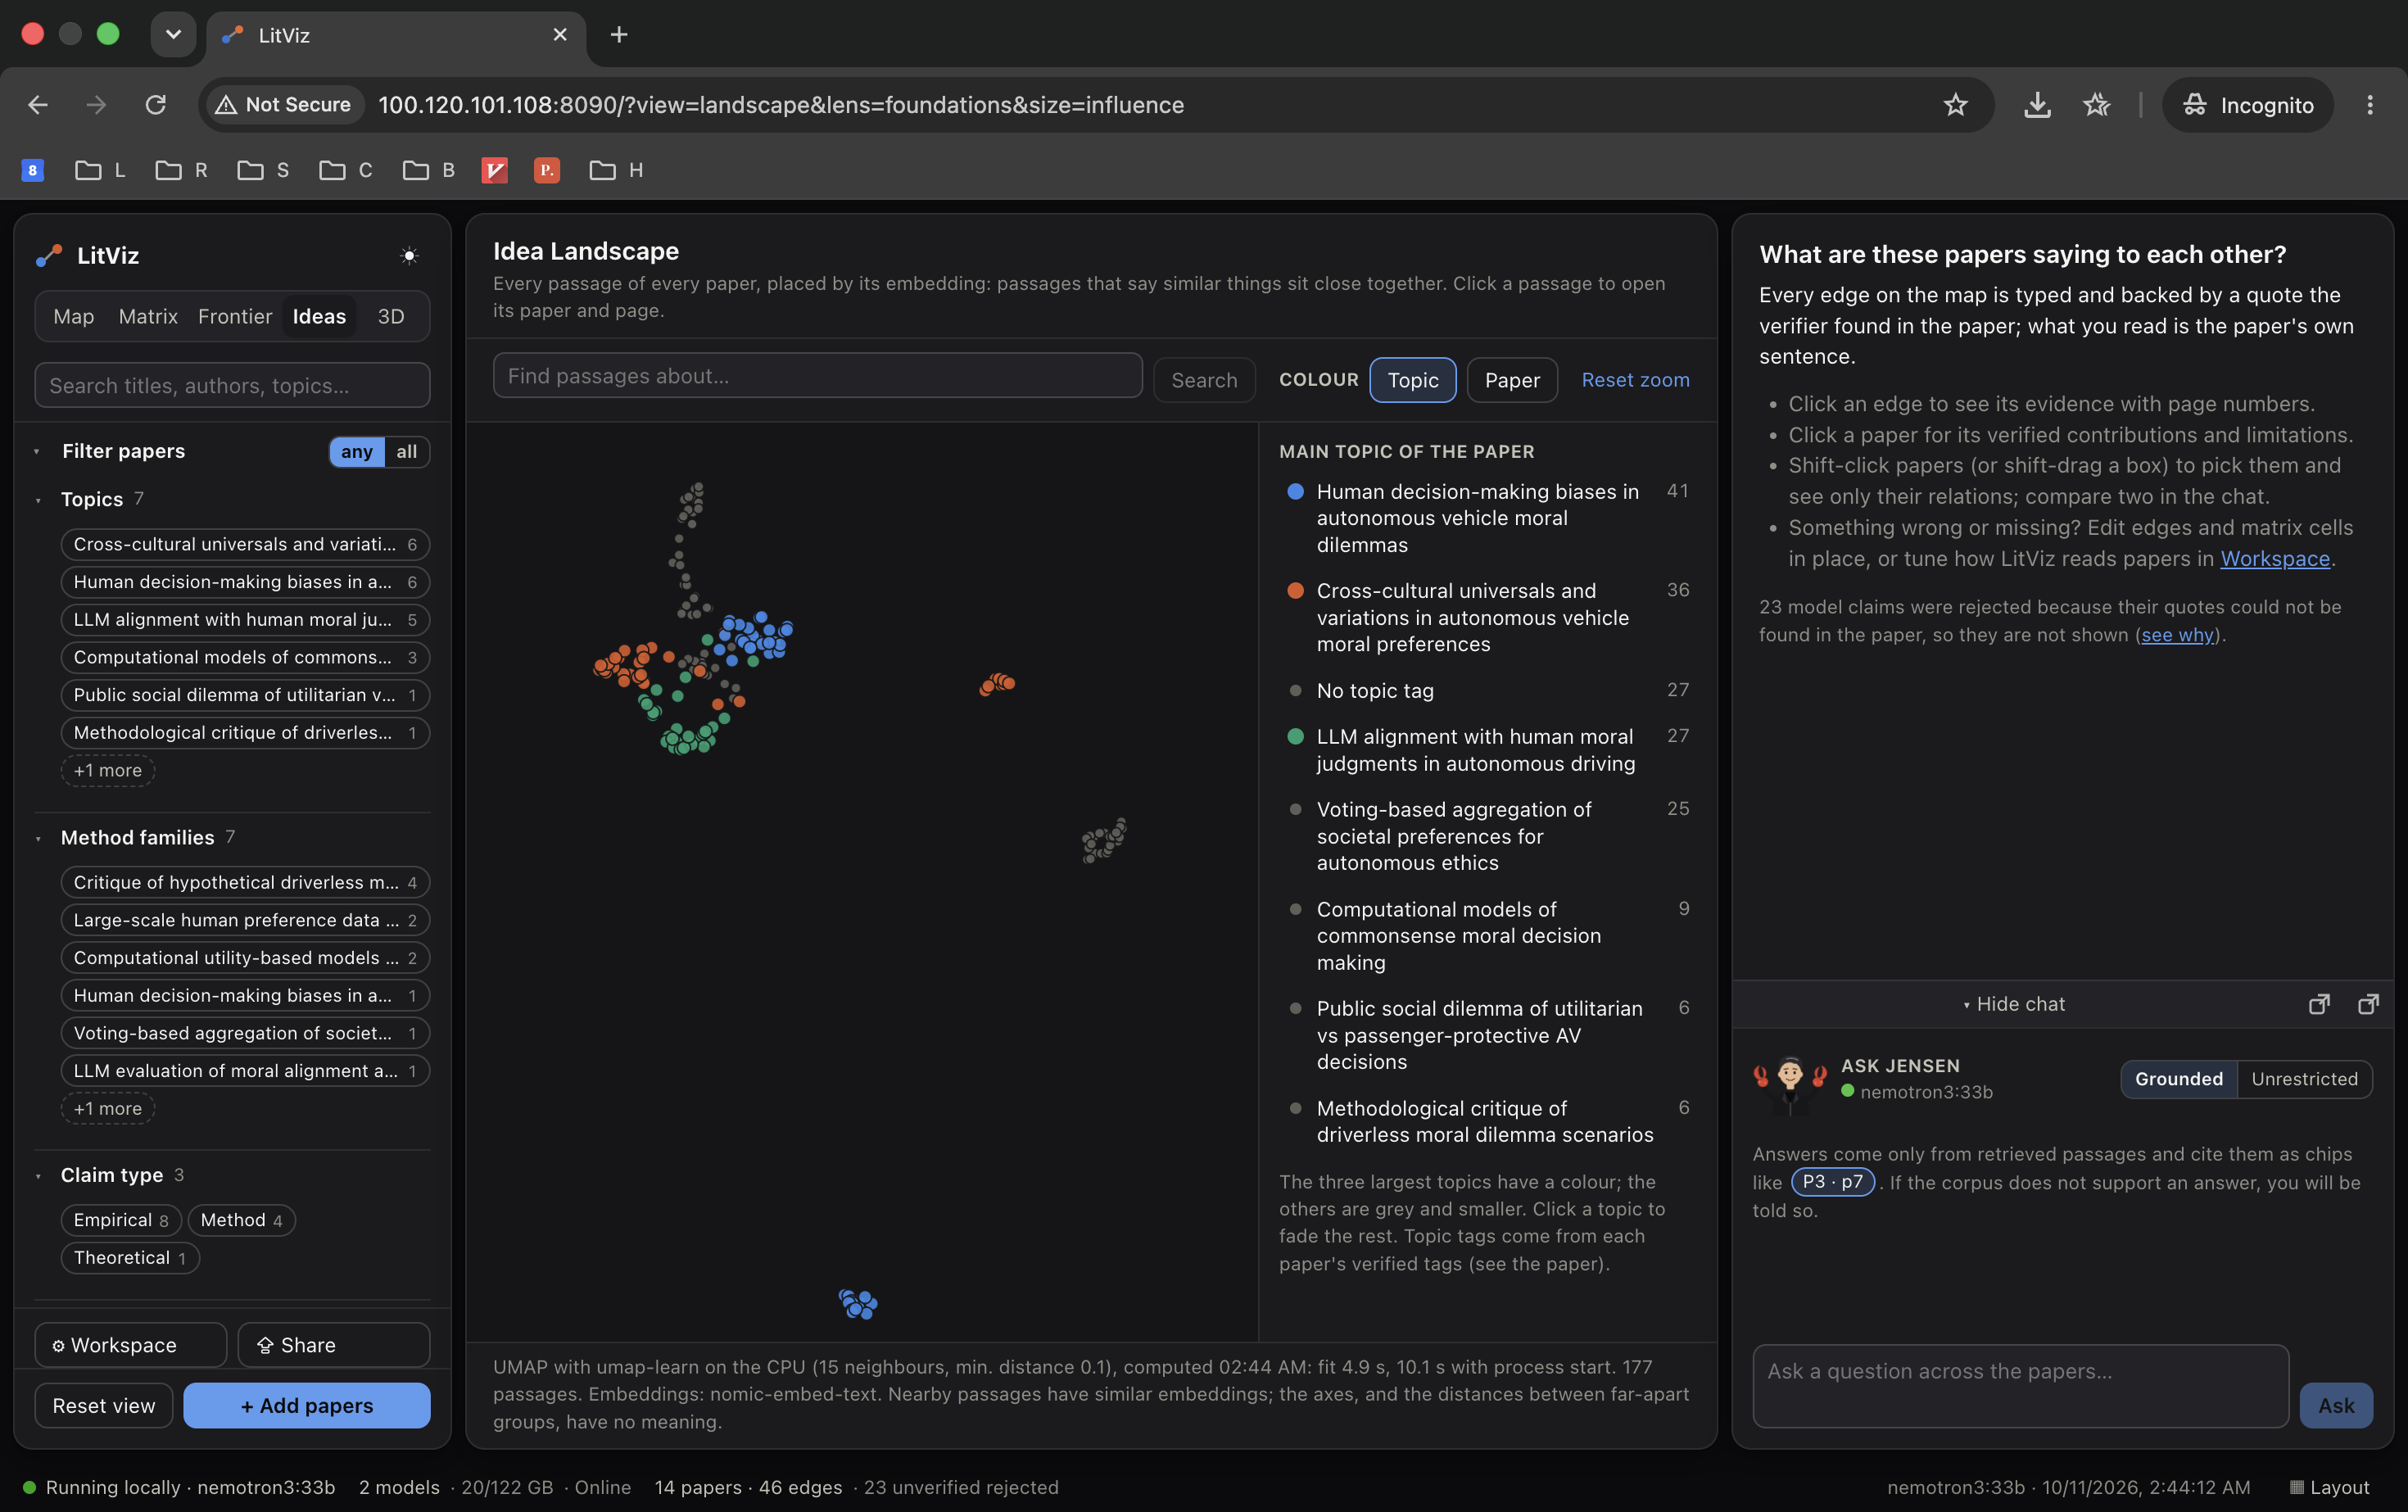
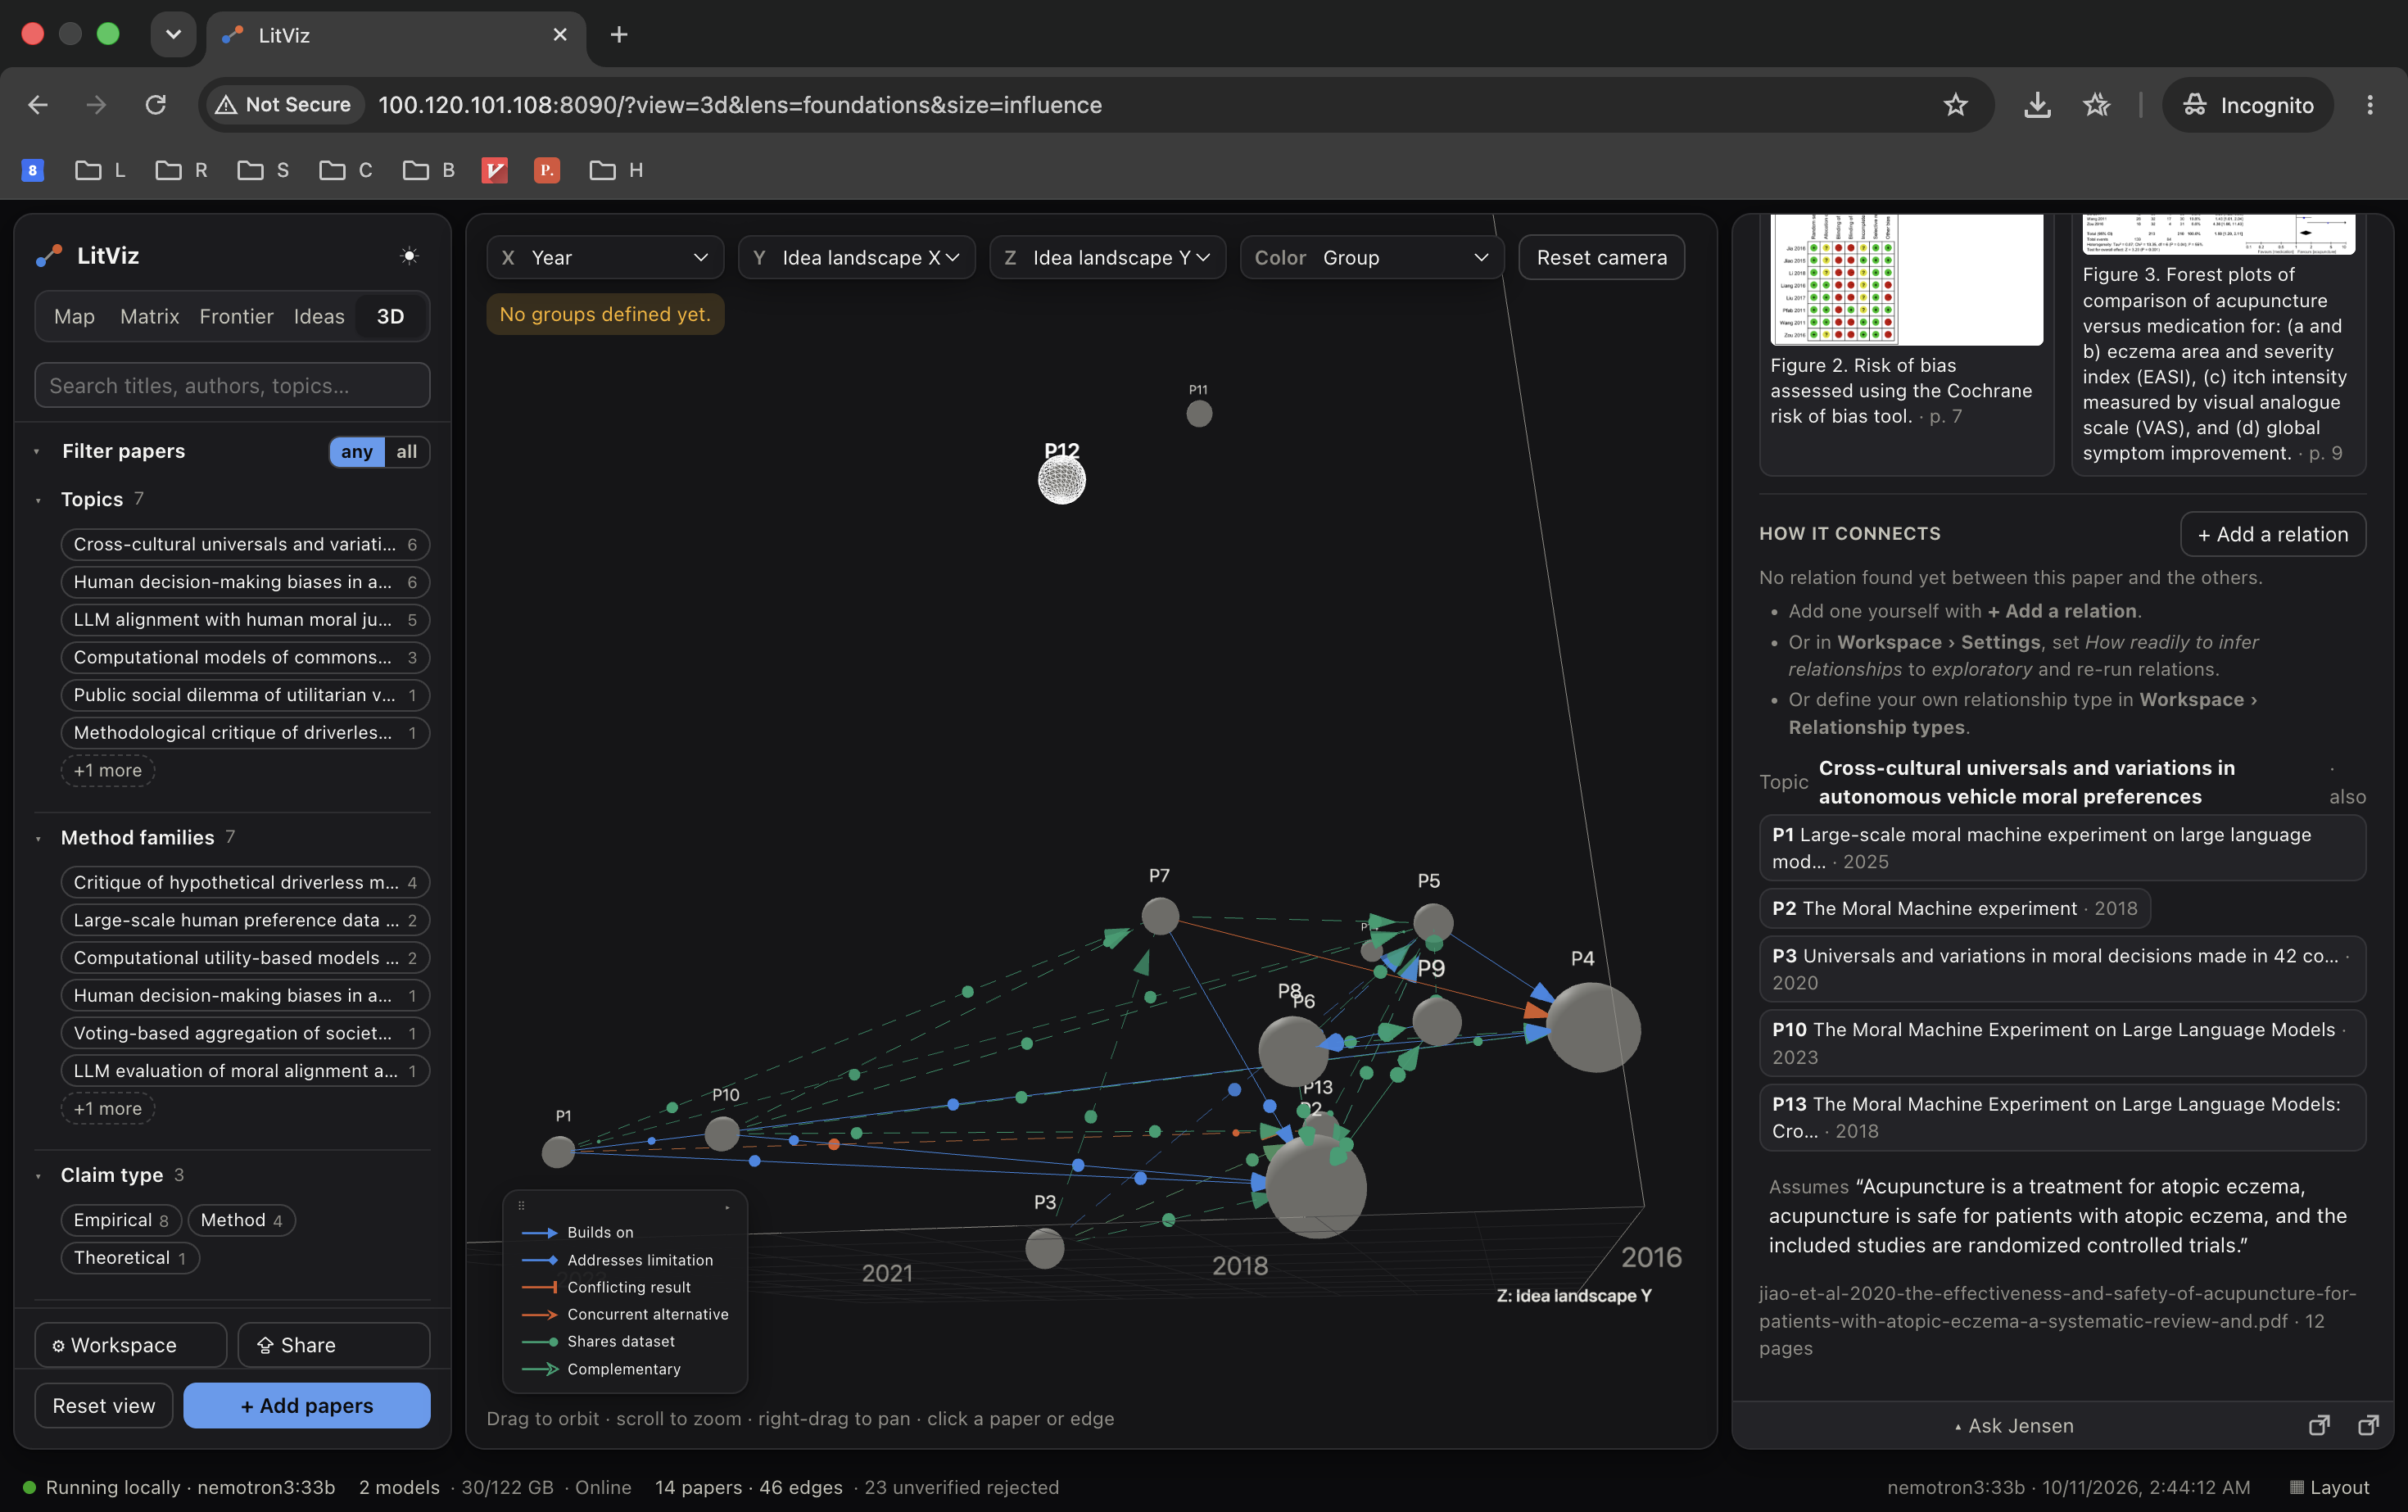
- Idea Landscape and 3D views. Every passage of every paper on one embedding map, plus a 3D view with axes you choose.
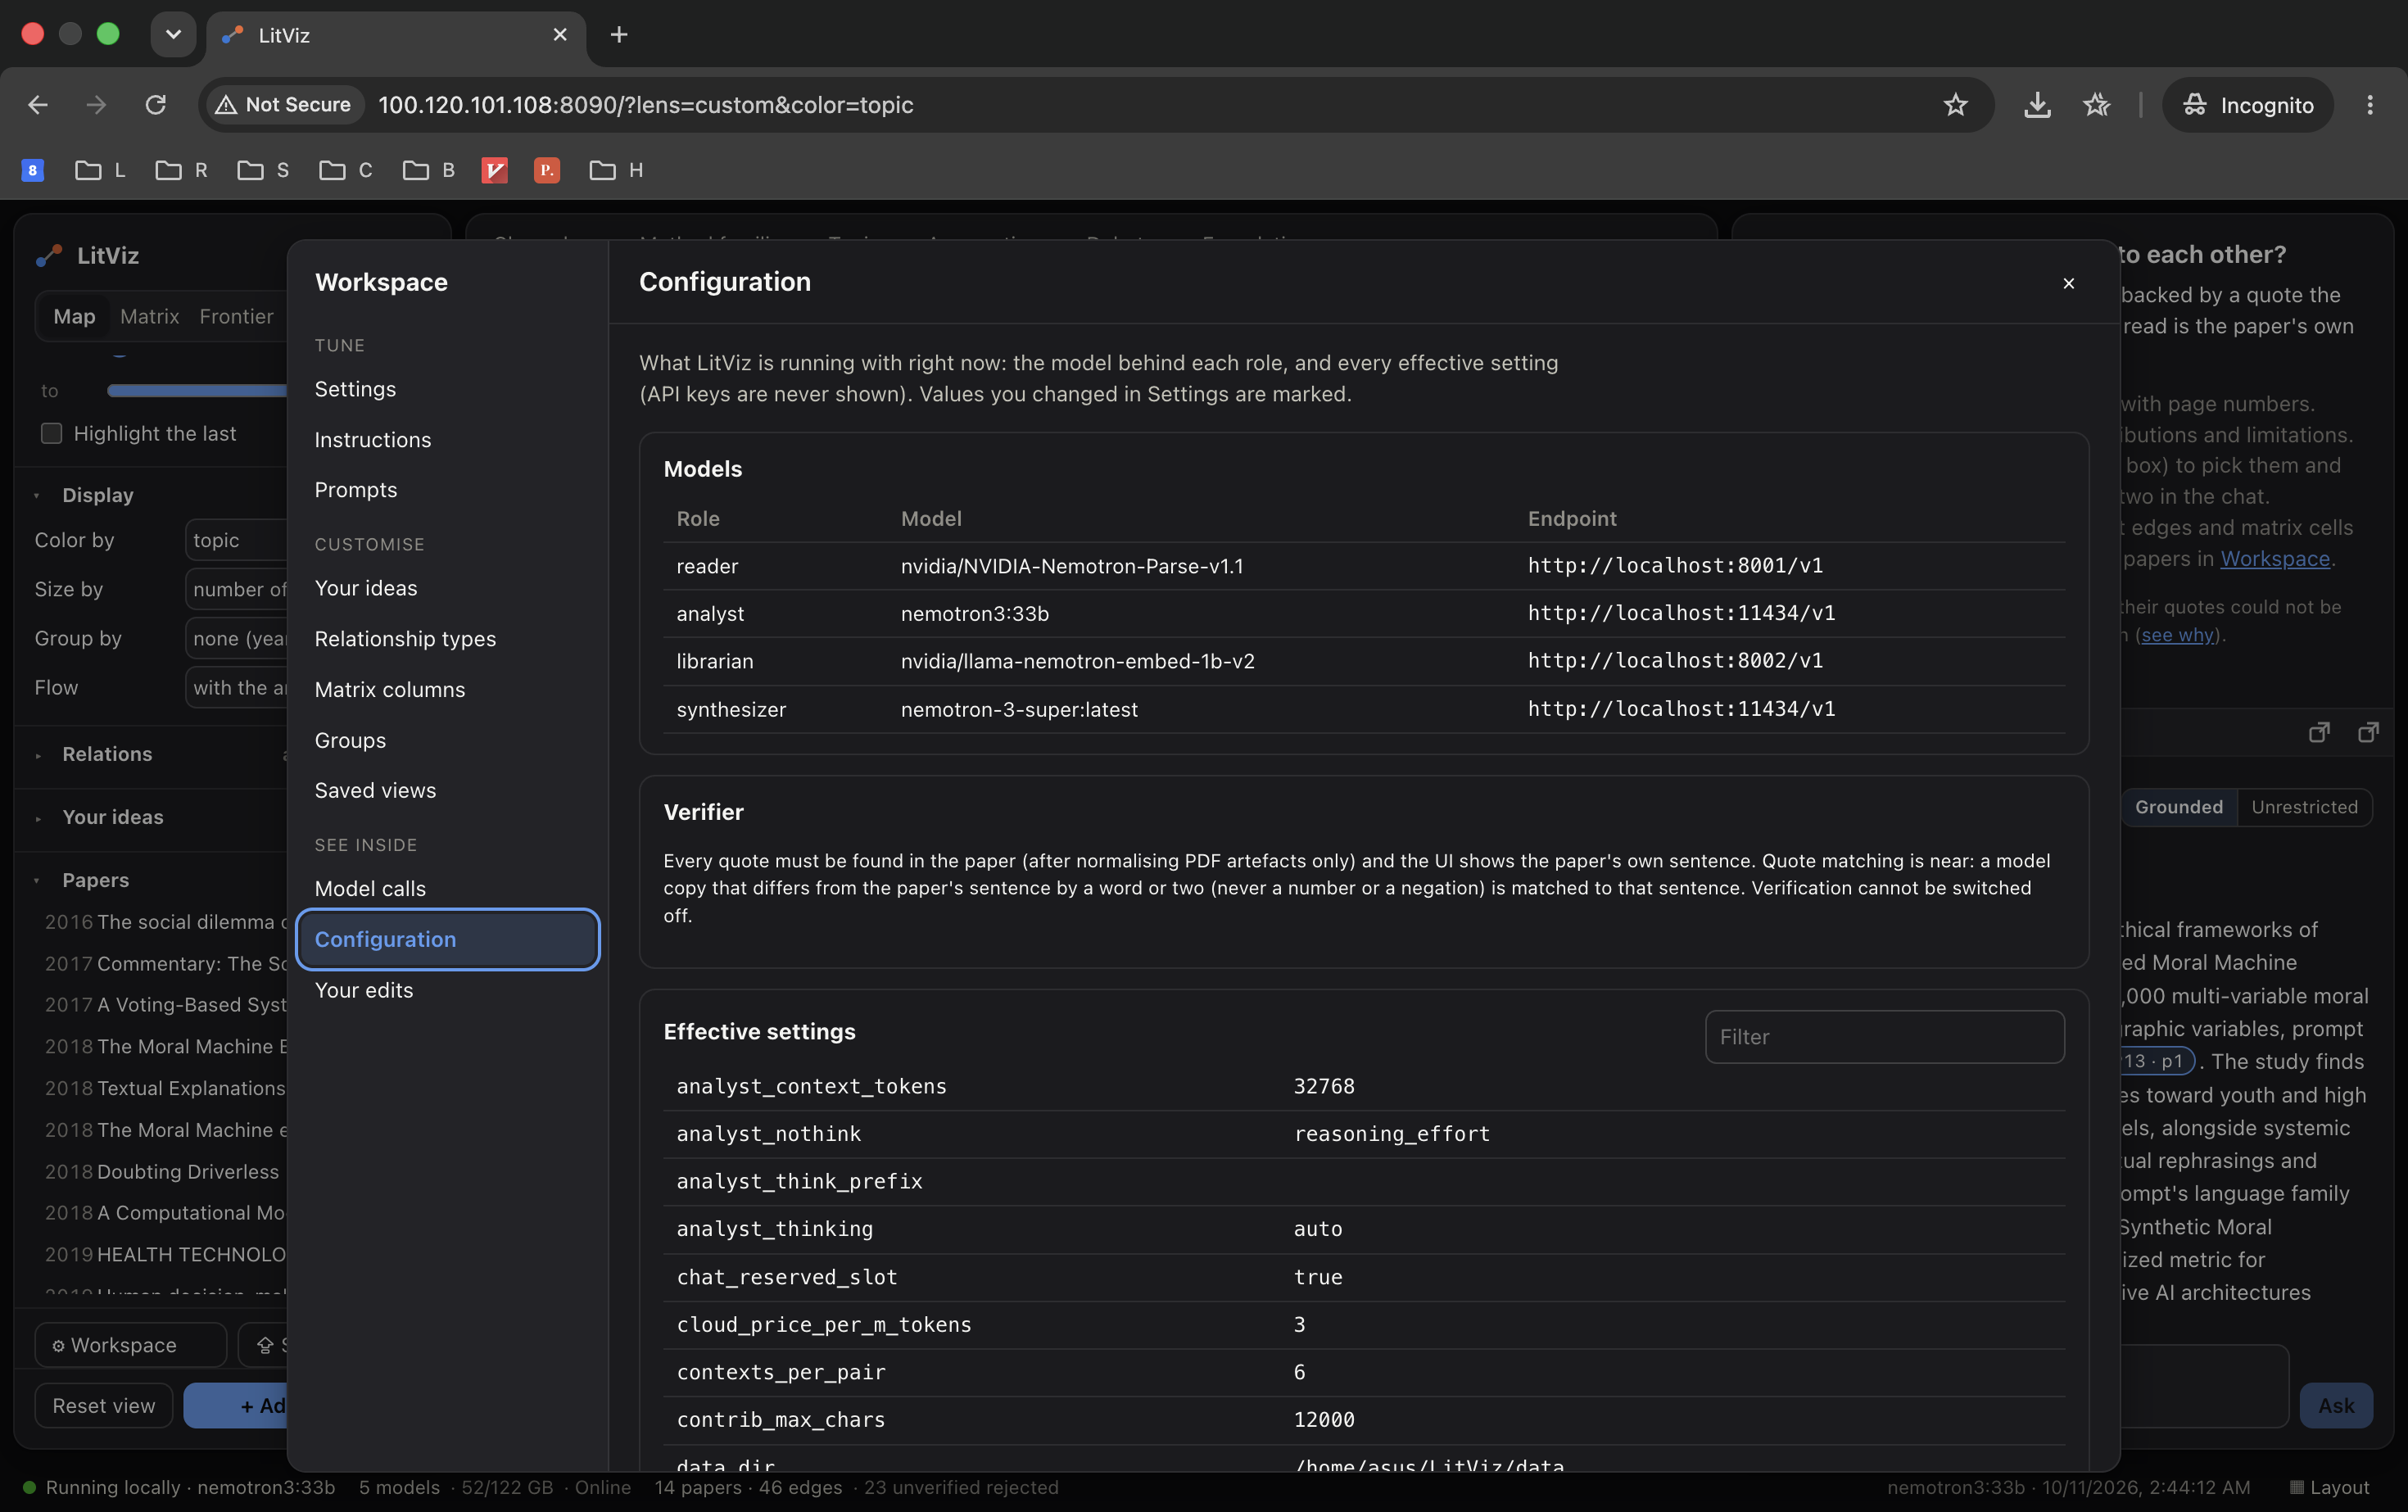
- A workspace you control. Tune how strict verification is, temperature, and token budgets; edit every prompt; add your own relationship types and matrix columns; inspect every model call and every rejected quote; and edit anything the model produced. Share the whole state as a single
.litvizfile. - Many formats. PDF, Markdown, plain text, HTML, Word, OpenDocument, LaTeX, RTF, and e-books.
- The GX10 Monitor. A second screen shows which model is doing what, the page being read with its element boxes, quotes verified or rejected as they happen, and "Data sent to the cloud: 0 bytes." Turn the Wi-Fi off and it flips to Offline ✓ while everything keeps working.
How we built it
LitViz runs on an ASUS Ascent GX10 (NVIDIA GB10, 128 GB unified memory) with a team of local NVIDIA models, each behind its own OpenAI-compatible endpoint:
- Reader: NVIDIA Nemotron Parse v1.1, served with vLLM, reads every page as an image and returns text, tables, LaTeX equations, figures, and bibliography entries with bounding boxes.
- Analyst: Nemotron 3.5 Lightning, preloaded on the GX10 and served by Ollama, handles contribution extraction, edge classification, tagging, widgets, and chat.
- Librarian: Llama Nemotron Embed 1B v2 and Llama Nemotron Rerank 1B v2, served with vLLM, handle embeddings and reranking.
A router sends each task to its model with its own concurrency limit, puts interactive requests ahead of ingest, and logs every call. Ingest is pipelined: the Reader reads paper N+1 while the Analyst extracts paper N and the Librarian embeds it.
The pipeline parses PDFs with PyMuPDF (column-aware, ~700-token chunks), extracts contributions, matches references to corpus papers with rapidfuzz, classifies each citing pair against a fixed relationship taxonomy, infers edges between similar papers that don't cite each other, and computes the open frontier. Retrieval fuses embedding similarity and BM25 by reciprocal rank, then reranks, with no vector database. Every stage is cached per paper, so a killed run resumes where it stopped.
The core is a verifier: every quote attached to an edge, matrix cell, tag, or chart must be found in the paper's text, with only typography artifacts normalized. A failed quote gets one retry with feedback, then is dropped and logged. Inferred edges need two verified quotes, one from each paper. The model never writes HTML or JavaScript; it fills JSON specs for a fixed widget library, validated by Pydantic on the backend and Zod on the frontend, with formulas evaluated only in a sandboxed math.js.
The backend is Python and FastAPI with server-sent events for live progress. The frontend is React and TypeScript with Vite, Cytoscape.js for the map, Three.js for 3D, KaTeX for equations, and UMAP for the Idea Landscape.
Challenges we ran into
- Small local models don't quote exactly. They copy a sentence with one word changed, quote a three-word phrase instead of a sentence, or drop the citation format in chat. A strict verifier threw away too much. We added near-match quoting (at least 90% similar, with the same numbers and negations, so a dropped "not" never passes), widening of short phrases to the full sentence they come from, a retry that spells out the allowed citations, and grounding modes (strict, lenient, open) that researchers control.
- Reasoning ate the token budget. Extraction calls ran out of tokens while the model was still thinking. We turned reasoning off for extraction, kept it only for synthesis, and made the app say when a reply ran out of tokens.
- Charts that never invent a number. Models often quoted a bare number, and many papers use ruled tables that PyMuPDF can't detect. Every plotted value is now bound to the exact row and column of a table it cites, and a number found only in prose is never paired with a label.
- Four model servers in one memory pool. On the GB10, CPU and GPU share 128 GB, and each vLLM server preallocates memory. We sized each server's share so the whole team stays resident, set up the NVIDIA container runtime, and moved LitViz to port 8080 so the models could keep 8000 to 8004.
- Scoping the product. We started out trying to replace every cloud tool at once. Talking to researchers helped us narrow LitViz to the part no tool does well: thinking through a corpus you already have, and finding the gaps.
Accomplishments that we're proud of
- A whole model team on one box. Nemotron Parse, Nemotron Lightning, and the Llama Nemotron embedder and reranker all run locally on the GX10.
- Provably offline. We verified the end-to-end demo (map, conflicting-edge evidence, matrix quote, cited chat, live upload) inside a loopback-only network namespace, with the browser making zero non-localhost requests.
- Nothing unverifiable is shown as fact. Every edge, matrix cell, tag, and chart value traces back to a verbatim passage, and interpretation is always labeled as LitViz's.
- Tested. A backend suite of over 300 tests covers the verifier, parsing, citations, the pipeline, chat, widgets, and the model router.
- Built for real users. We validated the problem with over 20 researchers during the hackathon, and their feedback shaped what we built.
What we learned
- The pain isn't finding papers; it's thinking through them. Retrieval is well served. Seeing how a corpus connects, and where it disagrees, is not.
- Privacy is a hard wall for some users, not a preference. For medical and NDA-bound researchers, a cloud tool isn't an option at any quality level.
- Local means honest trade-offs. A local model is weaker than frontier models, so transparency matters more: showing the source behind every inference is how users learn to trust it.
- Verification matters more than model size. With small local models, checking every quote against the page did more for trust than any prompt, and letting the model fill specs instead of writing code kept the interface safe.
What's next for LitViz
- Fine-tune from researcher feedback, locally. Every accept or reject in the UI is already saved with the prompt and the model's reply, and exported as training data for a LoRA run on the GX10. Corrections never have to leave the lab.
- Measure it. Run the GX10 benchmark (memory with every model resident, pages per minute, pipelined vs. sequential ingest) and edge precision and recall against hand-labeled gold edges.
- The Idea Landscape on the GPU with NVIDIA RAPIDS cuML.
- Calibrated confidence for each relationship type.
- Pilot with sensitive-data teams: put LitViz in front of medical research groups and NDA-bound industry labs.
Built With
- asus-ascent-gx10
- bm25
- fastapi
- llama-nemotron
- mathjs
- nemotron-parse
- numba
- numpy
- nvidia
- nvidia-gb10
- nvidia-nemotron
- pydantic
- pymupdf
- pytest
- python
- rapidfuzz
- rapids-cuml
- scikit-learn
- typescript
- umap-learn
- uvicorn
- zod


Log in or sign up for Devpost to join the conversation.