-
-
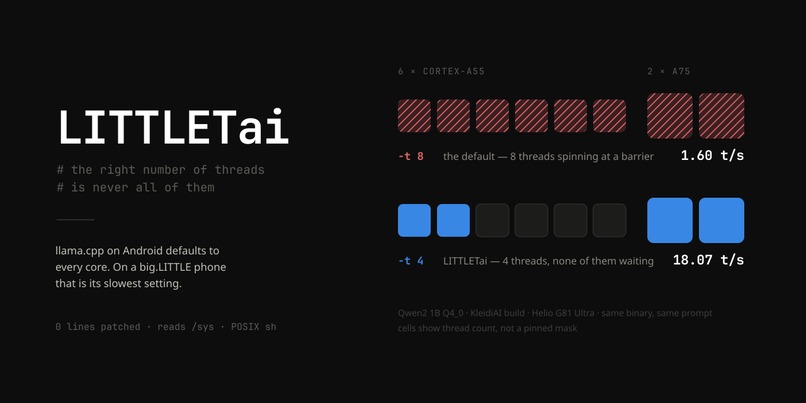
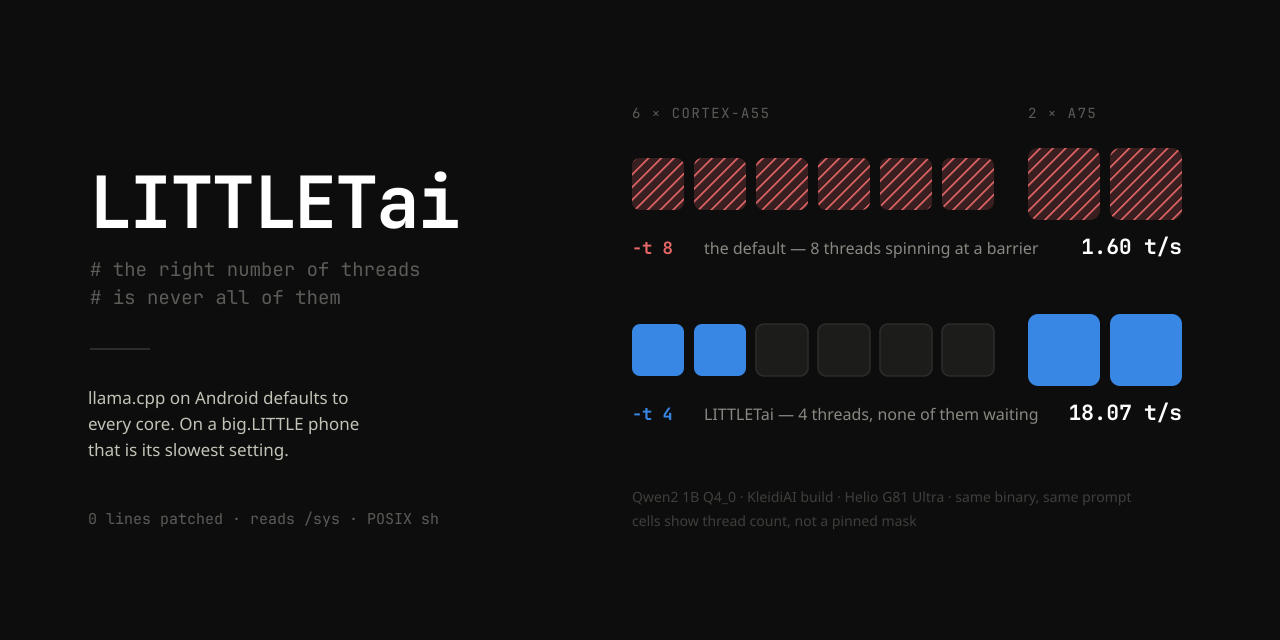
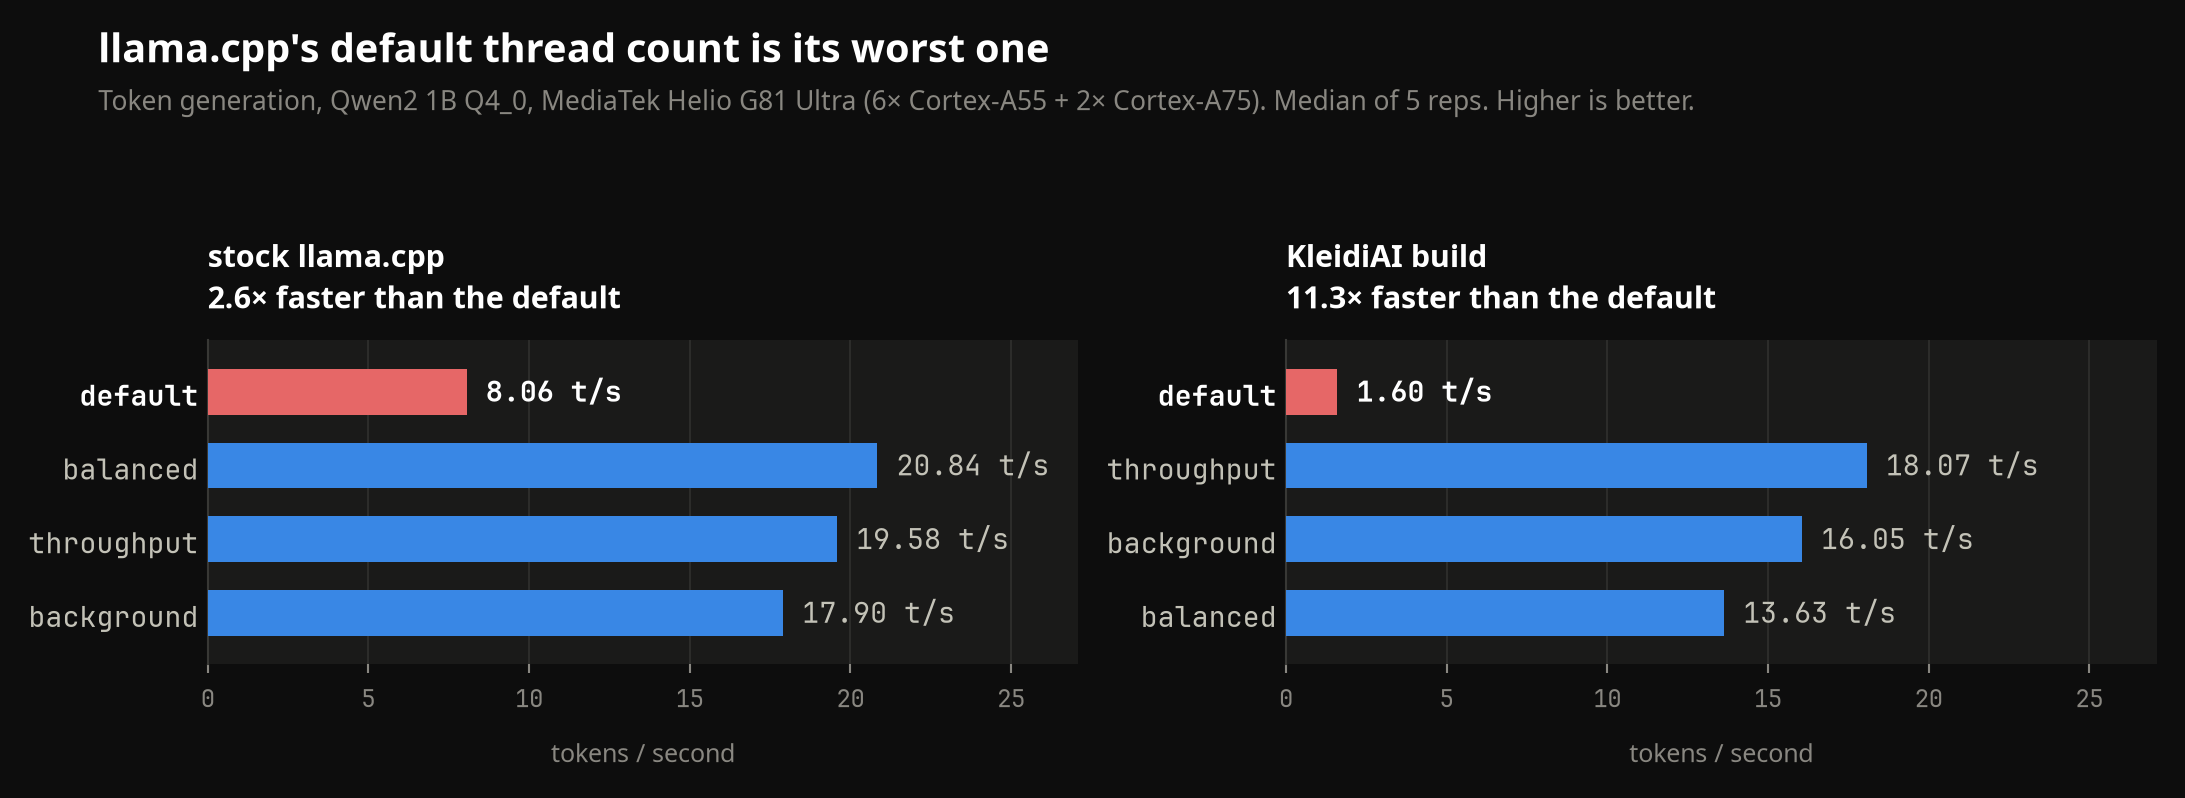
llama.cpp's default spins 8 threads on a big.LITTLE phone: 1.60 t/s. Four threads, none waiting: 18.07 t/s. Same binary, same prompt.
-
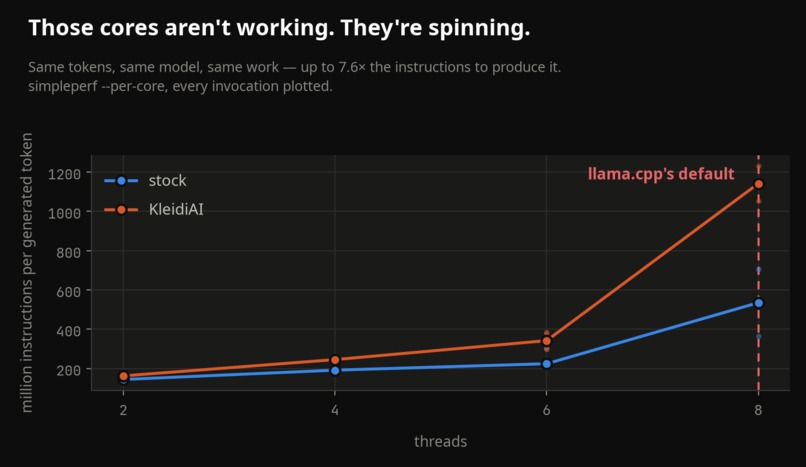
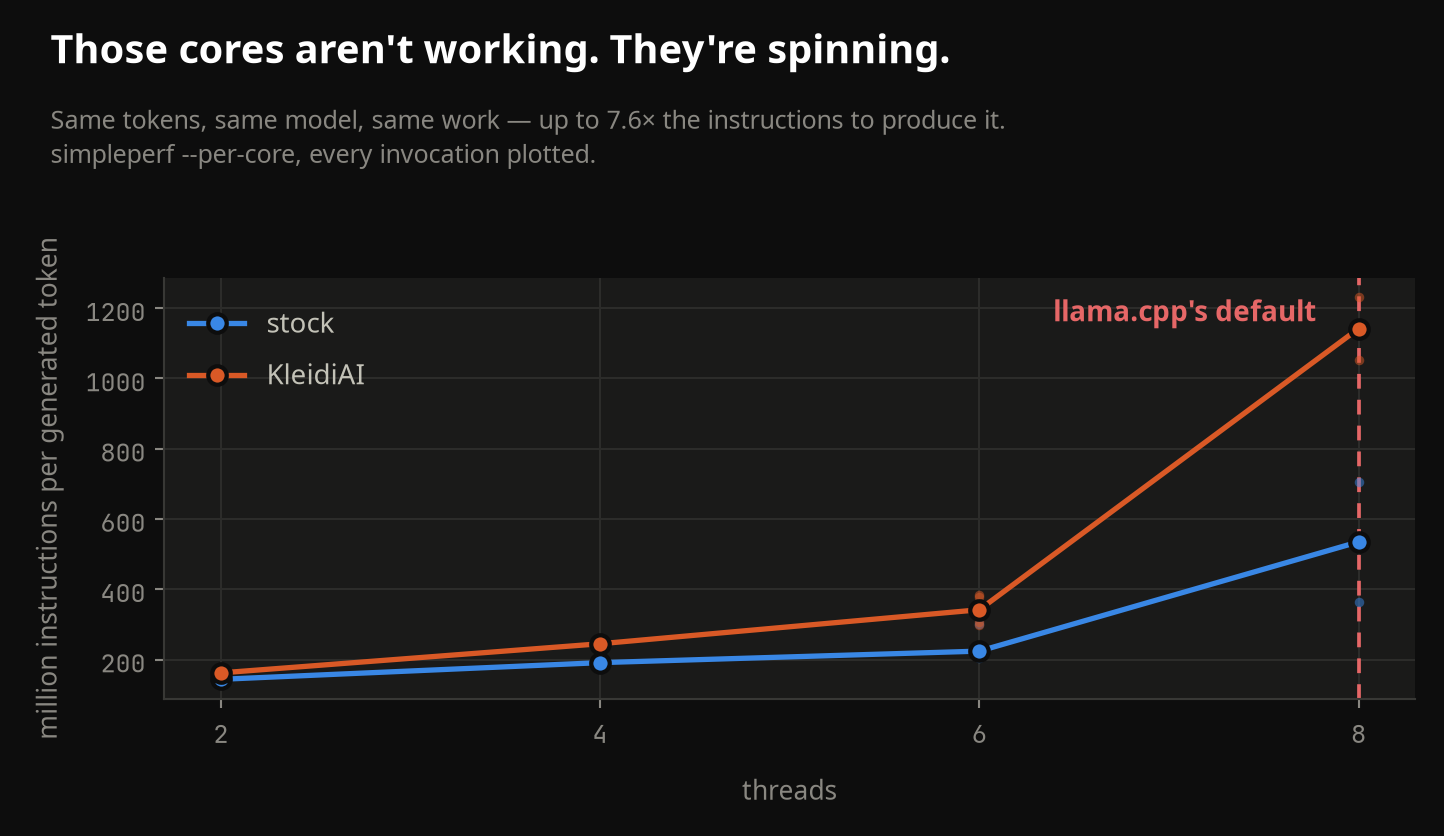
Instructions per token barely move from 2 to 6 threads, then climb at 8. Identical work, so the rise is pure barrier spin. PMU, every run.
-
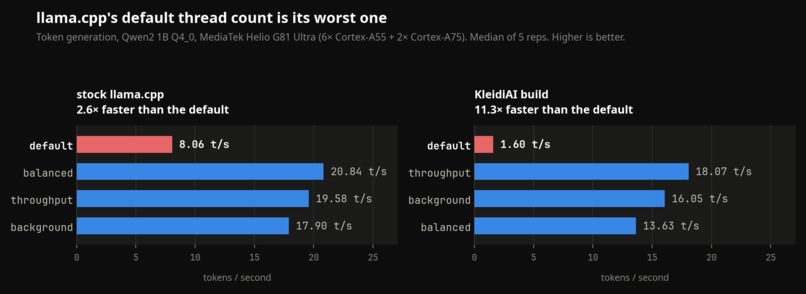
Token generation on a Helio G81 Ultra. The default (-t 8) is the slowest bar in both builds. Only the CPU flags differ. Shared x-scale.
-
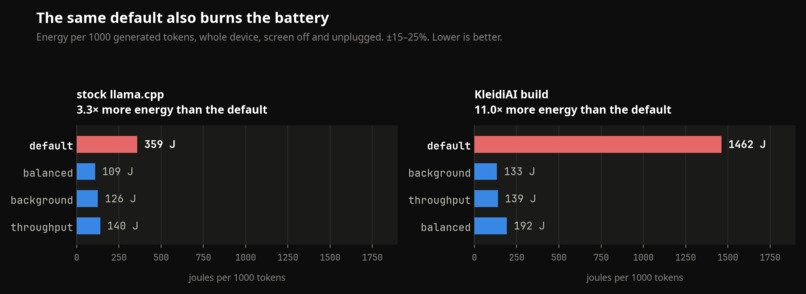
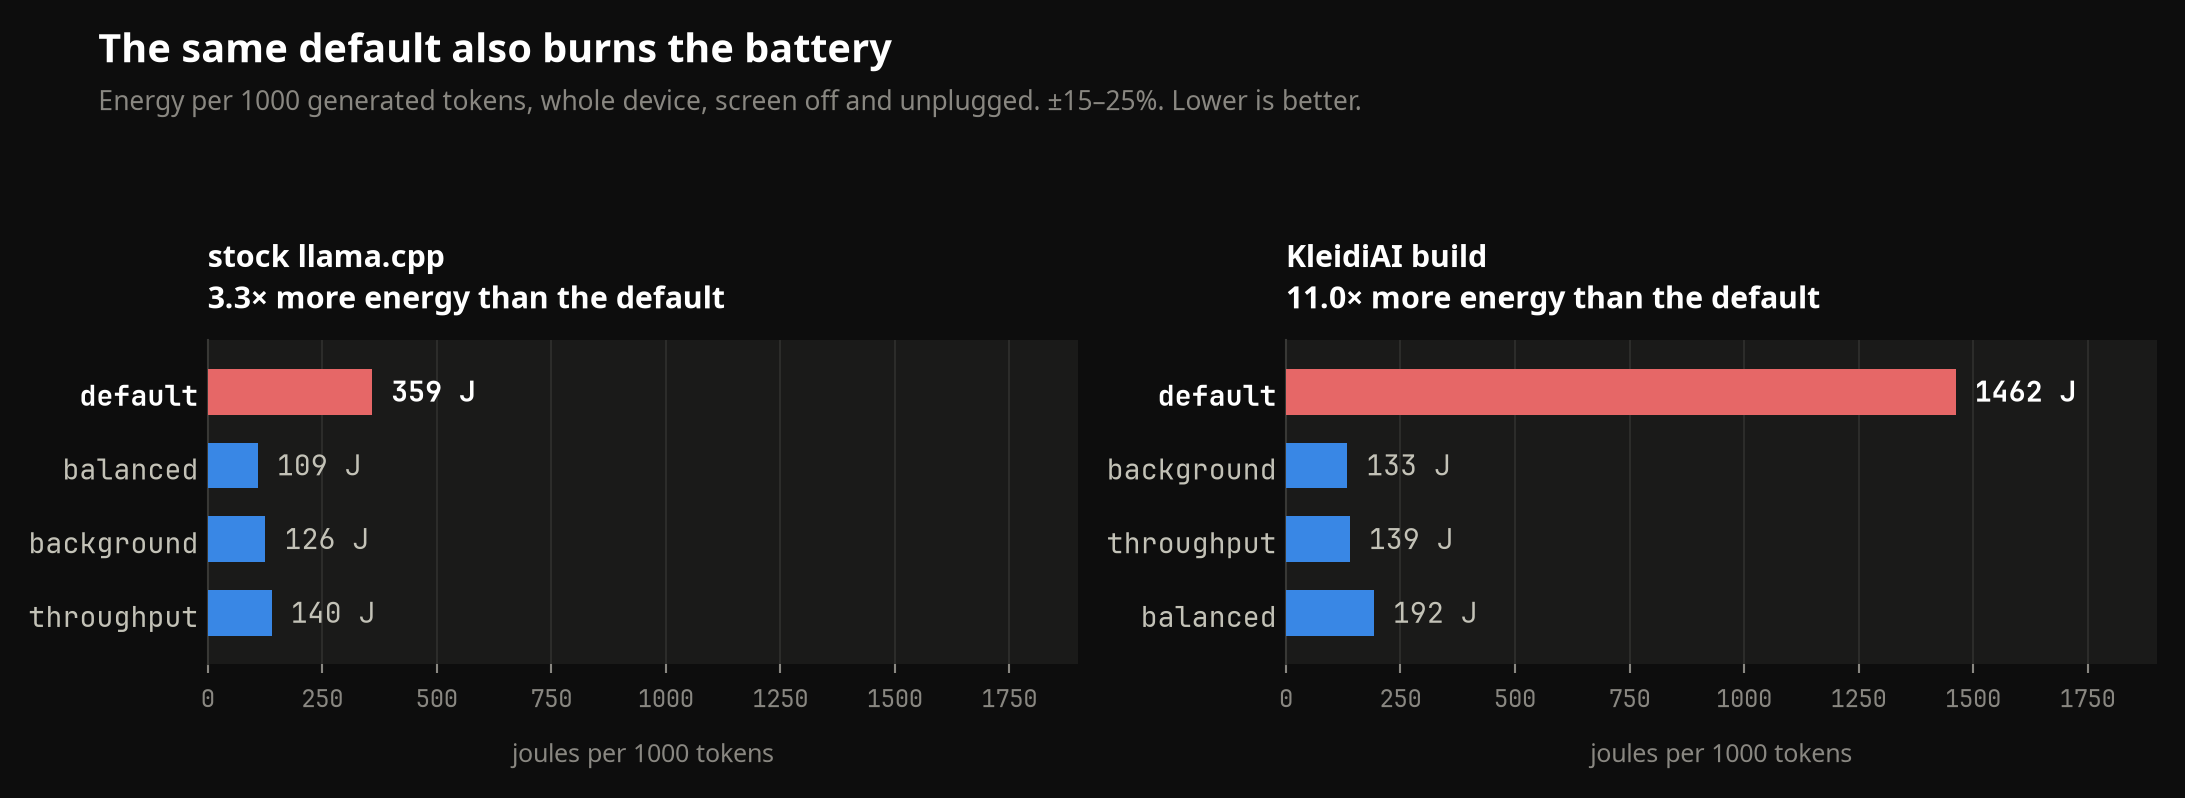
Energy per 1000 tokens: 359 J at the default on stock, 1462 J on KleidiAI, against 109-140 and 133-192 for the presets. Whole device.
-
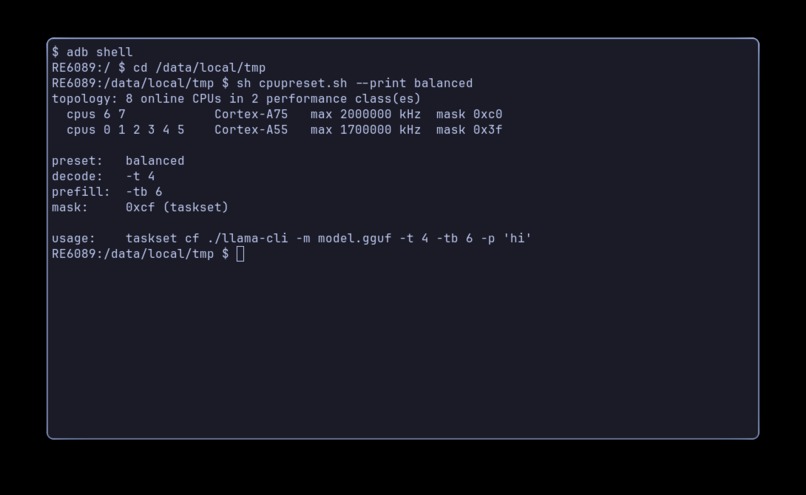
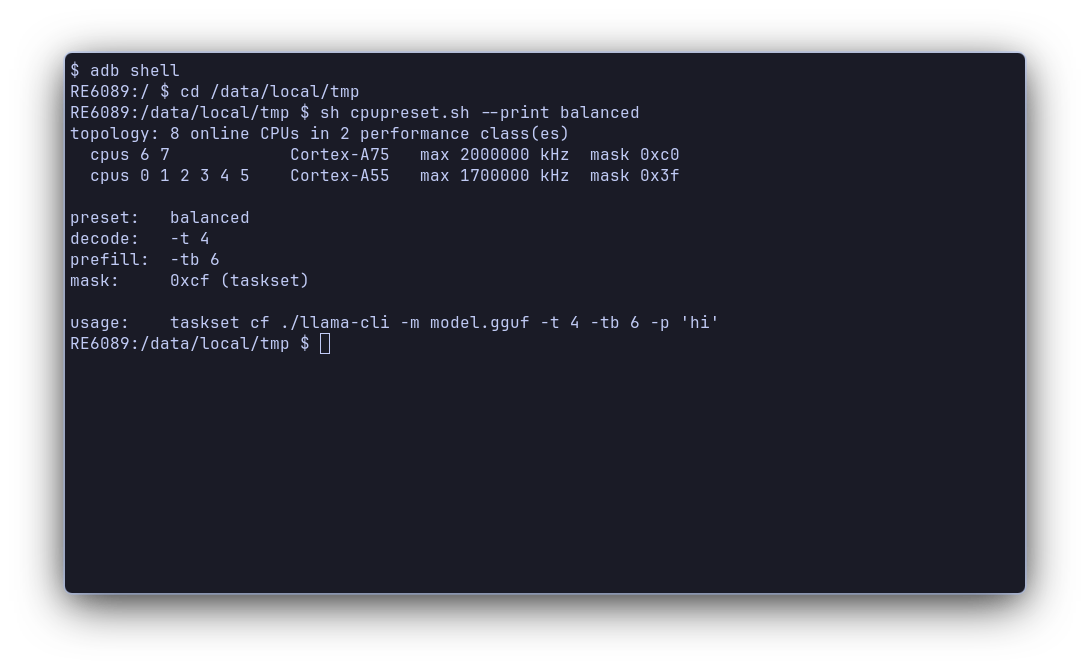
No model loaded, nothing patched. cpupreset.sh reads /sys, groups cores by performance class, and prints the flags plus its reasoning.
-
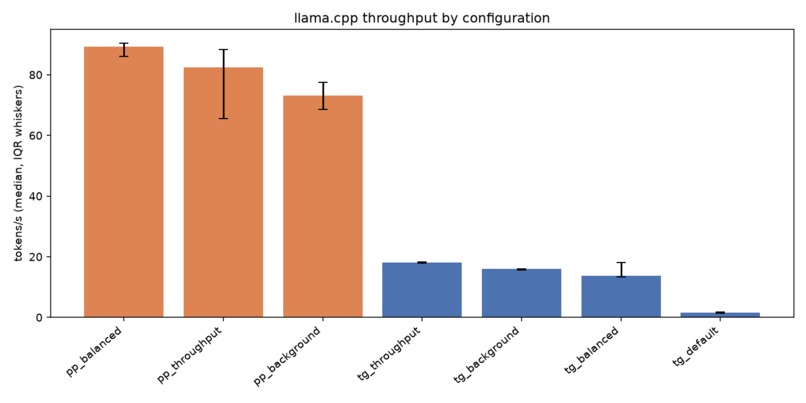
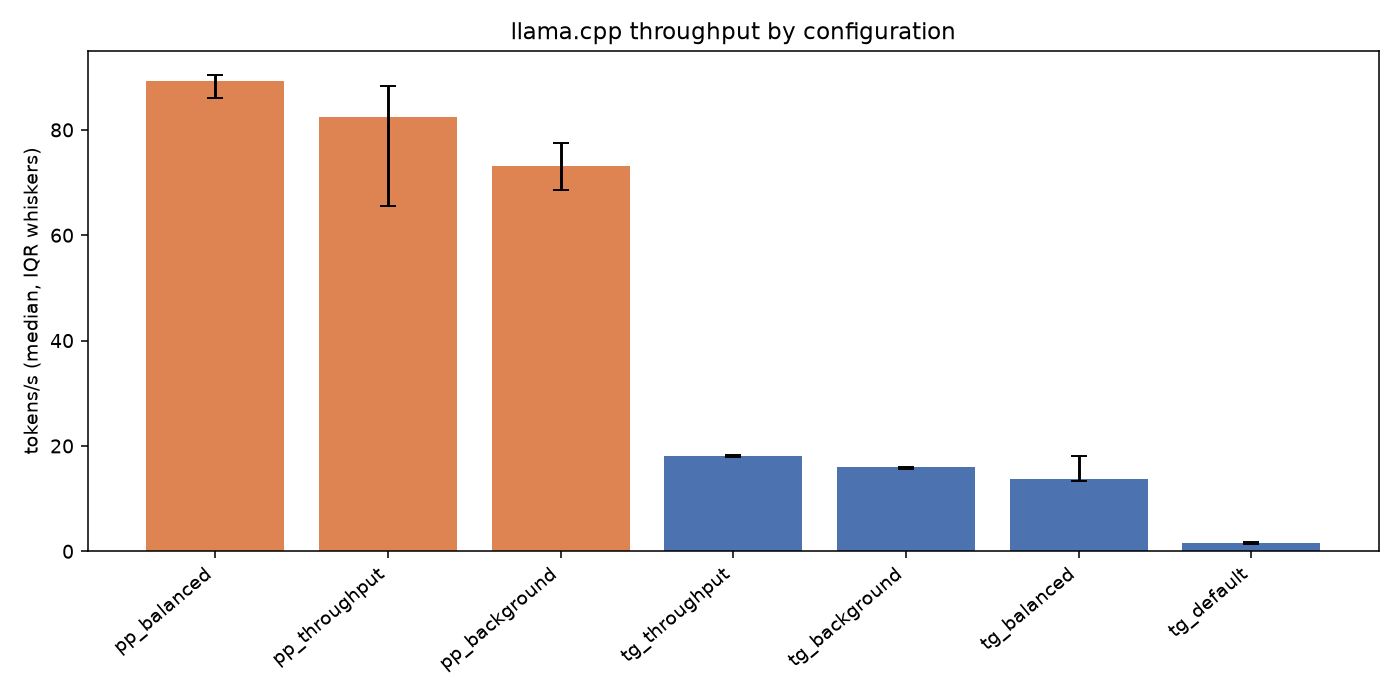
Raw harness output, prefill and decode together. Good for reading a run, wrong as a headline - hence the decode-only hero charts.
-
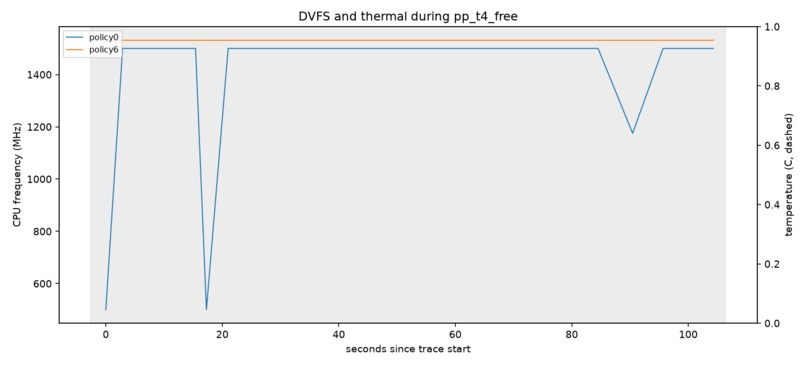
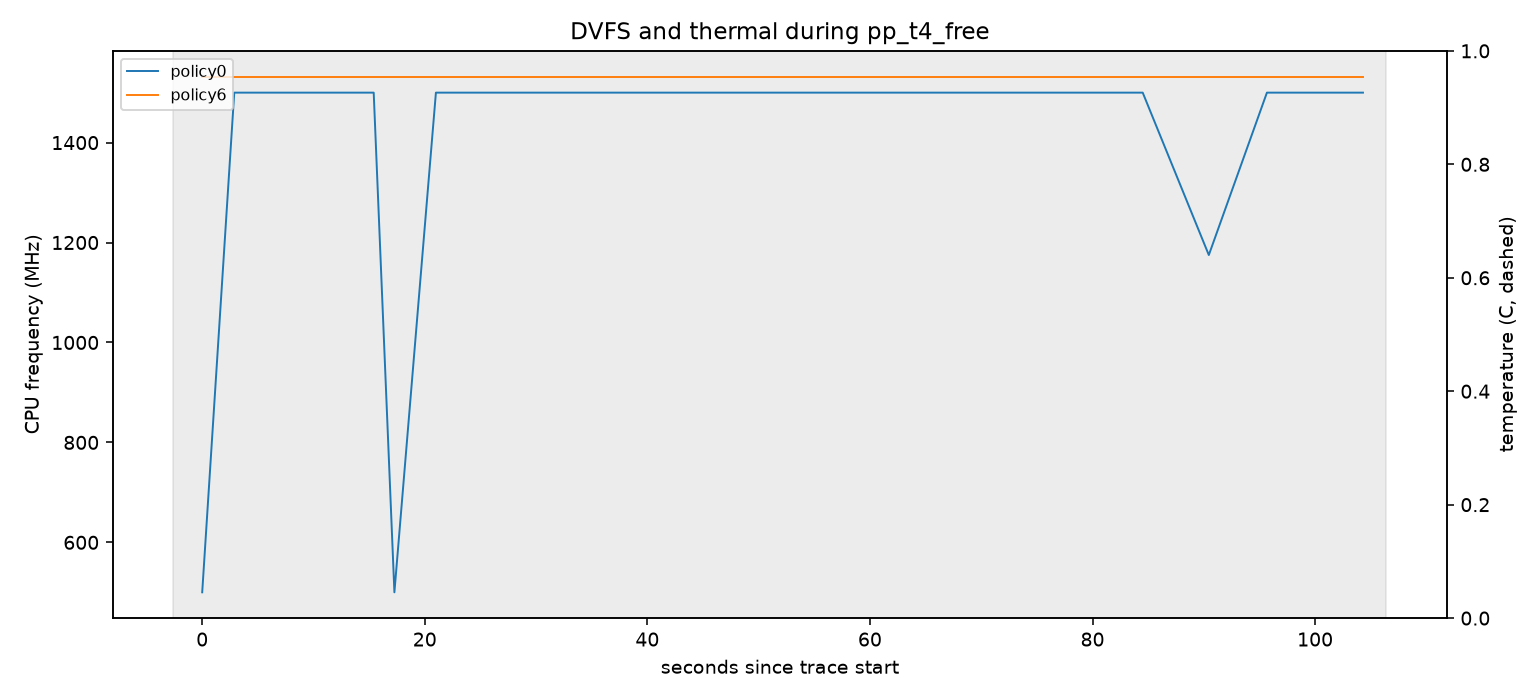
Per-arm telemetry: CPU frequency and temperature through every benchmark. This is how throttled runs get flagged rather than averaged in.
Track: Mobile AI. Fully on-device inference on an Arm-powered smartphone (MediaTek Helio G81 Ultra, 6× Cortex-A55 + 2× Cortex-A75), optimised for the constraints the track names: latency and battery. Decode is 2.2–11.3× faster and uses 2.6–11× less energy per token, measured on retail hardware with no root.
Not Cloud AI, even though that track lists llama.cpp: the entire finding is about heterogeneous CPUs. Graviton, Cobalt and Axion are homogeneous Neoverse parts with no big.LITTLE split, so the bug this fixes cannot occur there. It is specific to the client devices in the Mobile AI track.
Inspiration
The people who'd benefit most from on-device AI run the phones nobody optimises for: mid-range Helio and Snapdragon handsets, not flagships with NPUs and SME2. On-device LLMs are supposed to make AI private and free at the point of use, and right now that promise is worth least to whoever can afford it least.
So I picked up a retail phone with a MediaTek Helio G81 Ultra and started measuring llama.cpp on it, expecting to write some NEON kernels.
I never got to the kernels. The first thing I measured was so wrong that it ate the whole project.
What it does
LITTLETai reads your phone's CPU topology out of /sys and tells llama.cpp
how to use it. One shell script, no patch to llama.cpp, no recompilation, no
root.
sh cpupreset.sh balanced -- ./llama-cli -m model.gguf -p "hello"
On my test phone, generating tokens with Qwen2 1B Q4_0:
| stock llama.cpp | KleidiAI build | |
|---|---|---|
default (-t 8) |
8.06 t/s · 359 J/1k tok | 1.60 t/s · 1462 J/1k tok |
| any LITTLETai preset | 17.9–20.8 t/s | 13.6–18.1 t/s |
| 2.2–2.6× faster | 8.5–11.3× faster | |
| 2.6–3.3× less energy | 7.6–11× less energy |
Same model, same binary, same prompt. Only the CPU flags differ.
The bug. llama.cpp picks your default thread count in
common_cpu_get_num_math(). It does have a heuristic for CPUs that mix fast and
slow cores, but only for Intel:
#if defined(__x86_64__) && defined(__linux__) && !defined(__ANDROID__)
It finds the slow cores with CPUID, which Arm doesn't have, so there is no Arm
version of it. Your phone falls back to counting cores and uses all of them.
big.LITTLE is the most widely deployed heterogeneous CPU design there is, and
llama.cpp has nothing for it.
Issue #7176 reported this
in 2024 on an Orange Pi 5: 6.93 t/s down to 3.81, fixed by passing -t 4. It
was closed as not planned.
I expected that to cost 10-20%. Then I counted instructions with simpleperf.
Retired instructions per generated token, summed across all cores:
| threads | stock | KleidiAI |
|---|---|---|
| 2 | 142–144 M | 161–167 M |
| 4 | 175–198 M | 236–249 M |
| 6 | 205–302 M | 299–383 M |
| 8 — the default | 365–705 M | 1053–1231 M |
Same tokens, up to 7.6× the instructions to make them. Those cores aren't
working, they're spinning: ggml_barrier() waits with ggml_thread_cpu_relax()
and never yields, and --poll doesn't gate it. Every thread burns cycles
waiting for the slowest one, and using every core leaves nothing spare for
anything else.
Three presets, by intent rather than by number:
| preset | for | resolves to |
|---|---|---|
throughput |
no mask, tolerates jitter | -t 4 -tb 6 |
balanced |
the default choice; leaves cores for the UI | taskset cf -t 4 -tb 6 |
background |
big cores stay free for the rest of the phone | taskset 3f -t 4 -tb 6 |
On decode the three are within noise of each other, so I don't claim a winner
among them. balanced is the recommendation because it wins prefill on both
builds, by 12.1% on stock and 8.3% on KleidiAI.
The thread count isn't a constant. For \(C\) online cores it's
$$T_{\text{decode}} = \operatorname{clamp}\left(\left\lfloor C/2 \right\rfloor,\ 2,\ 6\right)$$
which is why the same script gives -t 4 on the 8-core Orange Pi in #7176, the
value that reporter found by hand, without being told anything about it.
It also emits settings for ONNX Runtime, TFLite and OpenMP, because their thread
pools spin at barriers the same way. I haven't benchmarked those, and the tool
prints INFERRED on them rather than pretending otherwise.
How we built it
I built a benchmark harness first, because I had to.
The phone runs the benchmark loop itself. The laptop generates a seeded plan,
receives results over TCP, and analyses them. adb copies files once, starts the
runner detached, and is then free to die — which it does, roughly every 3-4 hours
over wireless.
What the harness insists on, and why:
- Randomised, interleaved, block-structured runs, so thermal drift can't line up with one config
- A thermal gate before every arm — nothing measures until the phone is back under temperature
- Named failure states. An arm ends as a measurement or as a reason
(
thermal_gate_timeout,bench_json_missing,suspend_during_measurement), never as a plausible-looking number - Energy from the fuel gauge, trapezoidally integrated, screen off, unplugged, airplane mode
- PMU counters through
simpleperf --per-corewith multiplexing detection, because silently scaled estimates look exactly like real counts - The harness measures its own overhead. A control pass showed the sampler
costing −8.3% at 6 threads. That's why
balancedreserves cores: if one shell loop costs 8%, so does whatever the user is doing on their phone
238 benchmark arms across five passes, roughly 24 hours of measurement. Everything is seeded: the two 97-arm matrices regenerate byte-for-byte.
The tool itself is POSIX shell, written for toybox because that's what Android ships — no Python, no bash, no busybox, no coreutils outside the ROM.
Challenges we ran into
Most of this project was failures. The interesting ones:
The harness lied to me for a whole run. Wireless adb dropped mid-benchmark,
and every adb call went through a helper that returned an empty string on
failure. boottime() became 0.0, parsers returned nothing, and the harness
cheerfully wrote three all-zero rows and kept going. It didn't crash — it
produced plausible-looking data. That's the failure mode that taught me
everything else: I rewrote the whole thing so the phone owns the loop and every
arm ends in a named state.
Every thermal zone was denied. SELinux gated all 37 zones for shell uid, so
I fell back to parsing dumpsys thermalservice, and got that wrong twice: the
"Cached temperatures" block holds stale values that poison the max, and mValue
is in 0.1 °C, so my thermal gate briefly reported 3.7 °C.
taskset vs -C. llama.cpp's own --cpu-mask was silently ignored on
Android until PR #26838 — ggml-cpu.c guarded the affinity code with
#elif defined(__gnu_linux__), which Clang doesn't define for Android triples,
so the mask hit a stub. Measured: -C 0x03 --cpu-strict 1 left 99.5% of cycles
on the big cores; taskset 03 left 0.1%. A flag that accepts your input and does
nothing is worse than no flag.
toybox is not coreutils. Its nc exits the moment stdin hits EOF and drops
the peer's reply, and -q doesn't change that, so my upload acks were never seen
and the outbox grew forever while every arm was in fact being delivered. Its sh
does 32-bit signed arithmetic, so $(( 949244217 + 6491805586 )) wraps to
-1148884789, which is an educational thing to find in a cycle count.
Termux is disqualified as a benchmark host. The same binary measured
11.58 t/s in Termux and 13.96 t/s from /data/local/tmp — 21% from cgroup
placement alone, and a child inherits its parent's cgroup.
My own tool was wrong twice, and the tests caught both. First version grouped
CPUs by cpufreq policy and reported my 4-core laptop as four clusters, because
plenty of kernels expose one policy per CPU. Then, on a part where both clusters
cap at the same GHz, ties fell back to sysfs order — which puts cpu0 first, a
little core on every Arm SoC, inverting every preset.
And my own rule didn't survive validation. I derived "prefill scales to all cores" from early data, then the validation run contradicted it. That data had been collected while the phone was clamped to 850 MHz, half its rated clock. I ran a dedicated sweep, changed the rule, and left the contradiction in the docs rather than quietly editing the constant to match.
Accomplishments that we're proud of
That the numbers hold up. I re-audited every published figure against the raw
JSON before submitting and found one of my own claims overstated — I'd dropped
the slowest preset from a range — so the headline got smaller and harder to
knock over. PRESETS.md traces every constant in the tool back to the specific
benchmark arm it came from, including the rules that didn't survive.
That it generalises without a fleet. The rules are a function of cluster and
core counts and frequency ceilings, so 53 assertions check them against 12
synthetic CPU topologies through a fake /sys tree, with nothing plugged in.
209 assertions in total, none of which need a phone.
And honestly: that a 2.2–11× win was sitting in a default nobody had measured on the most common CPU architecture in the world.
What we learned
How ggml actually executes a graph — the thread pool, the barrier, why --poll
doesn't help the thing you'd assume it helps. Why prefill and decode want
opposite hardware (GEMM scales with cores, GEMV is memory-bound and doesn't).
That KleidiAI's published wins depend on i8mm and SME2, and on ARMv8.2-A
silicon without them its repacked decode path loses — so "use the optimised
library" is a trade, not a free upgrade.
Beyond the code: how to design an experiment that can survive its own apparatus. Randomisation, blocking, control arms, measuring your instrument's overhead, and refusing to report a number you can't defend. I learned that one by producing garbage first.
Also a lot of CMake, cross-toolchains, NDK builds, Perfetto configs that have to live in exactly one directory, and PMU event names that only exist on one microarchitecture.
What's next for LITTLETai
The current rules come from one SoC. The obvious next step is a device
profile — discover topology, PMU capability tier, thermal zone and energy
calibration at runtime, and generate the whole benchmark matrix from that rather
than from constants. That plan is already written up in the repo
(GENERALIZATION_PLAN.md) with the gap analysis behind it.
After that: benchmark other engines properly instead of inferring. ONNX Runtime, TFLite/XNNPACK, MNN and ncnn all have spin-waiting thread pools and core-count defaults, and I'd bet the same bug is sitting in all of them.
Longer term I want to stop working around the scheduler and get into it — a scheduling backend that's aware of big.LITTLE rather than a preset that avoids the problem. That's where I think this actually goes, because the binding constraint on mobile AI isn't model quality any more, it's power, heat, and silicon that software still treats as if every core were the same.
Built With
- aarch64
- adb
- android
- arm-streamline
- arm64
- bash
- c++
- cmake
- ggml
- kleidiai
- llama.cpp
- neon
- perf
- perfetto
- python
- raspberry-pi
- shizuku
- simpleperf
- termux

Log in or sign up for Devpost to join the conversation.