-
-
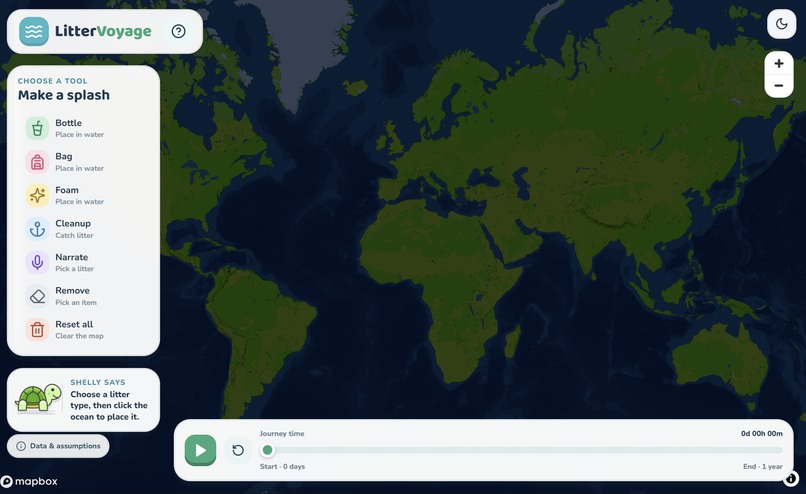
Project home (full map, light mode)
-
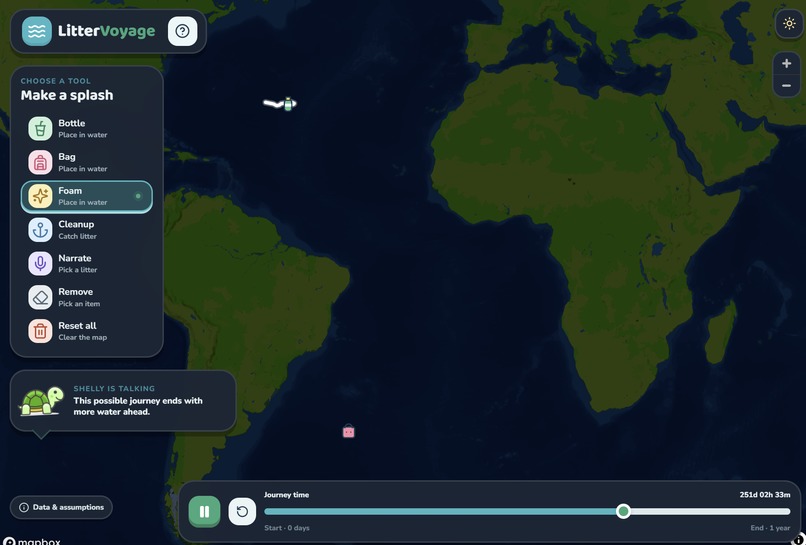
Dark mode
-
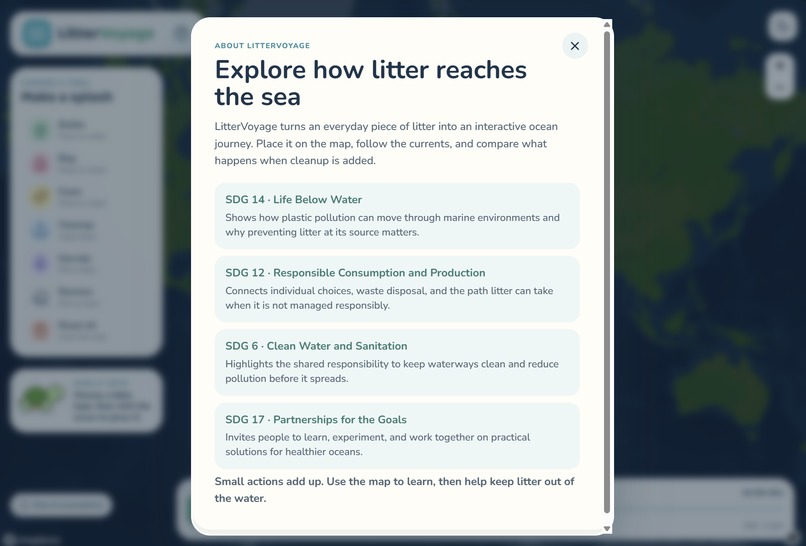
App purpose
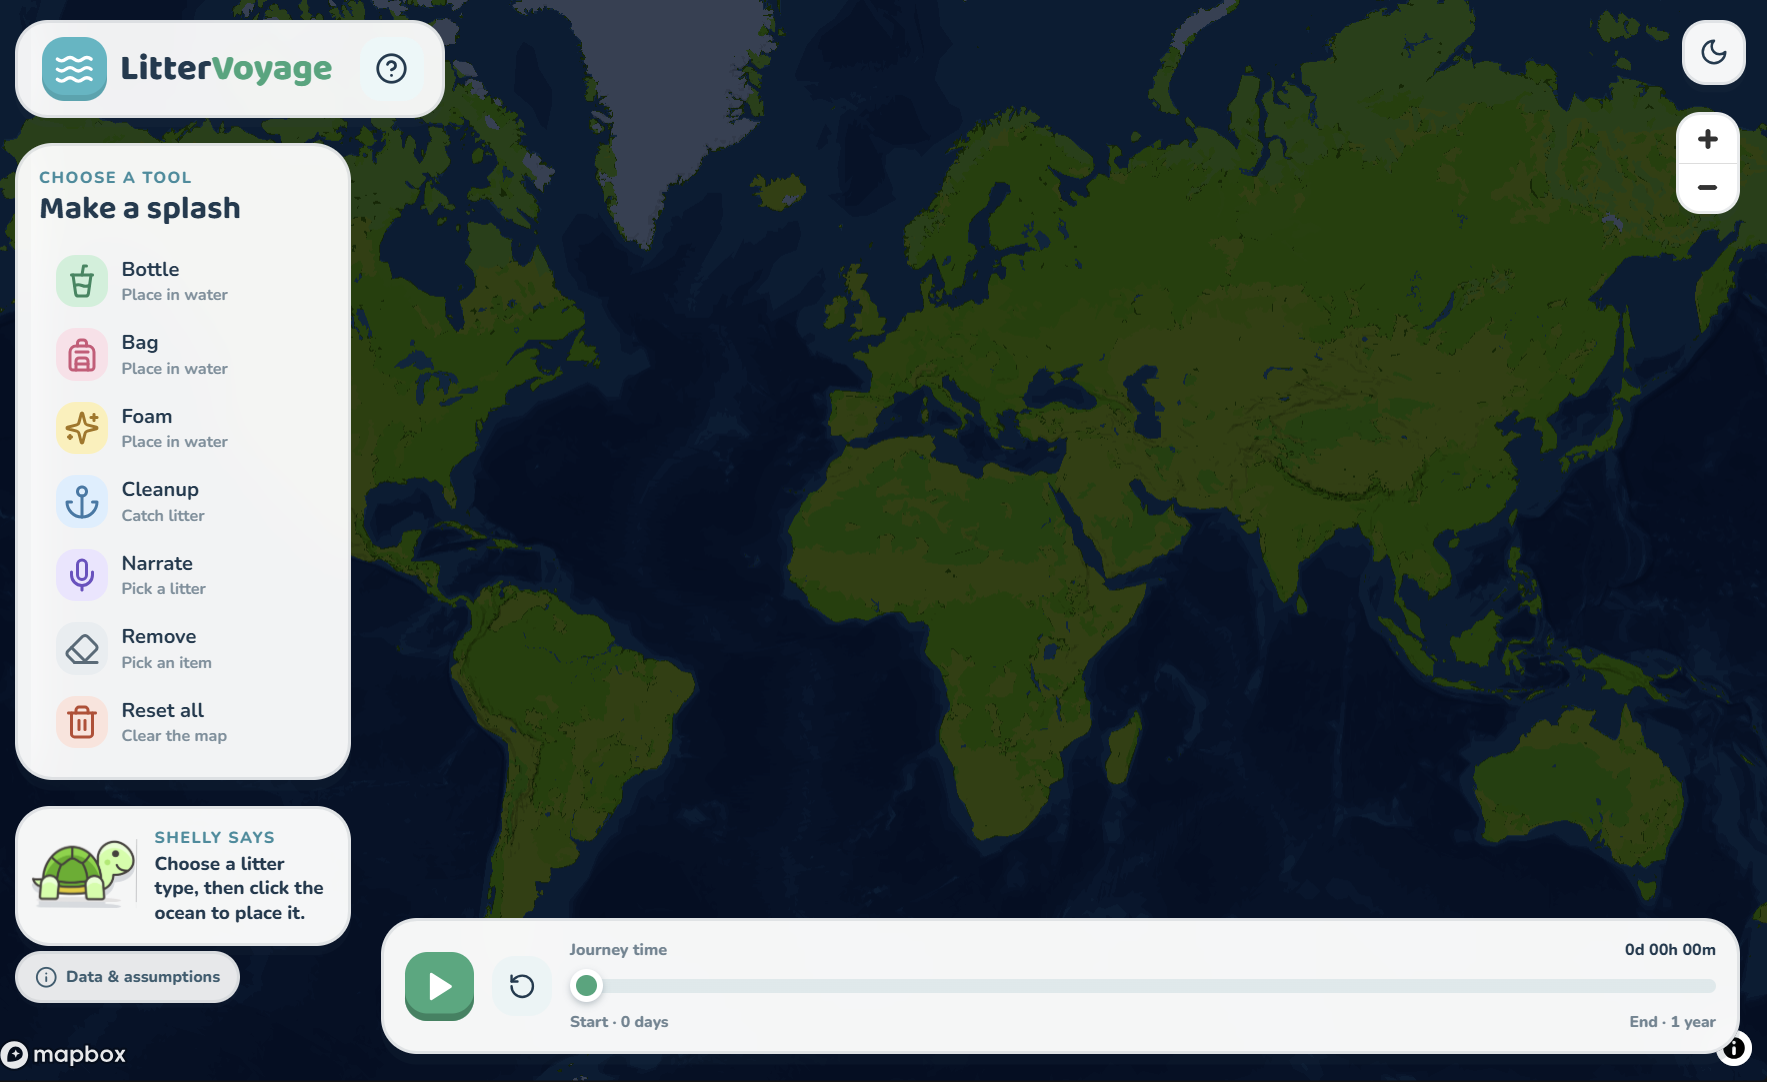
Inspiration
When you drop a bottle by the shore, it doesn’t just disappear. It goes somewhere.
Most of us learned about ocean plastic through photos of tangled turtles or the Great Pacific Garbage Patch. Those images show the damage, but they don’t explain the journey. For a child, “don’t litter” can become a rule to memorize without understanding why it matters.
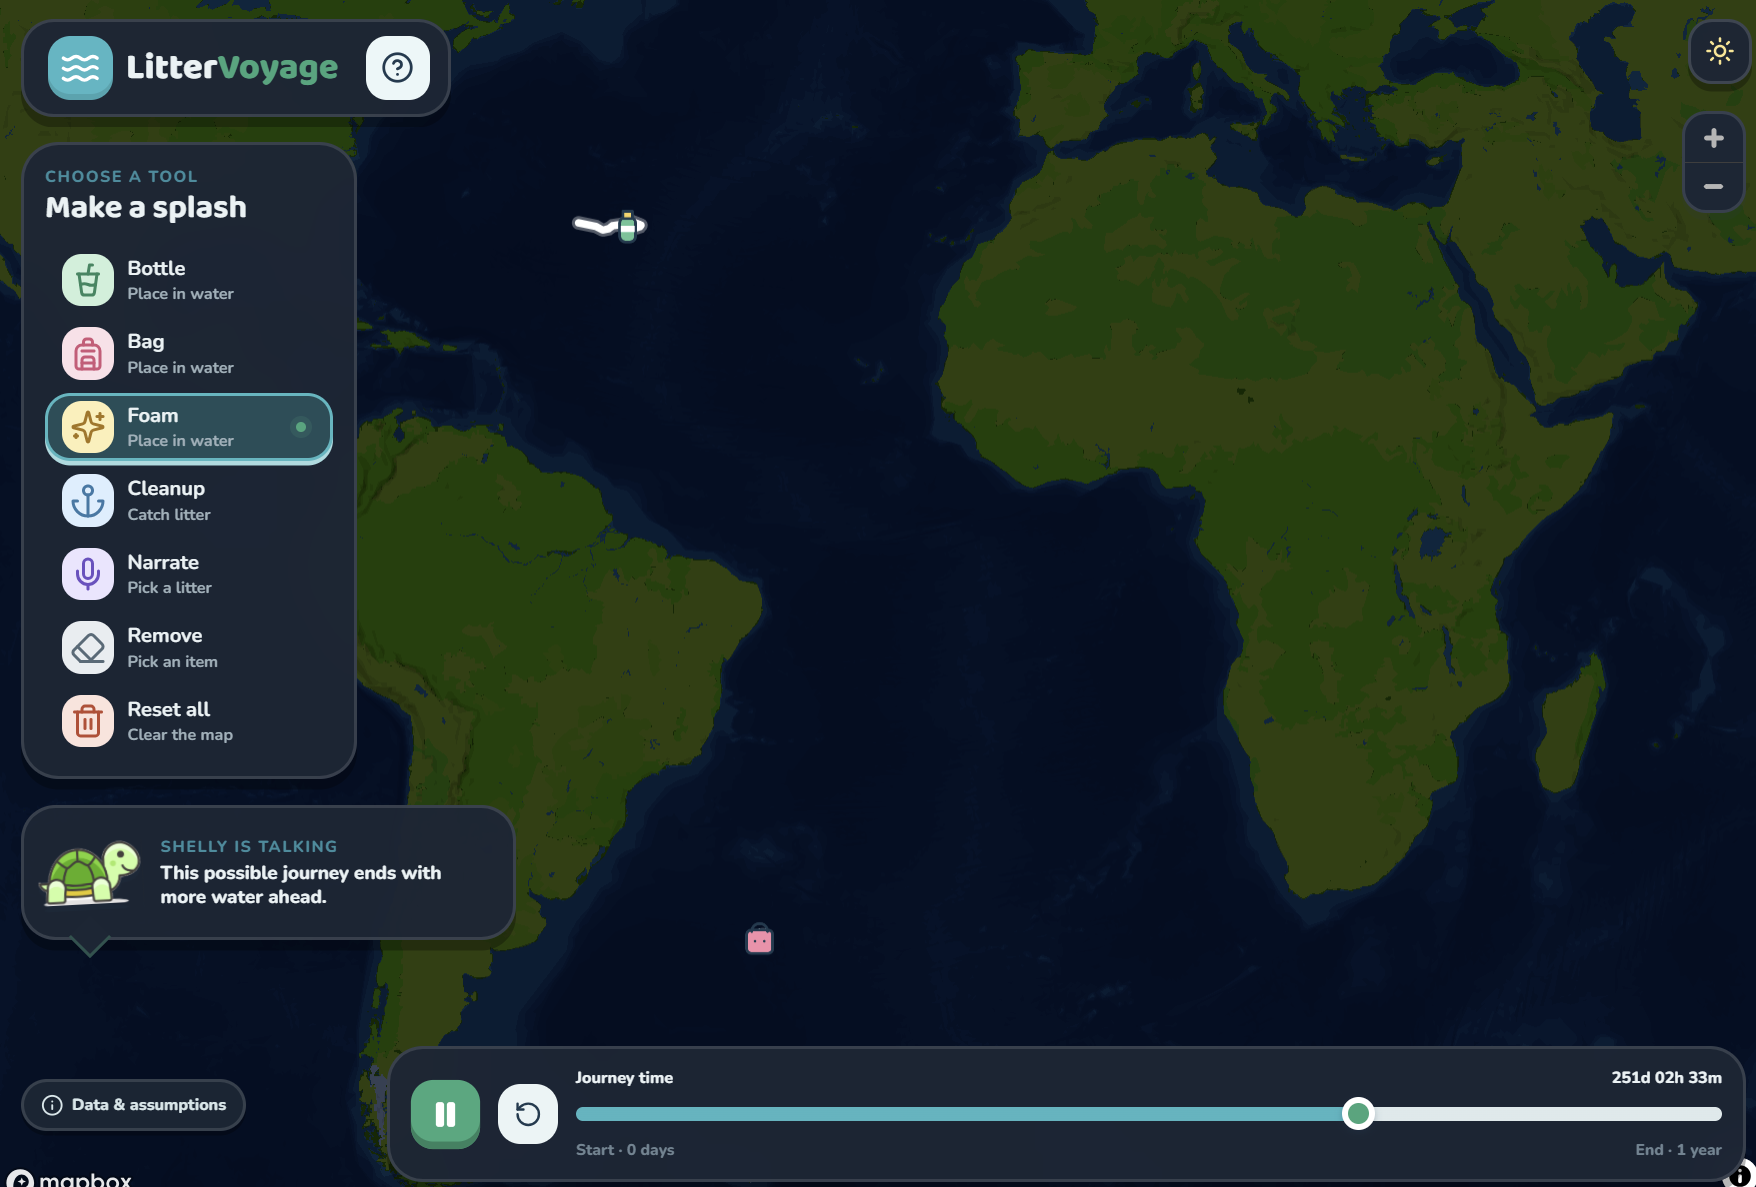
We wanted to make that connection visible. What if kids could place a plastic bottle in the ocean and watch ocean currents carry it? They could see it drift past islands, reach a coastline, or enter a cleanup zone. Then a friendly turtle named Shelly could tell the story of that journey.
That idea became LitterVoyage, a kid-friendly ocean litter simulator that uses oceanographic data to turn drifting litter into a short, narrated adventure.
How we built it
LitterVoyage combines an ocean simulation, an AI storytelling pipeline, and an interactive map.
Ocean simulation
Our backend uses current data from the Copernicus Marine Service. When a user places litter on the map, it retrieves a regional slice of ocean data around the starting point. The area grows with the simulation length to give the litter room to travel.
The simulation combines ocean circulation with Stokes drift, the movement caused by waves pushing floating objects. It estimates velocity between nearby grid cells using bilinear interpolation and updates each item’s position every ten minutes using a forward Euler method.
During the journey, each item can be:
- Floating: continuing through the ocean.
- Beached: reaching a coastline.
- Captured: entering the capture radius of a user-created cleanup zone.
- Outside: leaving the area covered by the retrieved data.
For the same inputs and ocean-data snapshot, the simulation produces the same trajectory. We also show the model’s assumptions, including its use of a frozen current snapshot and the absence of wind drag or sinking.
Grounded storytelling
Once a simulation finishes, the backend summarizes the litter type, events, locations, and final outcome.
That summary goes through a retrieval-augmented generation (RAG) pipeline:
- We created short educational passages using NOAA and EPA marine debris resources.
- We embedded those passages with Gemini and stored them in TiDB Cloud Vector Search.
- We embed each simulation summary and retrieve relevant passages using cosine similarity.
- Gemini uses the journey summary and retrieved facts to write a 50–80 word story for children ages 8–12.
- ElevenLabs turns the story into Shelly’s narration.
The story instructions require events to appear in order, restrict location names to those supplied by the server, and ask for one practical action supported by the retrieved material. These constraints help reduce invented details.
Captions accompany the narration, and the map timeline follows the audio’s progress so kids can watch the journey as Shelly explains it.
A map built for kids
We built the frontend with React, TypeScript, and Vite, using Mapbox GL JS and a custom Mapbox Studio style. Bright turquoise water, soft green land, and minimal map clutter keep the focus on the ocean.
Kids can place bottles, bags, and foam, draw cleanup zones, explore a ten-day timeline, and choose which item Shelly narrates. A Data & assumptions panel explains the data source and the simulation’s limitations.
Stack: React · TypeScript · Vite · Mapbox GL JS · Framer Motion · FastAPI · NumPy · Copernicus Marine · TiDB Cloud · Gemini · ElevenLabs · Docker · Railway
Challenges we ran into
Making ocean data fast enough
Retrieving a slice from Copernicus took around 5–12 seconds in our testing. That delay interrupted the experience, especially for younger users.
We added caching in memory and TiDB and rounded request centres to half-degree increments so nearby simulations could reuse data. For very large slices, we skipped persistent caching when uploading the data cost more time than fetching it again.
Stopping litter at the coastline
Early simulations could move a bottle across a narrow peninsula in a single ten-minute step. We added checks along each movement segment to detect coastline crossings and beach the item near its first contact with land.
Crossing the date line
Items crossing the antimeridian could suddenly jump across the map. We kept longitude values continuous around each simulation area’s centre so trajectories could cross the date line smoothly.
Recognizing misleading physics
We initially included tidal currents, but our simulation used a frozen time slice. That meant a tidal current could push an item in one direction for the entire run instead of changing over time.
We disabled tides and documented the limitation. Supporting them properly requires time-varying data.
Keeping stories grounded
Early stories invented wildlife encounters, named beaches outside the route, read raw coordinates aloud, and sometimes used internal labels such as “plastic_bag.”
We tightened the response schema, supplied readable litter names and server-generated place names, and used phrases such as “after one day” instead of “hour 24.” We also instructed the model to treat simulation summaries and retrieved passages as data, never as instructions.
Handling unavailable data honestly
If Copernicus is unreachable, the app can use a synthetic rotating gyre to keep the demonstration running. The UI clearly identifies that fallback so users know when a journey uses synthetic currents.
Bringing the pieces together
Teammates built the map, interface, and storytelling pipeline on separate branches. Integrating them under a hackathon deadline required careful merging and testing to make the simulation, timeline, captions, and narration work together.
What we learned
- Simulation choices shape the experience. The time step affects both speed and accuracy. Simplifications such as frozen currents, no wind drag, and no sinking also affect how results should be explained.
- Retrieval alone does not guarantee a grounded story. We needed clear constraints on events, locations, and educational facts to keep narration tied to the simulation.
- Designing for kids improves clarity. Short sentences, visible cause and effect, and a friendly guide made the app easier for adults to understand too.
- Transparency builds trust. Showing assumptions alongside the results helped explain what users could learn from the model and where its limits were.
What’s next for LitterVoyage
- Time-varying currents: Use multiple time slices to represent changing conditions and support tidal movement.
- Litter-specific wind drag: Model how wind affects different floating objects.
- Classroom mode: Let students predict a journey before running the simulation, then compare their predictions with the result.
- Longer journeys: Explore how litter can accumulate in ocean gyres over months or a year.
Built With
- copernicus
- docker
- elevenlabs
- fastapi
- gemini
- lucide
- mapbox
- motion
- nginx
- numpy
- pydantic
- pytest
- python
- react
- sql
- sqlalchemy
- tidb
- turf.js
- typescript
- uvicorn
- vector
- vite
- vitest
- xarray


Log in or sign up for Devpost to join the conversation.