-
-
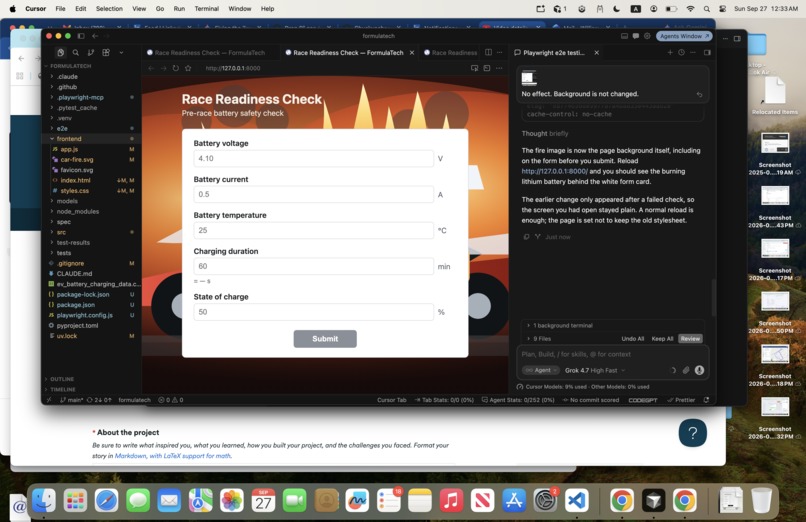
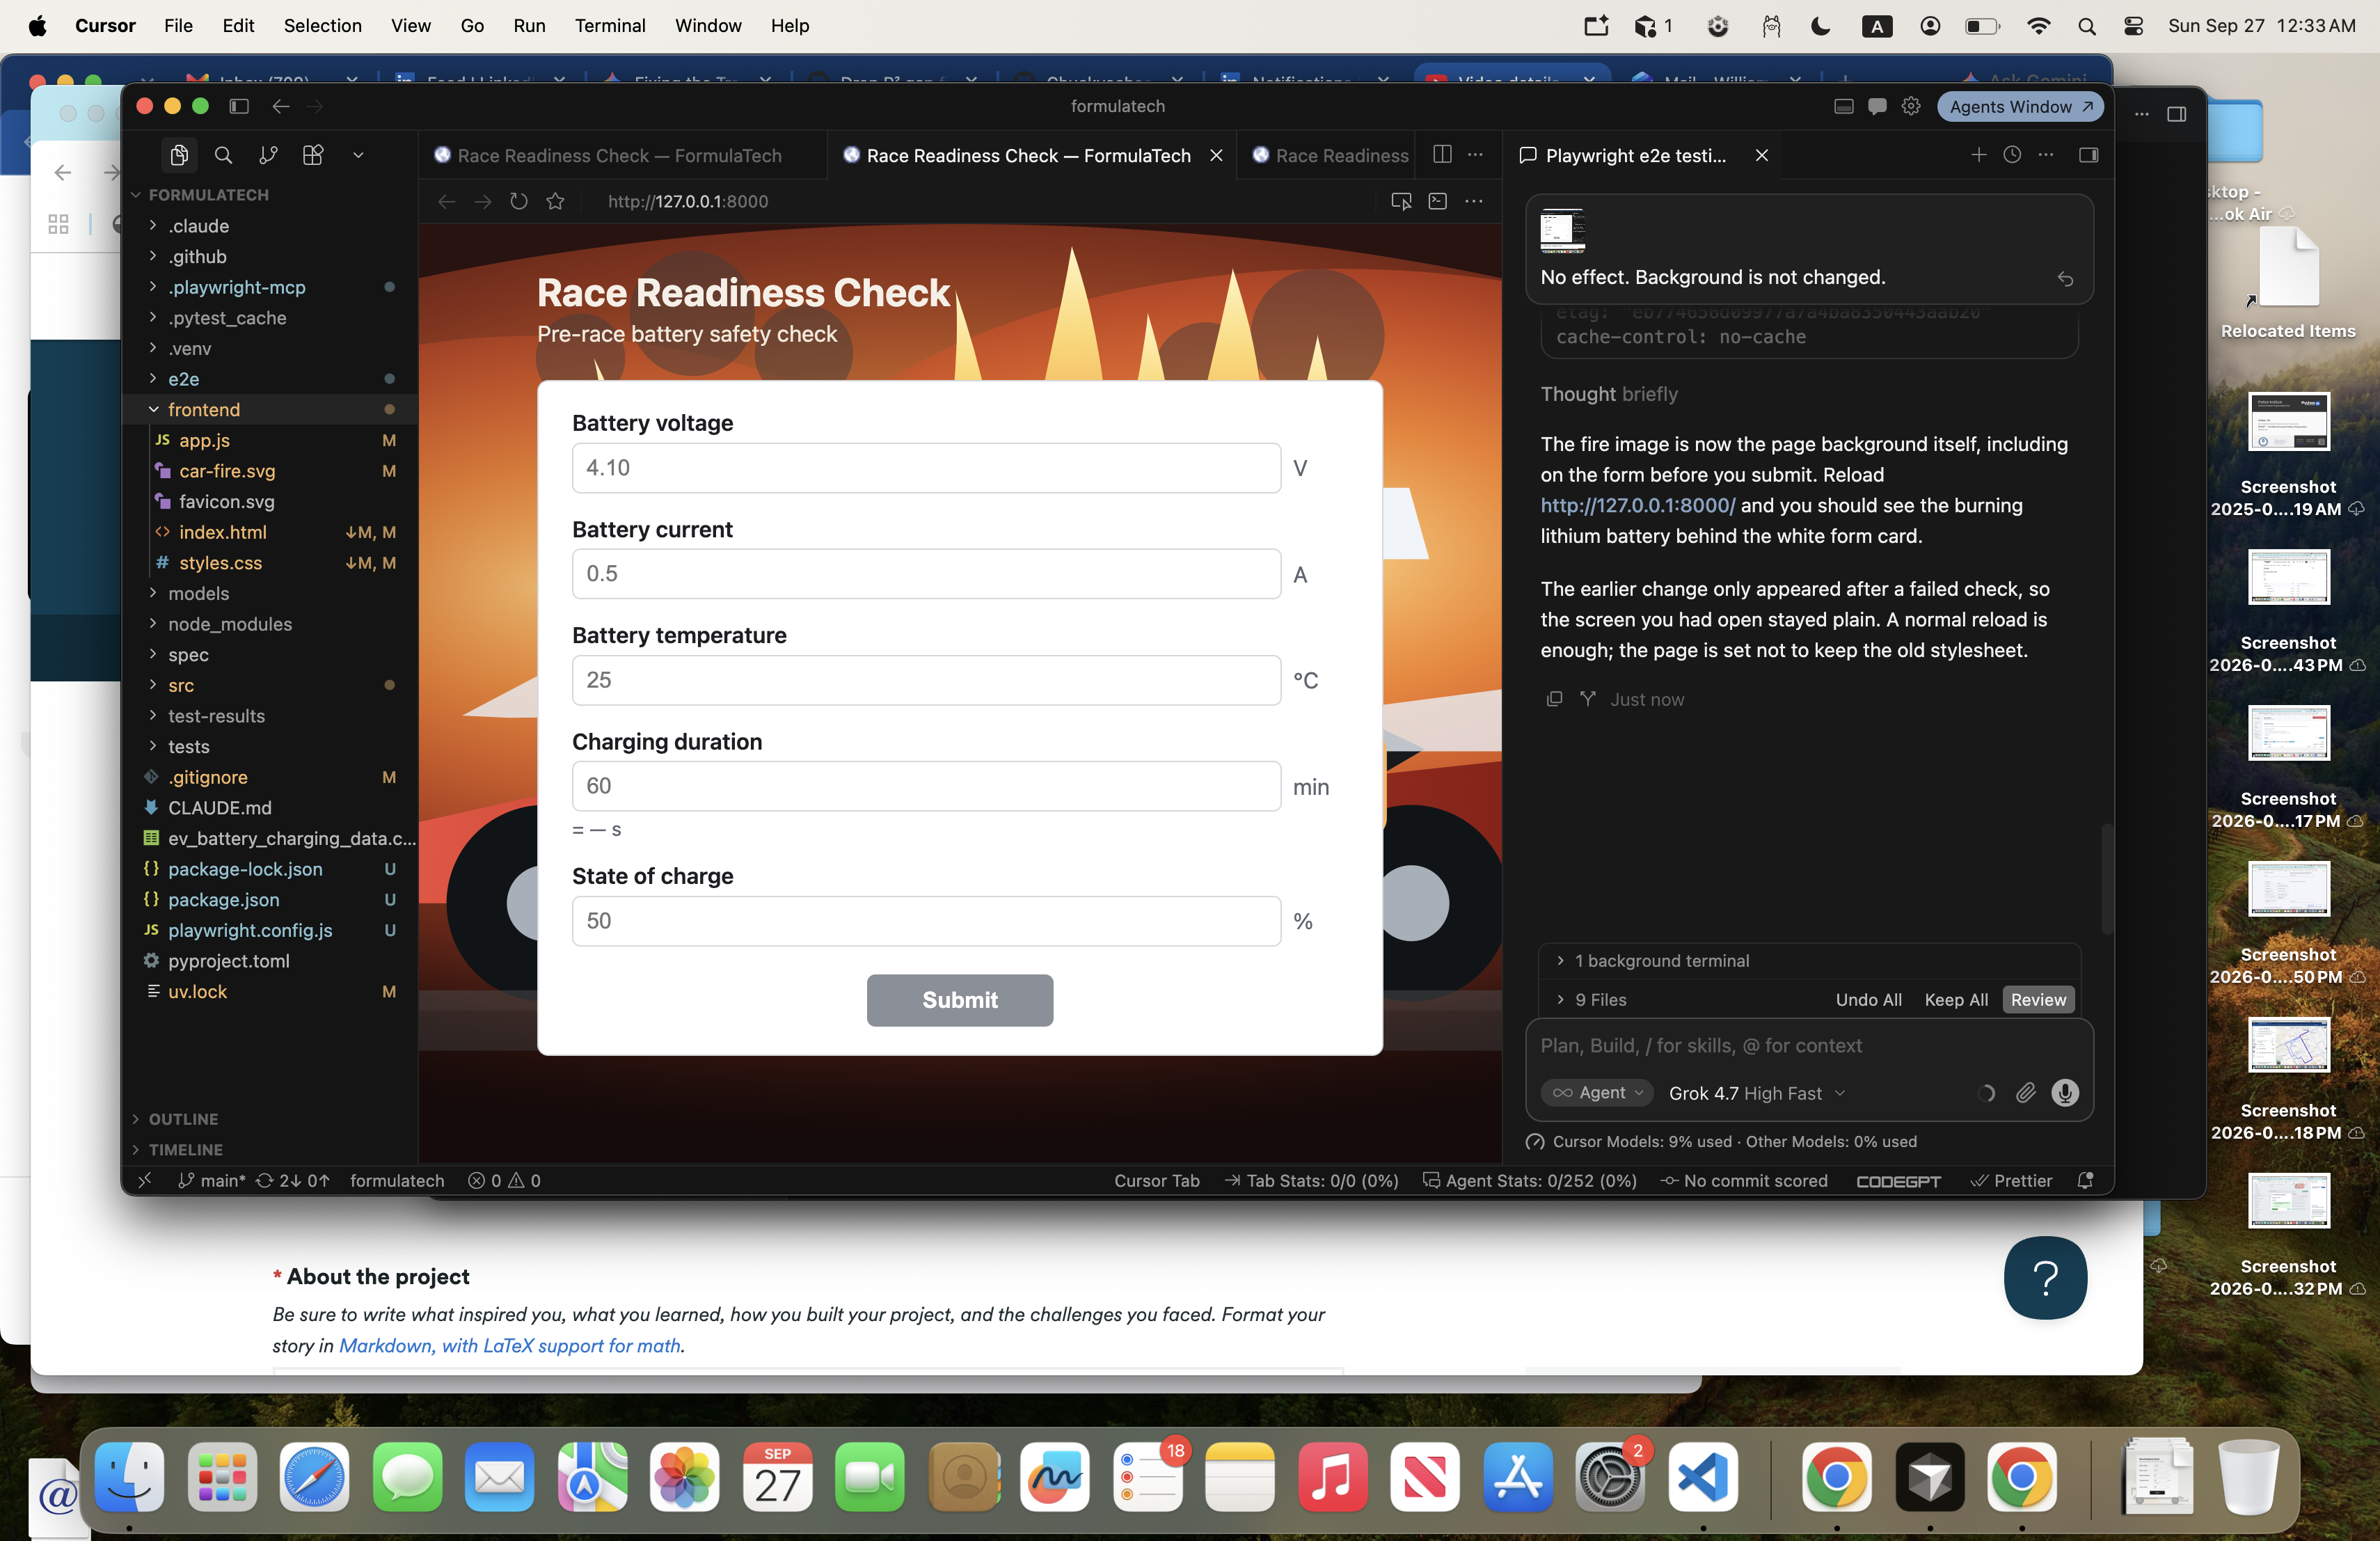
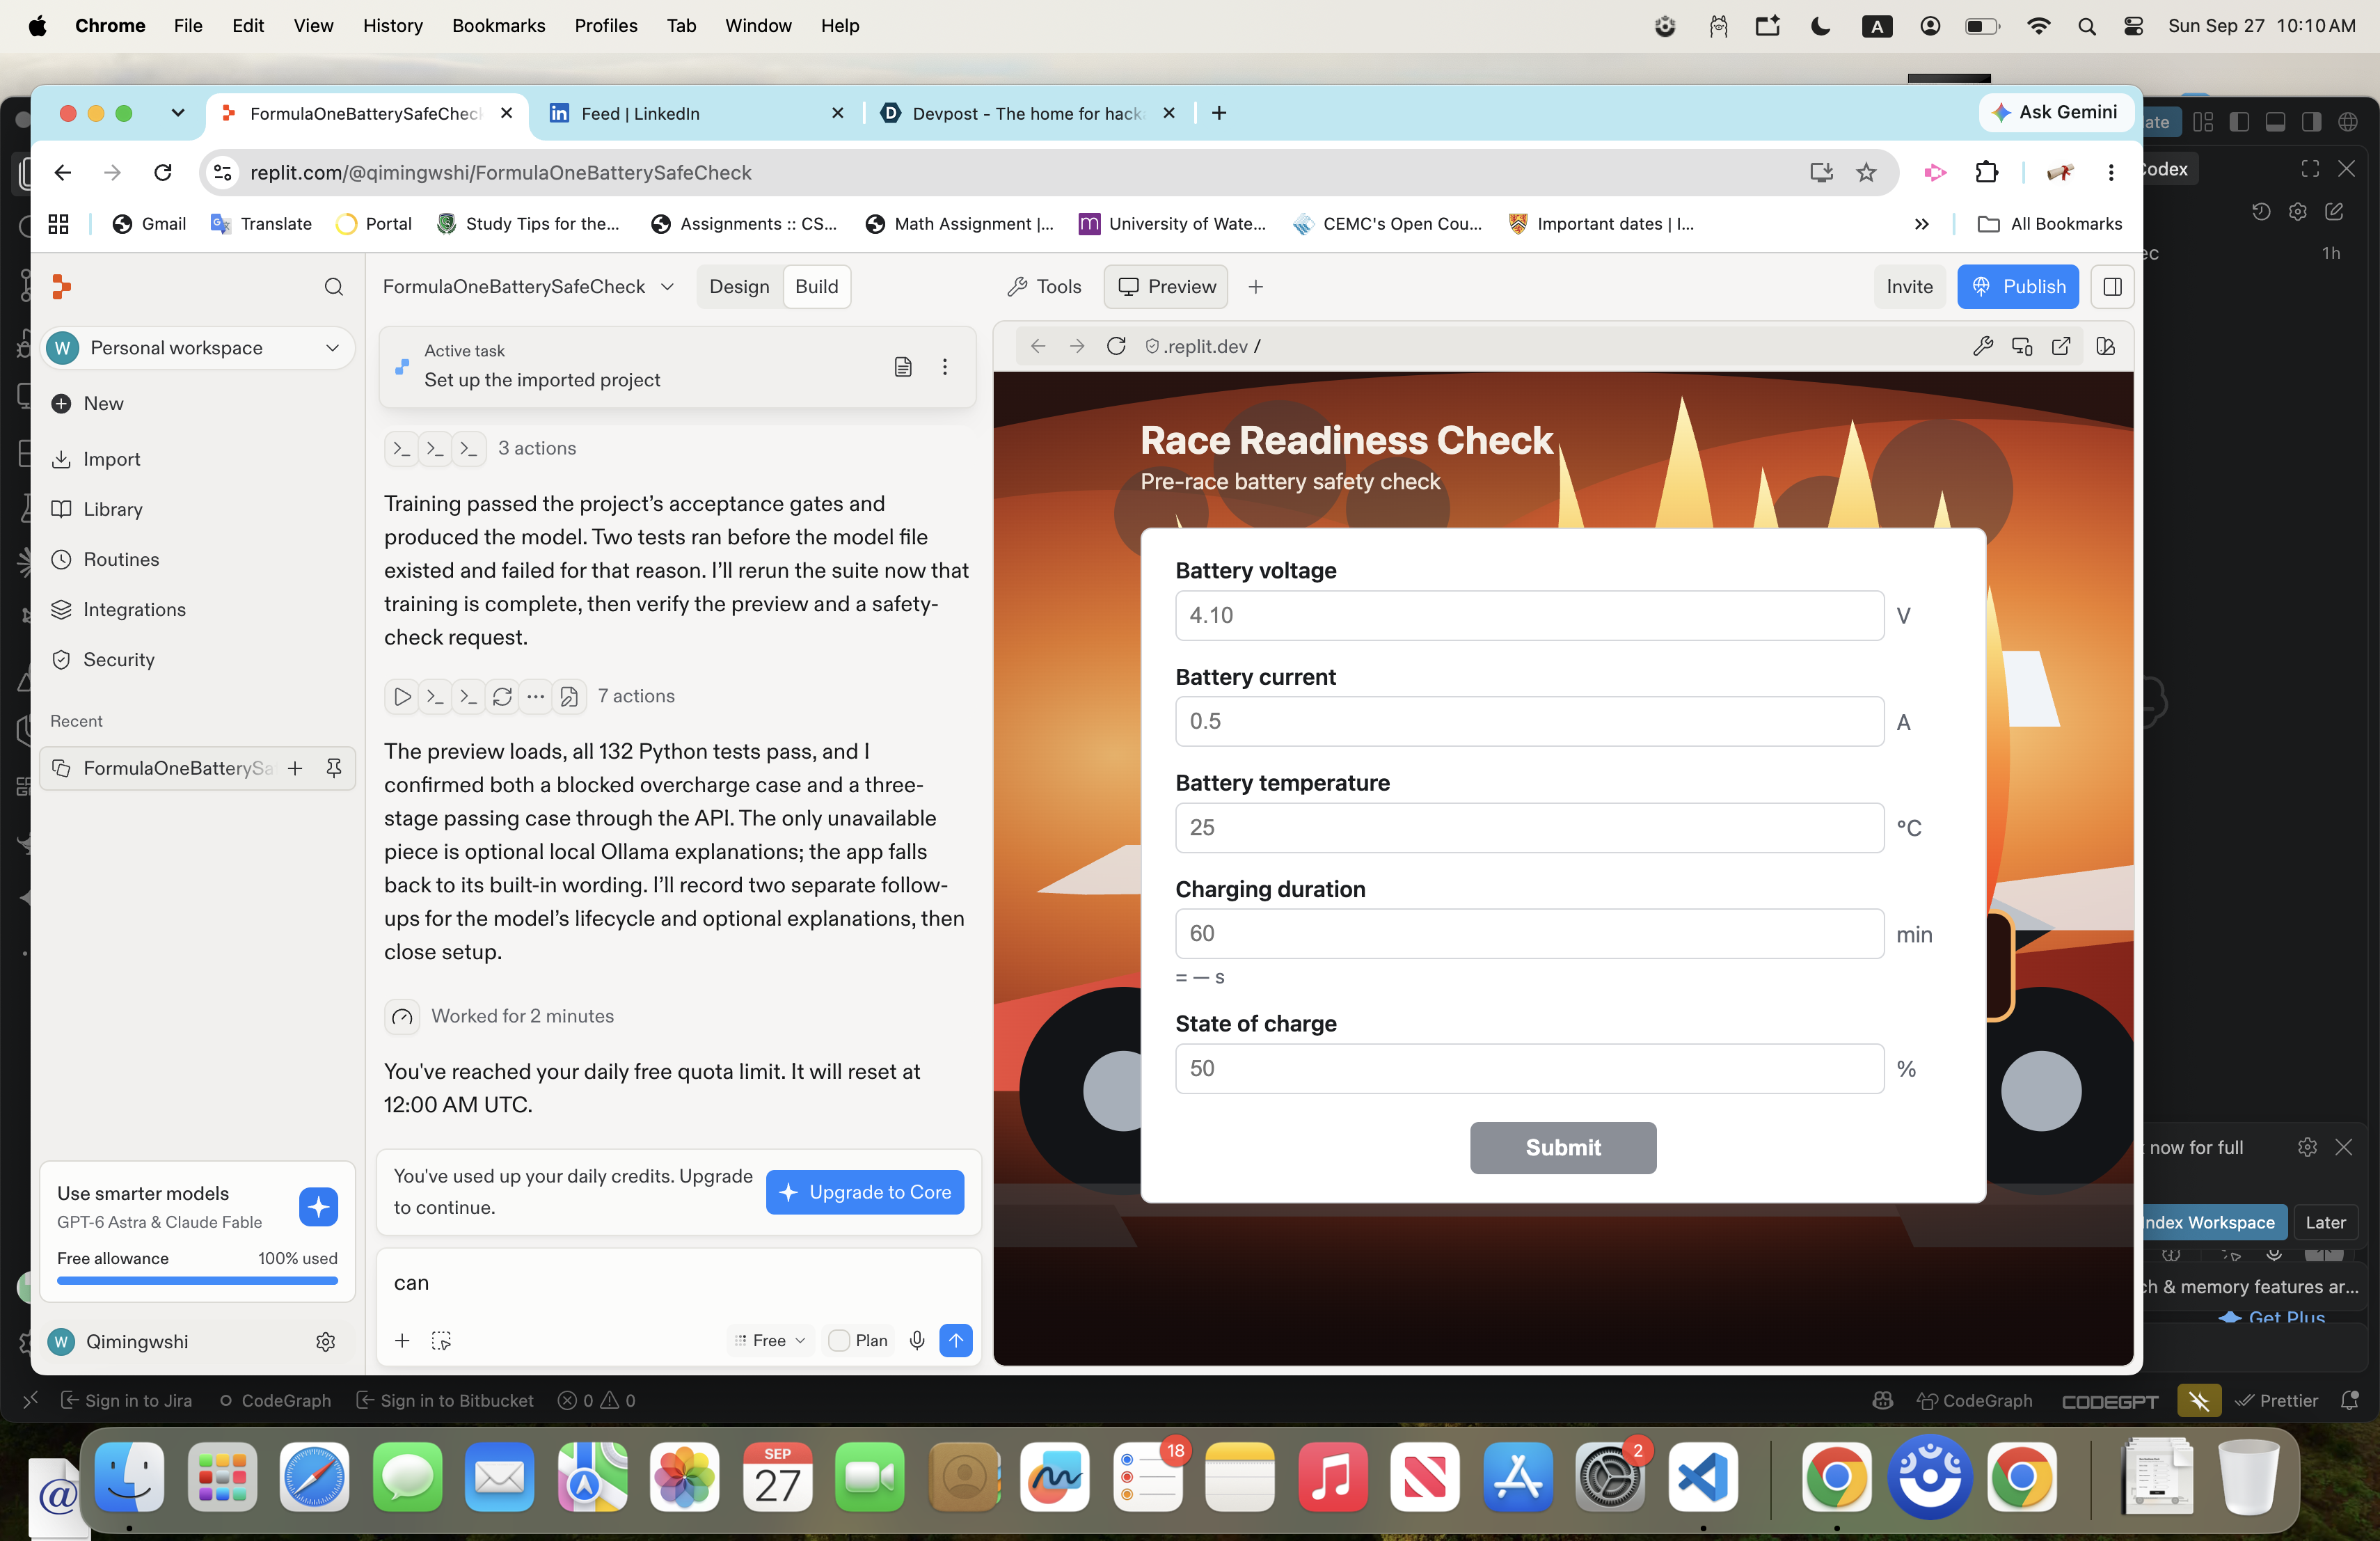
Front View
-
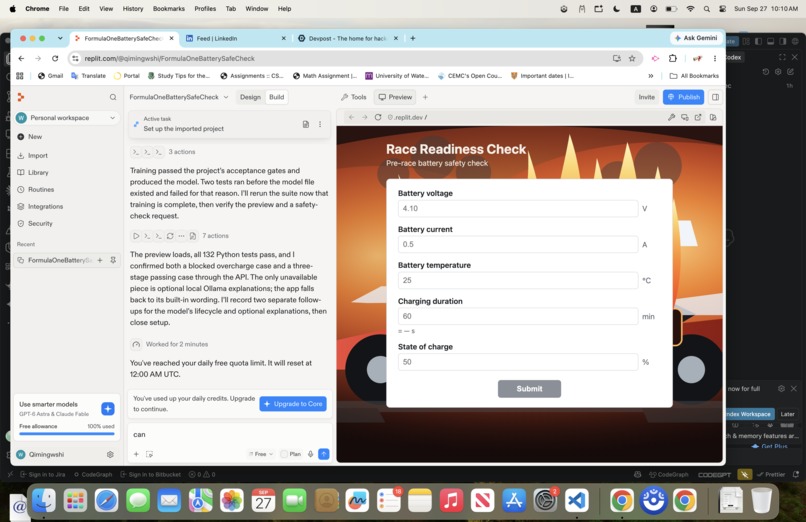
REPLIT
-
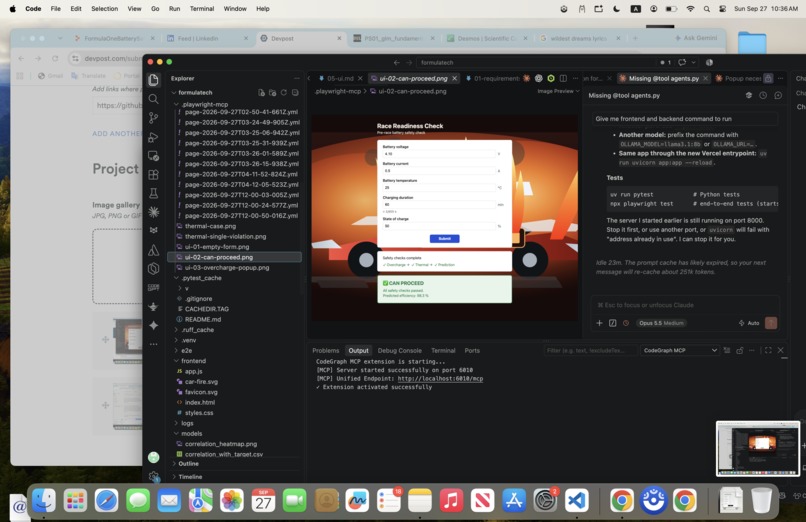
Can Proceed
-
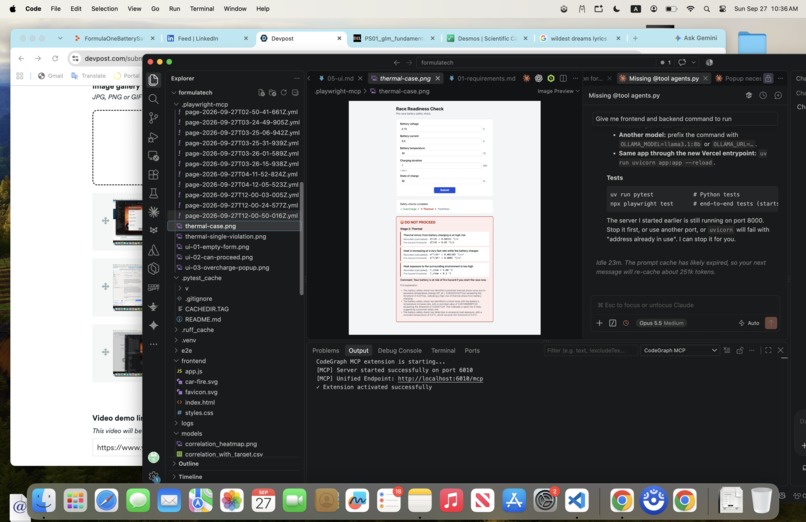
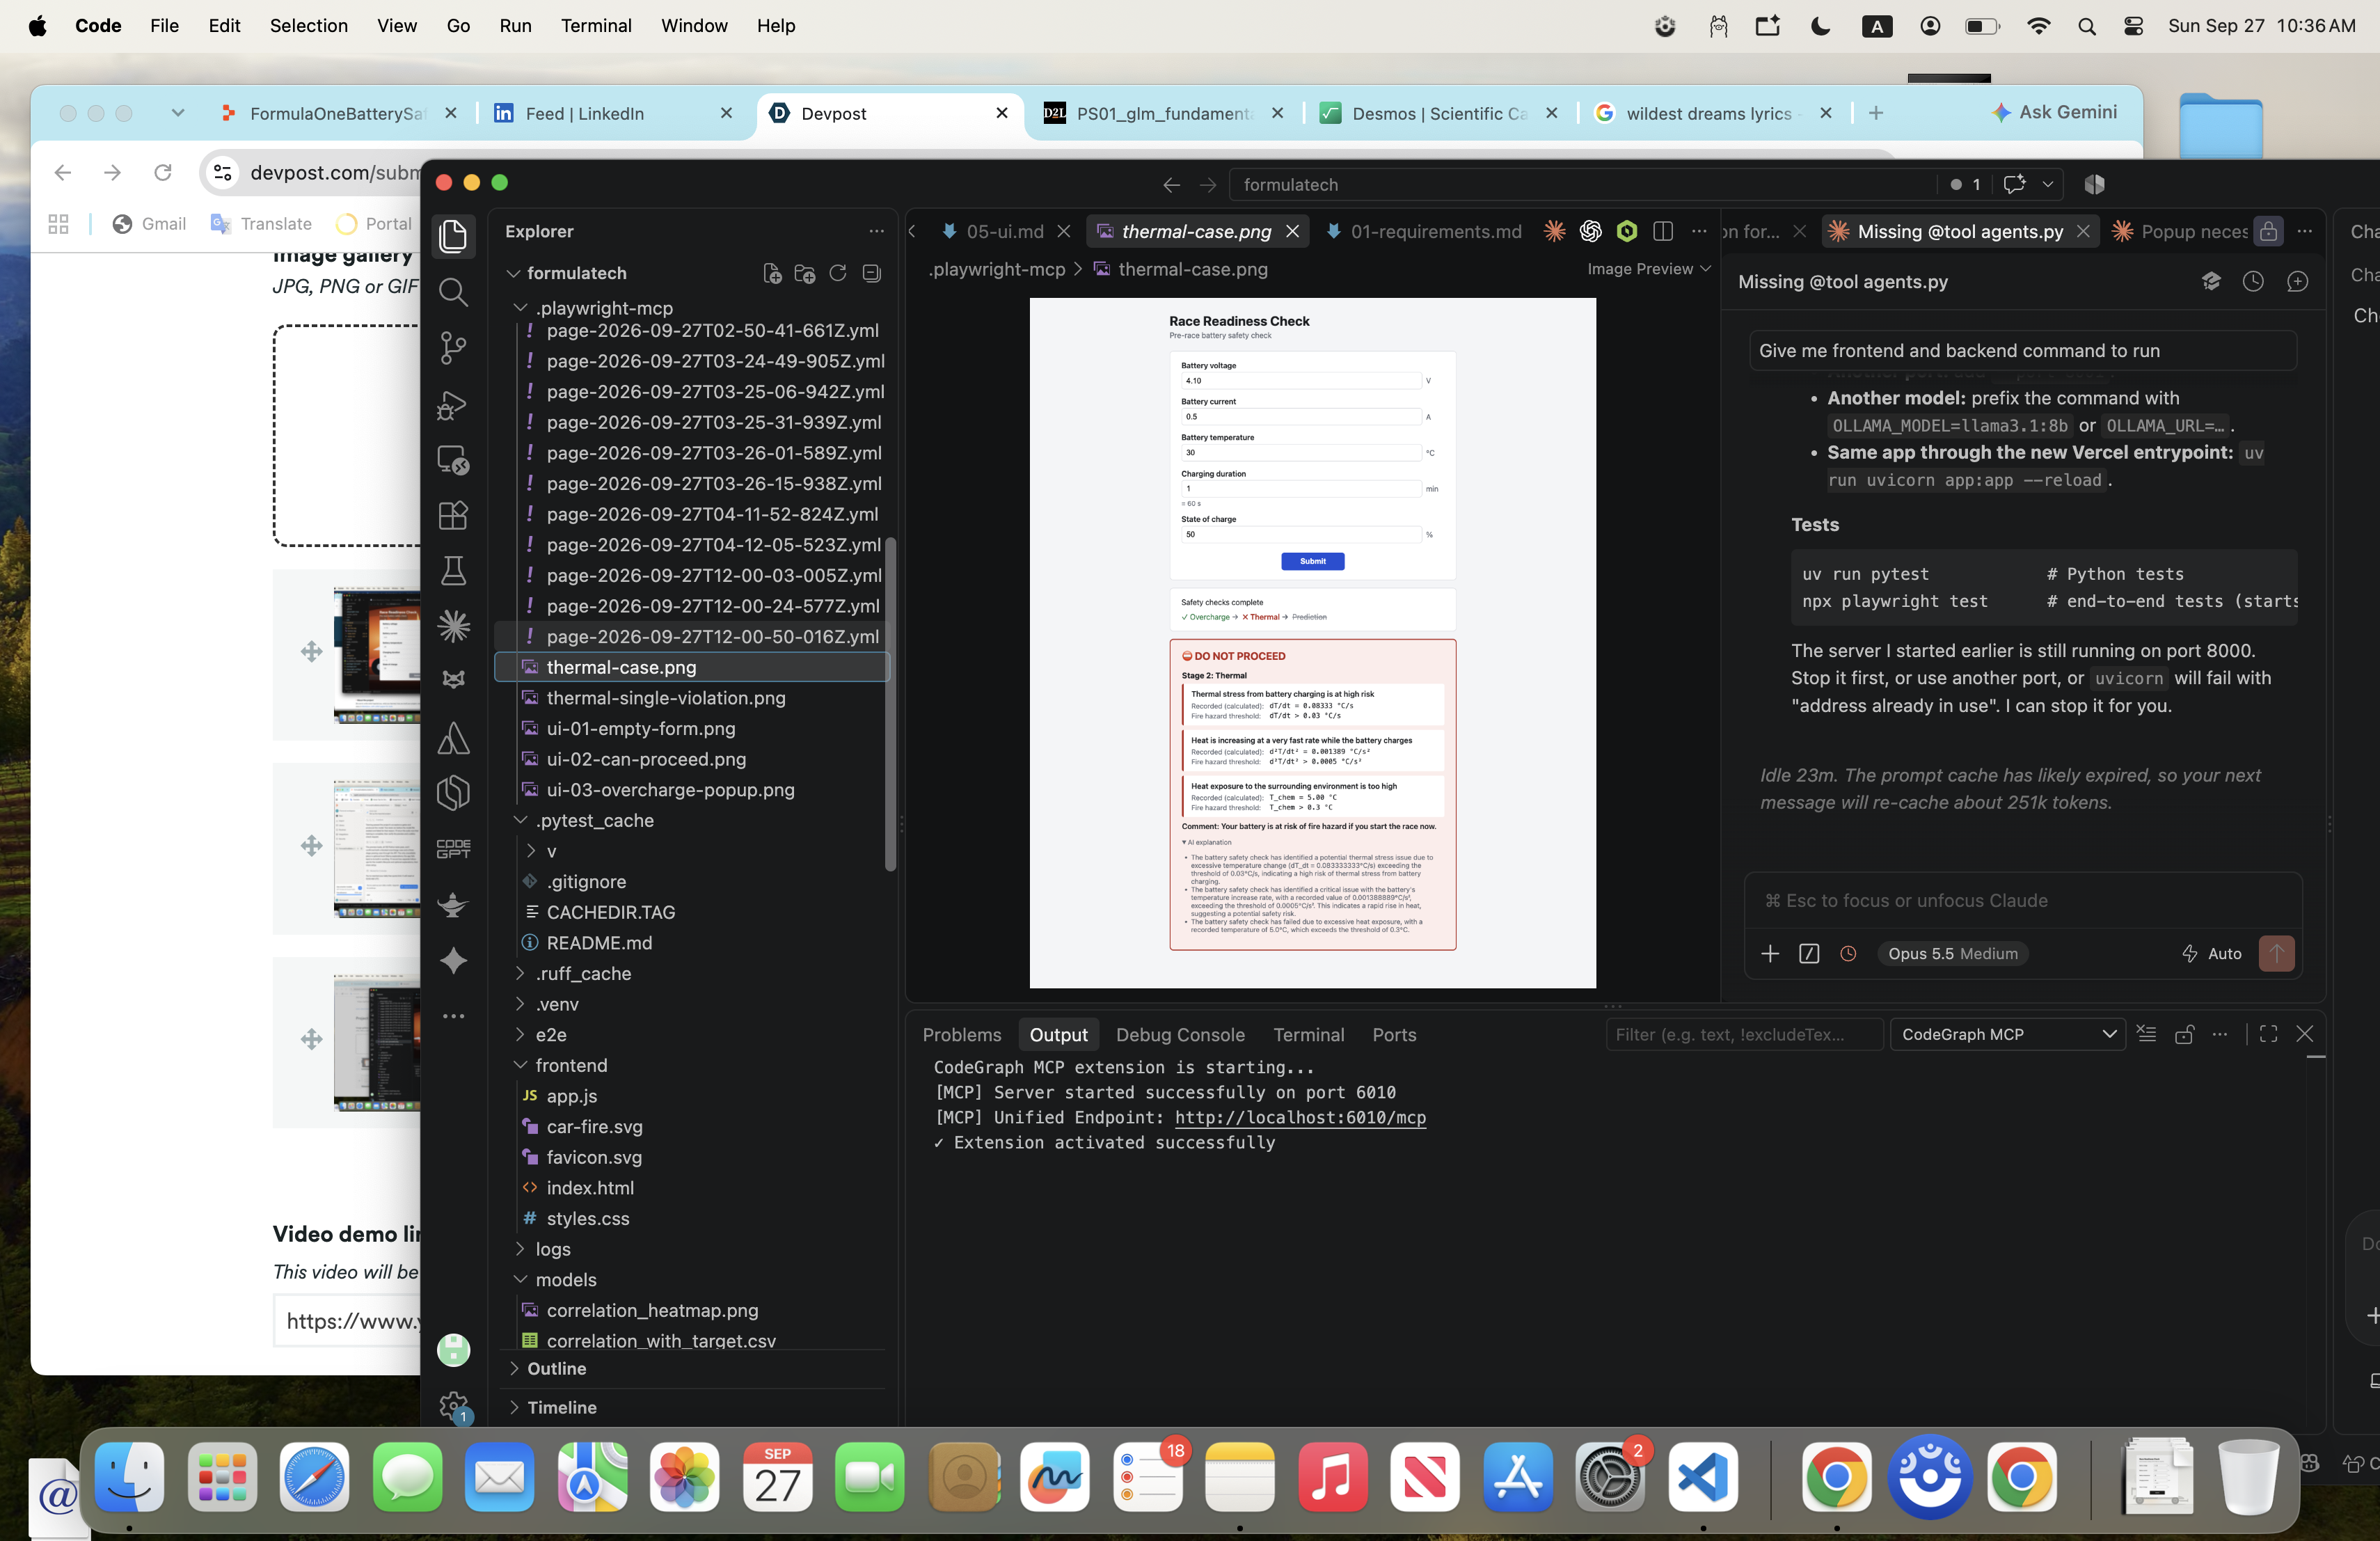
Cannot Proceed Thermal Multiple Reasons
-
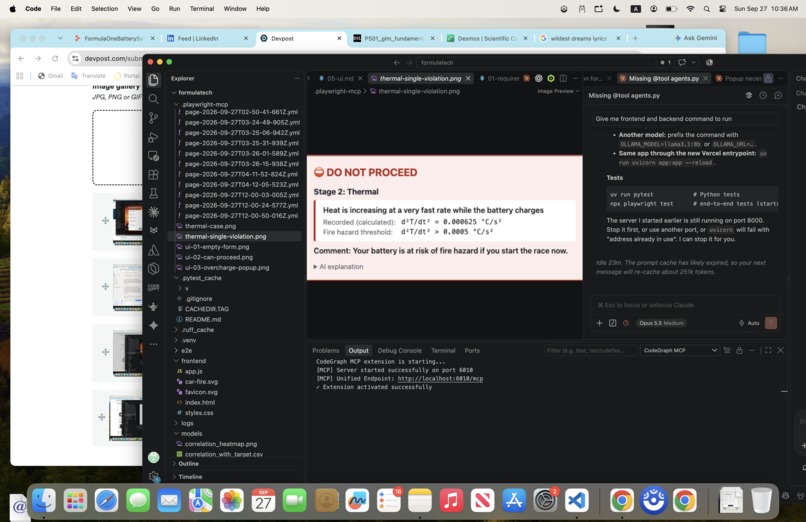
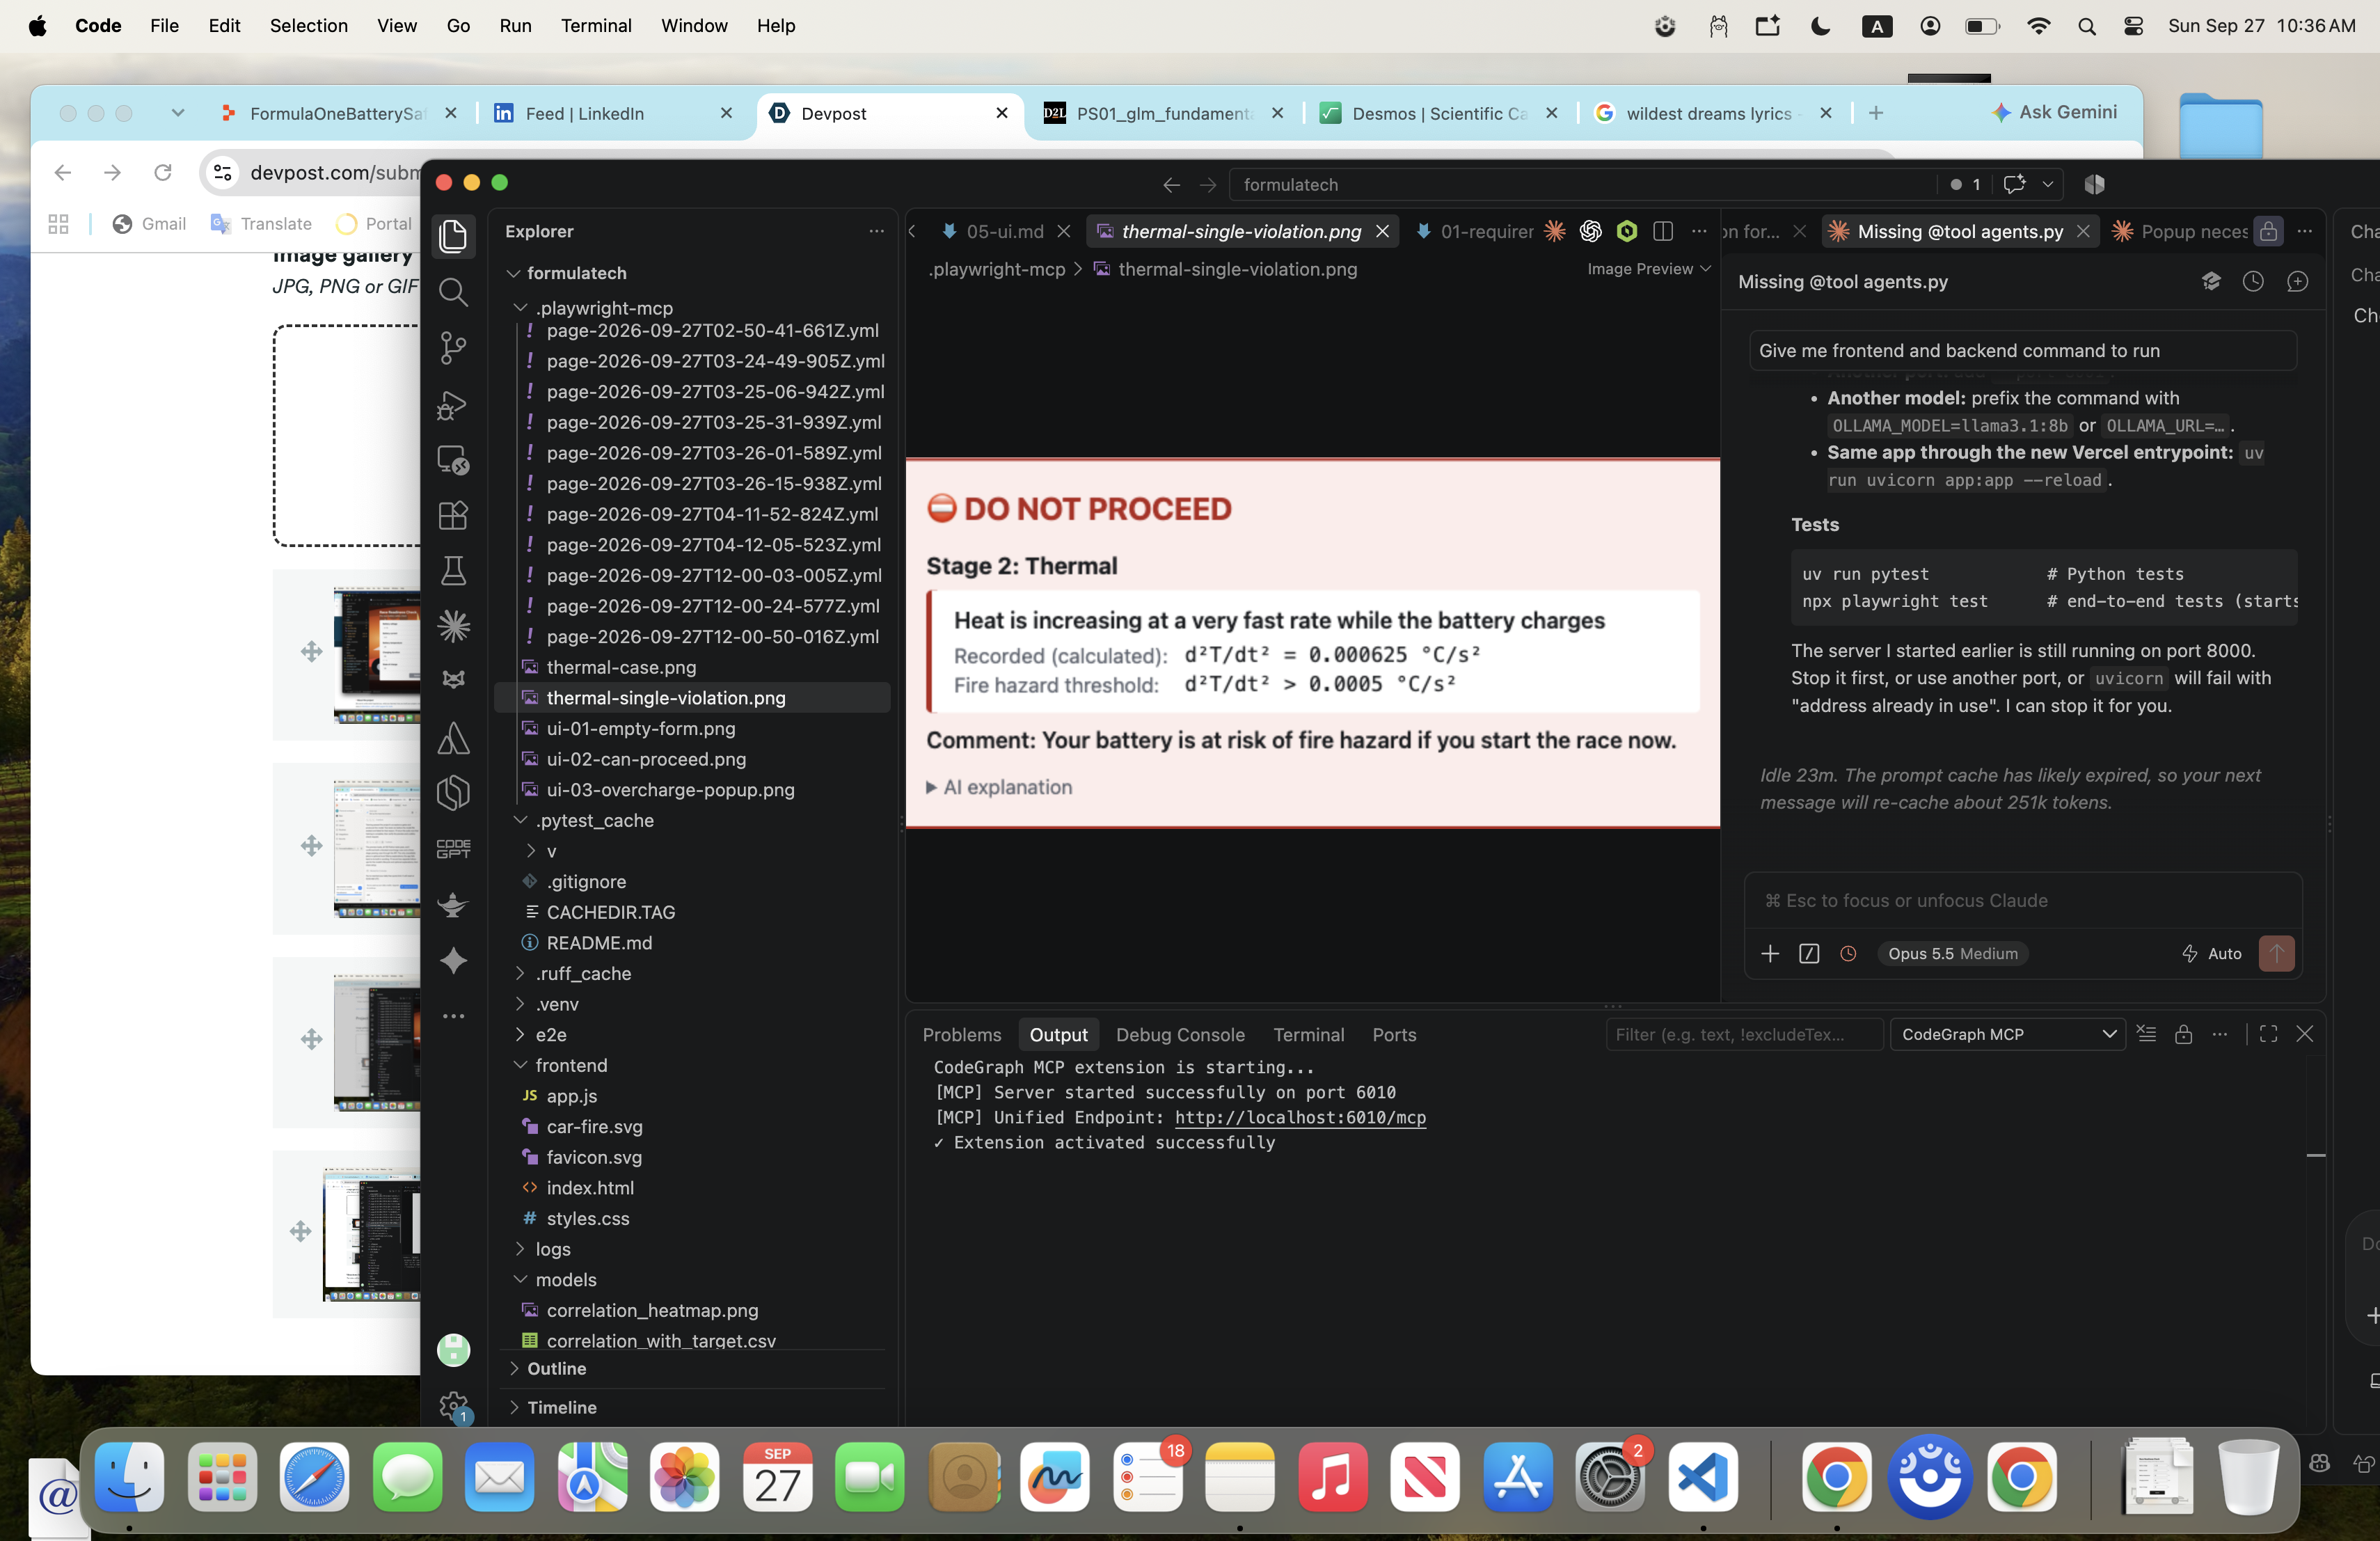
Cannot Proceed Thermal One Reason

Inspiration
Many FormulaOne car uses lithium battery as their fuel source. The problem is that if the battery is overcharged, then it can catch on fire, which can kill passengers. This is due to high temperature inside the battery itself, especially when it is exposed to heat.
What it does
The app simply takes user inputs: Battery Voltage, Battery Current, Battery Temperature, Battery Charging Time Used (plugged) and Battery % Level. This would output the following:
- Can proceed into the race if there is no issue from the following scans:
- Battery itself overheated already?
- Thermal danger (temperature rise issue)?
- Predicting Battery effectiveness % starting from battery state currently
- Cannot proceed one of the following reasons:
The first 2 main bullets represent fire hazard potential if start the engine now. Last bullet represent hazard potential during the course of the race. These are checked chronologically; if one condition failed before another we cannot proceed and list only that part as the reason. For example, if battery itself is already overheated; we say cannot proceed and problem description has battery overheated along with recorded data along with hazard risk threshold AND whether fire hazard can happen if you start the car right now or during the middle of the race.
- Battery itself overheated already? - Hazard Risk Threshold: Current < 0A AND Voltage > 4.2V
- Battery encountering potential thermal danger?
(at least one option for meeting the hazard risk threshold applies)
- rate of change in temperature rise > 0.03 °C/s
- acceleration rate in temperature rise > 0.0005 °C/s²
- chemical temperature > 0.3 °C
- Ineffective battery %? Effectiveness% < 70% This is to precheck the battery before starting the race with the specific car for the team (vehicle check). ## How we built it Used hard-coded computation formula to determine rate of change in temperature rise and acceleration rate in temperature rise, critical temperature as below: rate of change in temperature rise: dT/dt = (T_t - T_0) / t where t represents time of battery at Battery Charging Time Used (plugged), at T_0 represents initial time, I used ambient temperature T = 25 degree Celsius acceleration rate in temperature rise: d²T/dt² = (T_t-T_0) / t² chemical temperature: T_chem = max(0, T_t − T_0) For prediction of battery effectiveness: Use data passed in as the input and then trained it through XGBoost. With XGBoost, I used R^2test, R^2 cross validation and tolerance accuracy to determine the best model fit. Below are the computation and parameters to determine model of best fit: The model is used for stage 3 only if all three pass:
gates_passed = (Tolerance accuracy > 80 %) and (R²_test > 0.90) and (CV R²: mean > 0.90, std ≤ 0.03)
Tolerance accuracy: is each prediction close enough?
number of rows where |yᵢ − ŷᵢ| ≤ δ * 100Tolerance accuracy (%) =
────────────────────────────────────
N yᵢ: true efficiency of test row i ŷᵢ: the model's predicted efficiency for that row |yᵢ − ŷᵢ|: how far off the prediction is, in percentage points δ = 0.1: the allowed error (±0.1 pp) N: number of test rows (200) Why: it measures error in the same unit as the 70 % limit. Gate: more than 80 % of predictions within ±0.1 pp.Test R²: does the model explain unseen data?
Σ (yᵢ − ŷᵢ)² ← the model's squared errorsR² = 1 − ────────────── Σ (yᵢ − ȳ)² ← squared errors from always guessing the average ȳ: the average true efficiency in the test set The fraction compares the model's error with the error of simply guessing the average: R² = 1: perfect predictions R² = 0: no better than guessing the average R² < 0: worse than guessing the average Why: the 20 % test set is never used during training, so this is an unbiased check that the model actually responds to its inputs. Gate: R² > 0.90.
CV R²: is the result consistent? Split the training data into 5 parts. Train on 4 parts, compute R² on the 5th, and repeat so each part is held out once. That gives R²₁ … R²₅.
R²₁ + R²₂ + R²₃ + R²₄ + R²₅Mean R̄² = ───────────────────────────── 5
┌─────────────────────────Std s = │ (1/5) × Σ (R²ₖ − R̄²)² √ R²ₖ: R² on fold k R̄²: average R² over the 5 folds, i.e. how good the model is across different samples s: how much the fold scores vary, i.e. how stable the model is. It's computed with 1/5 (not 1/4), matching np.std in the code. Why: a single test split could look good by luck. Gate: mean > 0.90 and std ≤ 0.03.
Check Question it answers Why it's needed Tolerance accuracy Is each prediction close enough to trust? It's the only check in real units (percentage points), the same unit as the 70 % limit. Test R² Does the model actually learn from the inputs? It uses the held-out 20 % that was never used to train or tune, so it's an unbiased check on new data. CV R² (mean + std) Is the result consistent, or a lucky split? It repeats the test over 5 different splits, so one fortunate split can't make a bad model look good.
Agentic AI through LangGraph and Ollama LLM model were used to divide up the tasks amongst 4 agents:
- Agent #1: Diagnose overcharged battery itself initially (yes/no)
- Agent #2: Diagnose thermal risk (yes/no)
- Agent #3: Diagnose battery effectiveness % from prediction
- Agent #4: Leverage information from Agents 1-4 to decide whether or not to proceed with the race
Challenges we ran into
Training XGBoost was one of the toughest area. Initially, R^2 was pretty low for both cross-validation and testing data along with tolerance accuracy %. Initially, I hyperparametrized through trial and error some grid combinations to work with until all these criteria were accurate. However, I added more input variables and leveraged correlation map to determine which input has a strong correlation and utilized that as the additional input parameters. Later on, I realized R^2 gap between training and test set told me it was underfitting based on the threshold I tuned it. With research, I realized this fact is not true so I omitted this part. However, I realized that the computation for accuracy was time-consuming. As a solution, I reduced the list of trial and error in hyperparameters of each variable and reduced max_depth and min_child_weight, while increasing the regularization value. The other issue I ran was using Replit, especially asking it to code the frontend from Github repo I integrated via MCP. During that time, my free credit ran out. As a solution, I relied on using FastAPI to connect frontend and backend and integrated Claude MCP to my Github repo to do all the remaining work instead.
Accomplishments that we're proud of
An accurate model, validated honestly. The XGBoost efficiency model scores R² 0.992 on held-out test data, R² 0.993 ± 0.0008 across 5-fold cross-validation, and 98 % of predictions within ±0.1 percentage points. The test set is never touched during tuning. If the model fails any gate, it can't clear a car.
What we learned
Throughout this journey, I have learned how to leverage Claude especially using Skill to create agent for me to build some parts of code like Agentic AI, CLAUDE.md to set rules to remember and specification files to remind AI the expected logic of what this project does. Additionally, I have learned how to train XGBoost and check accuracy level. Moreover, I learned how to connect softwares via MCP (e.g. Replit to Github Repo OR from Github Repo to Claude).
What's next for LithiumCombustCheck
Consider redesigning the architecture of instead of gatekeeping at one error once flagged in chronologically, see them holistically (e.g. after submit if cannot proceed. It shows all the statistics of the issue, such as overheating pass/fail with recorded value and hazard risk threshold messages, thermal risk and prediction as a whole rather than isolating into one issue, so that we can see more than one issue). Do not stop at one point keep going if one part failed. Connecting reading measurement sensor of the battery whether it is temperature, voltage, current and battery % and photo shooting of the time spent on charging to the device so that an AI agent can automatically parse these data into inputs instead of users manually typing them.

Log in or sign up for Devpost to join the conversation.