-
-
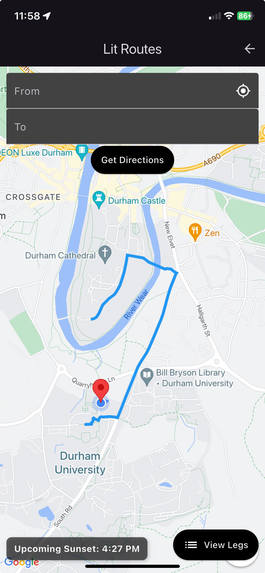
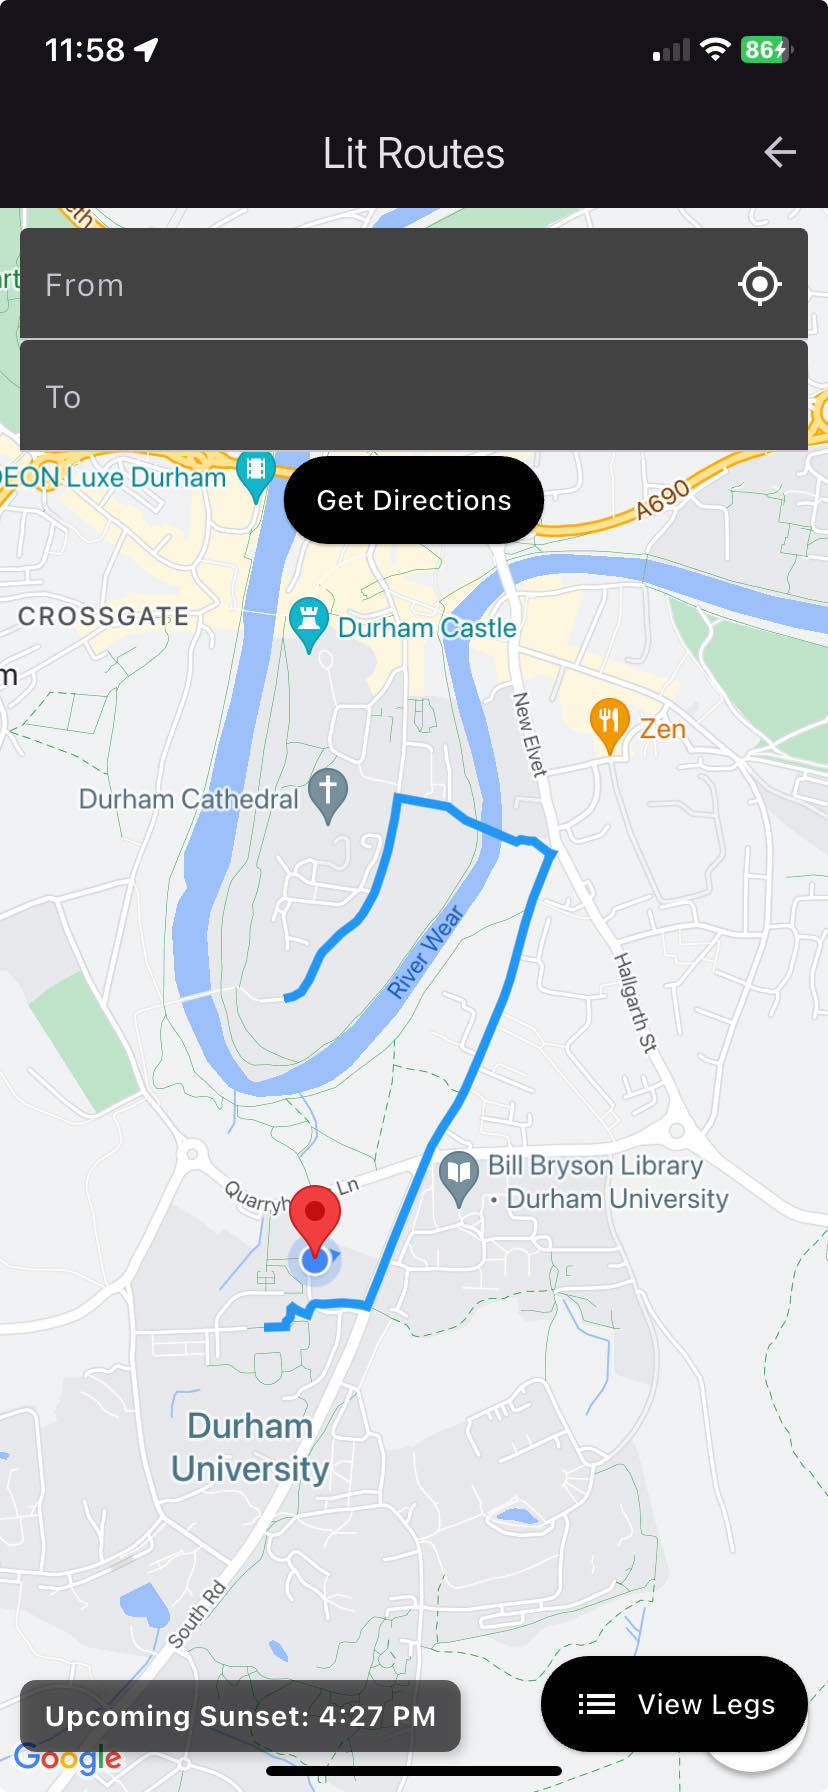
App, main view
-
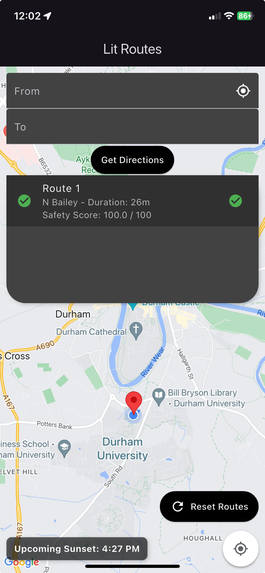
App, choosing a route
-
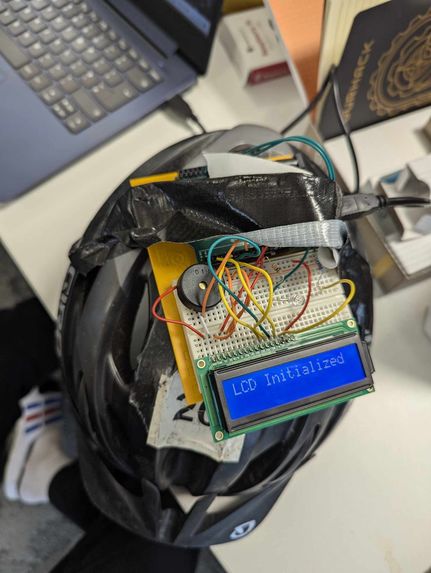
Lit-hat device
-

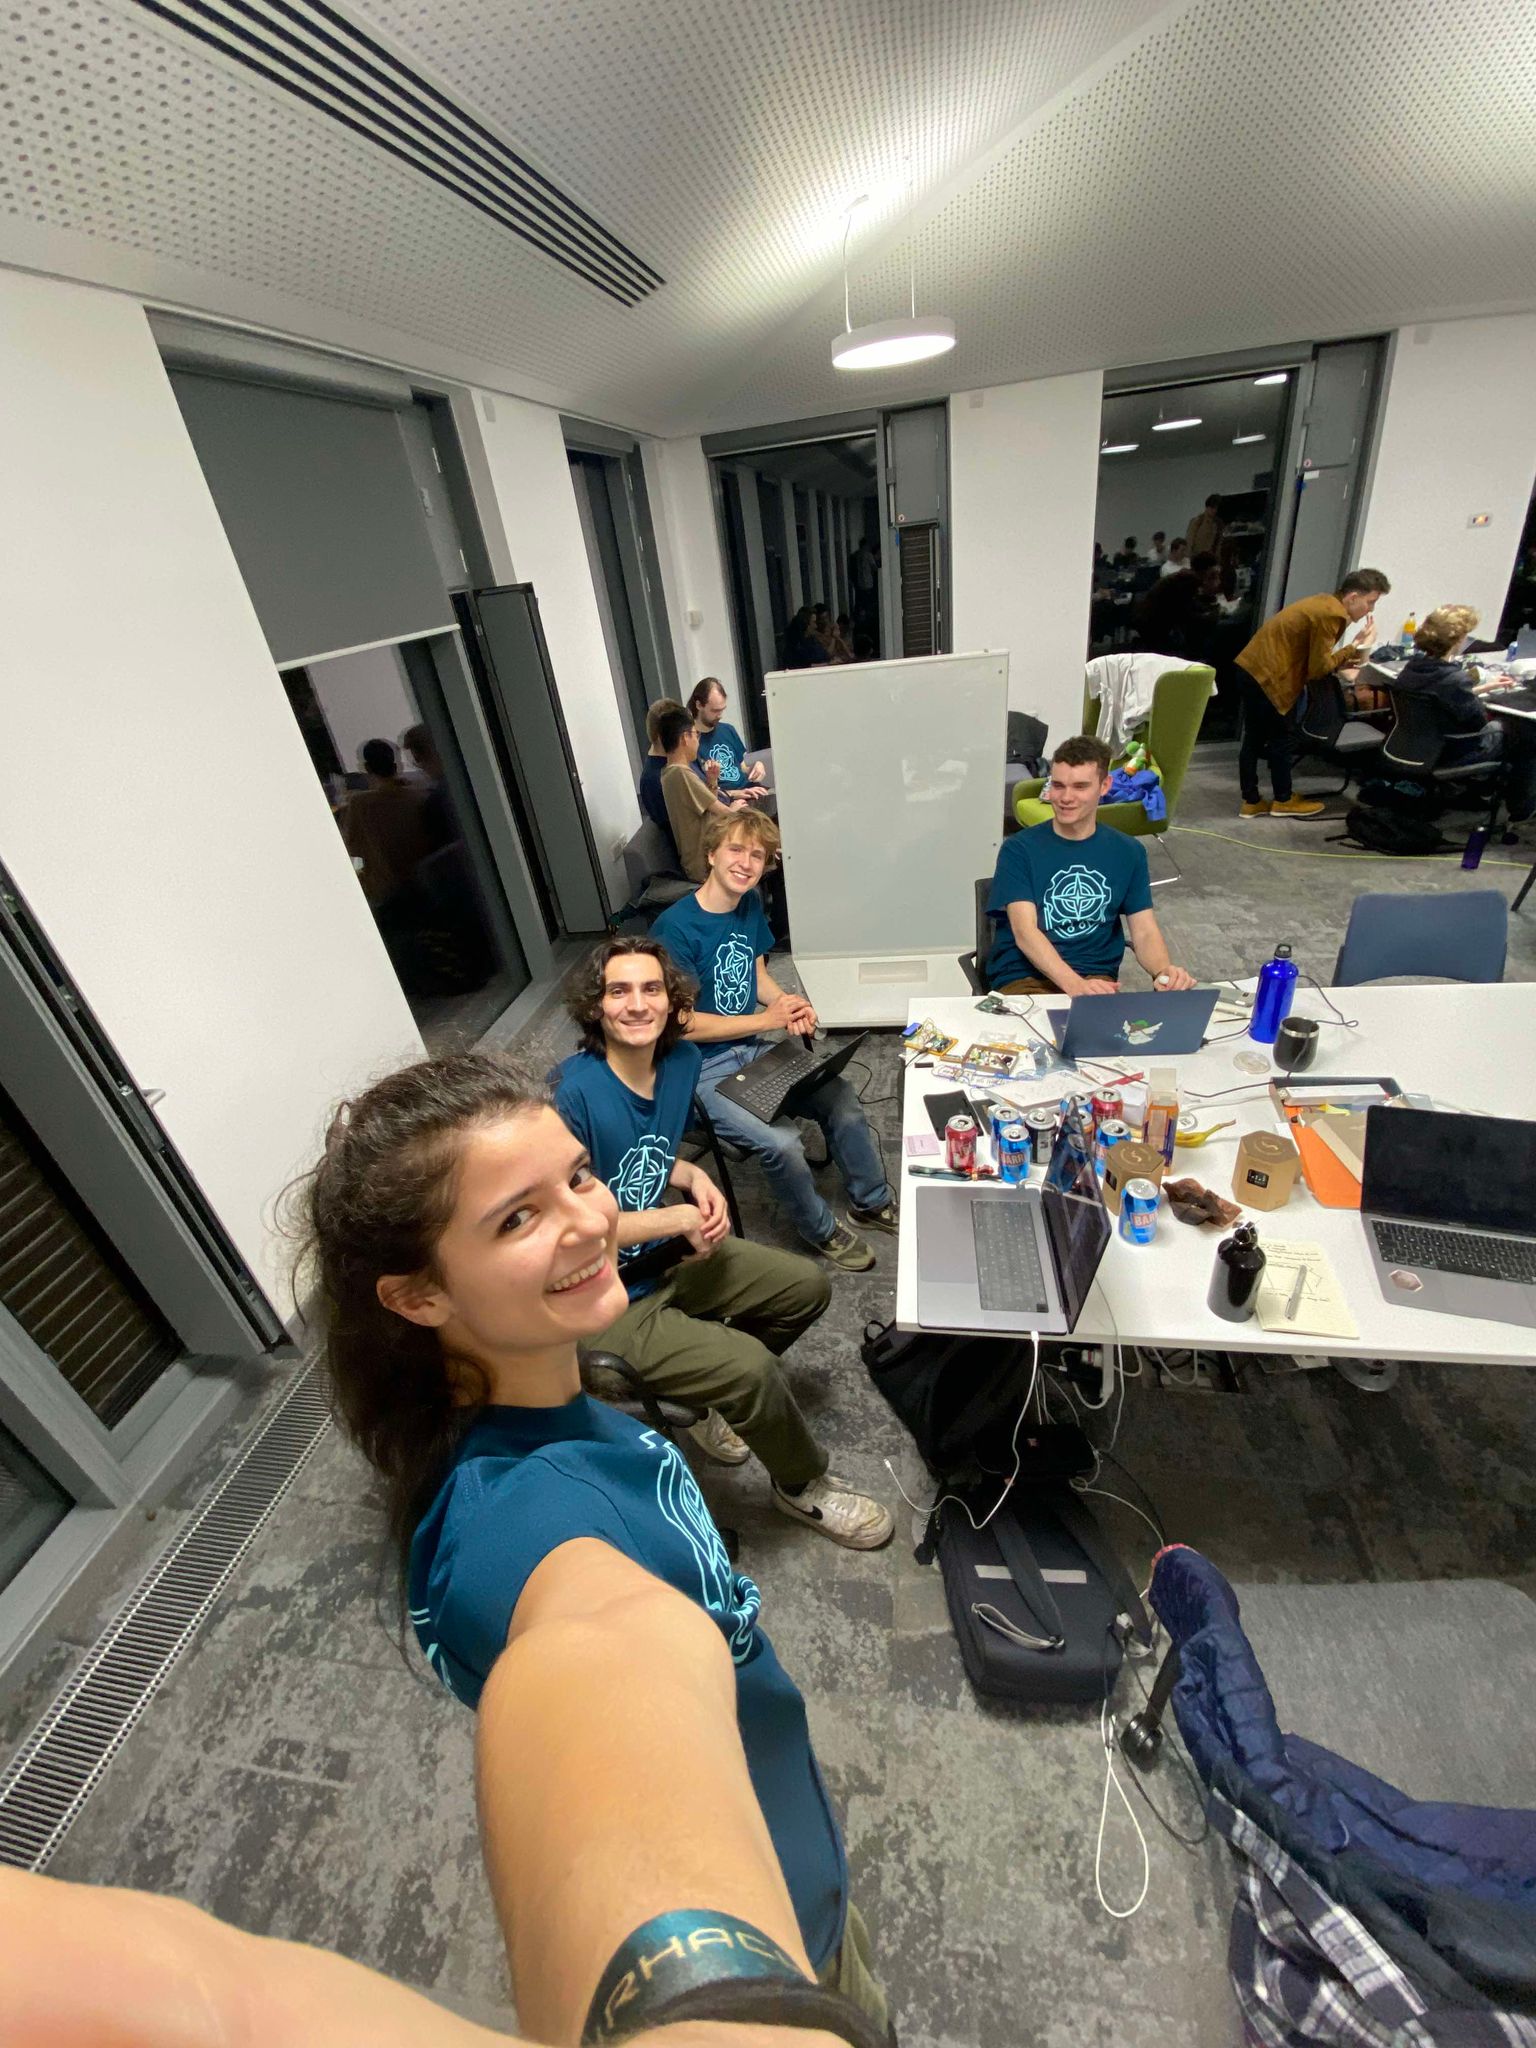
Team photo
-
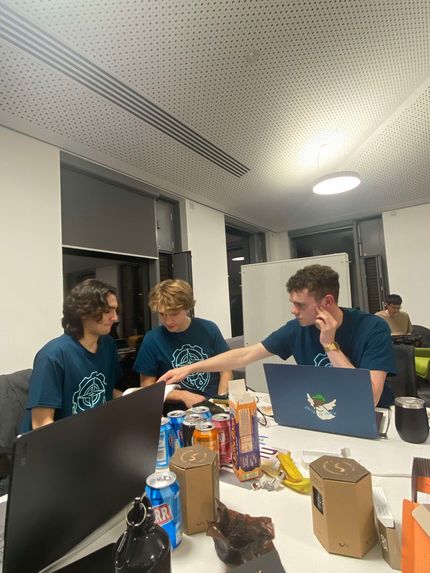
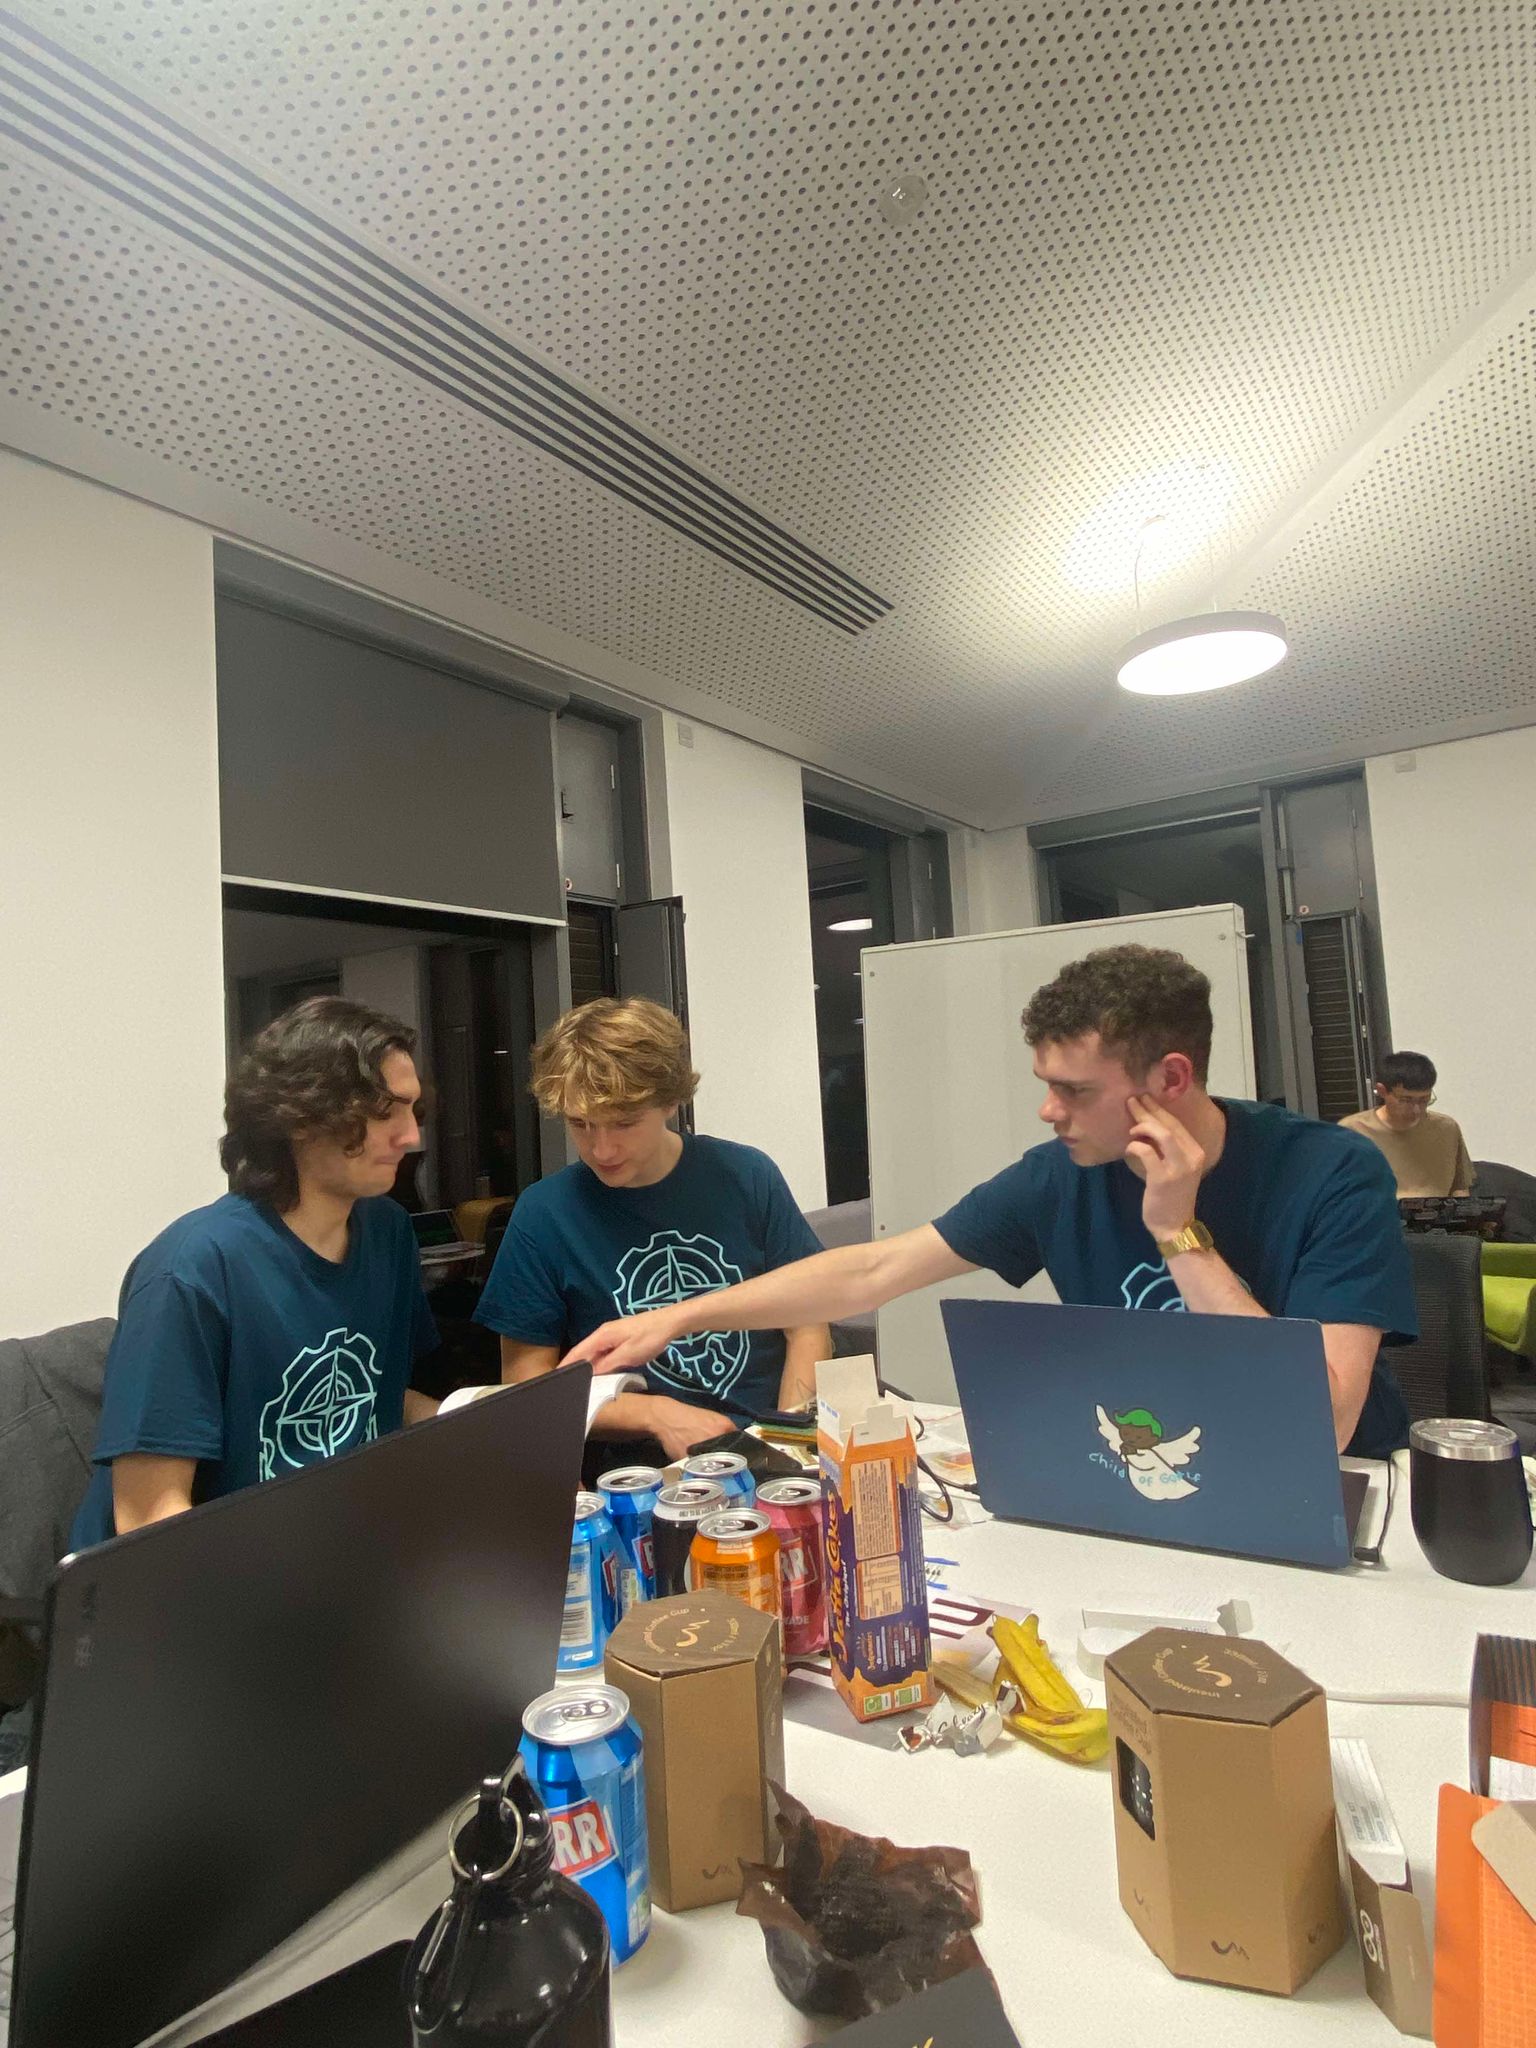
Team in action
-
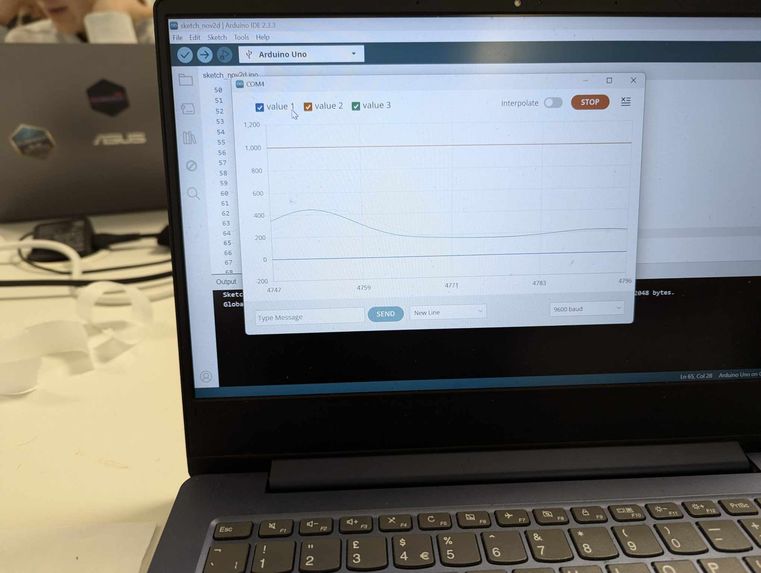
Real-time plotted data


Inspiration
Freshers at Durham University are told during their first week to avoid unlit routes at night, but as soon as they try to make a simple journey such as from the main lecture site to the train station, navigation apps send them down the river path. This poses a number of risks as it is not only pitch black, but passes right by the River Wear whose strong current has been the cause of many accidents in the past.
Research conducted by the Lighting Research Group from Sheffield University suggested that crime rates are 36% lower on lit paths vs unlit ones and people value lit routes at night for this very reason. Clearly there is a market for a better navigation system, which takes route lighting and general safety into consideration.
Our app is intended to be used by people that are new to a city and hence to whom knowing safe routes is very valuable.
What it does
Lit Routes is an app similar to navigational apps such as Google Maps. The key difference is that Lit Routes suggests multiple possible routes and scores them by how ‘safe’ they are at night. The user can then pick a suitable route, based on ‘duration’ and the ‘safety score’. The user can also see the legs of the route and how ‘safe’ they are. The app also tells the user when sunrise or sunset is so they can plan ahead.
We built a wearable hat device that collects light intensity data in real time and stores it. It alerts the wearer when light levels go below a certain threshold. This is inspired by the Google Maps mapping car used to create ‘street-view’; our hat would eventually create ‘litness-view’. In the initial period of the app, before we have enough user-given data, we could recruit volunteers to walk routes and collect light and GPS data in tandem.
How we built it
In our team of four, we split into a marketing team, an app developer team and two electronics engineers. The marketing team was responsible for our (soon to be) award winning web design and logo, the app developer worked laboriously to create a usable interface that allowed users to select safe routes, and the electronic engineering team built a helmet device for data collection, utilising the Arduino from the hardware stall.
The app: We used Dart and Flutter to build our platform. Flutter is a cross platform language that makes applications for Android, iOS, Web, Windows and macOS. We also used a google cloud console for the map APIs, and all of the data we collect in the future from customers and volunteers using our Lit-Hat (see below) can go to google cloud console and be stored anonymously for GDPR reasons.
The Lit-Hat: This wearable device consists of a bike helmet with an Arduino attached. A laptop placed in a backpack powers the device and stores collected data. On the Arduino breadboard, a photodiode combined with a potentiometer gives an output analogous to light intensity, and the Arduino code reads the intensity and displays a real-time reading between 0 and 100 on a liquid crystal display. When the light level passes below 20 an alert goes off on a speaker to tell the wearer that the route is ‘unlit’.
The website: We used the MLH discount code from the opening ceremony to buy a free domain (litroutes.co) and built a website using Google sites that details our aims, mission and our team structure. The website is currently listed at https://sites.google.com/view/litroutes/home?authuser=0. As the domain we bought is untrusted so we decided to use the google sites domain.
Challenges we ran into
Our first challenge was data. Initially, we planned to use a database to inform our app. There do not currently exist databases that contain information on the light levels of streets and paths, so we had to come up with a method of collecting this data. The app has a function that allows users to submit their own score of how light a leg of a route is. The average user light score could then be used by the app to suggest better routes. As the app grows and we have more users collecting data, the app would become more accurate and reliable.
Another problem was data collection for the initial app. It would be difficult to launch the app with no starting database, so we decided to come up with a system that can help us form a starting base of knowledge and would be able to aid in data collection throughout the whole process. Starting with the idea of the Google car which drives around collecting map data for Google, we designed a wearable device that measures and records light intensity. The plan would then be to recruit volunteers to walk around wearing this device and upload the light intensity data collected onto our app. We had also hoped to implement GPS into this system but with the options from the hardware stall, we were unable to. Currently the GPS info has to be collected separately by a mobile phone.
We hoped to make the wearable hat more compact by using a Raspberry Pi for storage instead of a laptop. However, we were not provided with a microSD to SD card converter or monitor, keyboard, and mouse so could not communicate with the Raspberry Pi.
Accomplishments that we're proud of
We built an app that actually works on a phone and has a lot of the features we had hoped to see from the start. It shows great potential as a
We are very proud of the wearable hat we made. We learned so much in the process and had a great time. A couple of us have had a long-term interest in using an Arduino and Durhack provided us with this opportunity and for that we are very grateful.
Most importantly, in the past 24 hours we became closer as a team and made some new friends!
What we learned
We learned how to create an app and use APIs within it: 3 out of 4 of us had never done this before. We learned how to create websites, about web-design, as well as how to buy a domain. None of us had used an Arduino before so it was fun to experiment with the starter kit and to turn it into a real device - this was extremely satisfying and we hope to get our hands on one in the future.
What's next for Lit Routes App
To create a weighting system based on user data - we want to implement a ‘litmus’ system (see what we did there?) that labels legs of routes with a litmus value based on the light intensity data we had for that path. This would allow us to calculate a litmus value for each possible route output. Then we could take a variety of factors into consideration, including the speed of each route, the lightness, the users preferences of path , in order to give the best possible route to our user.
To make this app fully usable, its behaviour would need to change with the seasons. We need to implement automatic changes to how it suggests routes based on when sunrise and sunset is. Eventually we could integrate weather into it: how light levels change with the moon and the weather.
Built With
- dart
- python


Log in or sign up for Devpost to join the conversation.