-
-

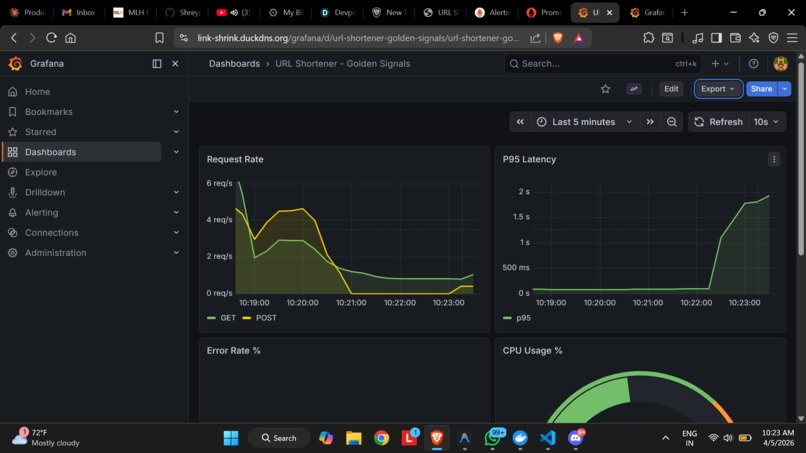
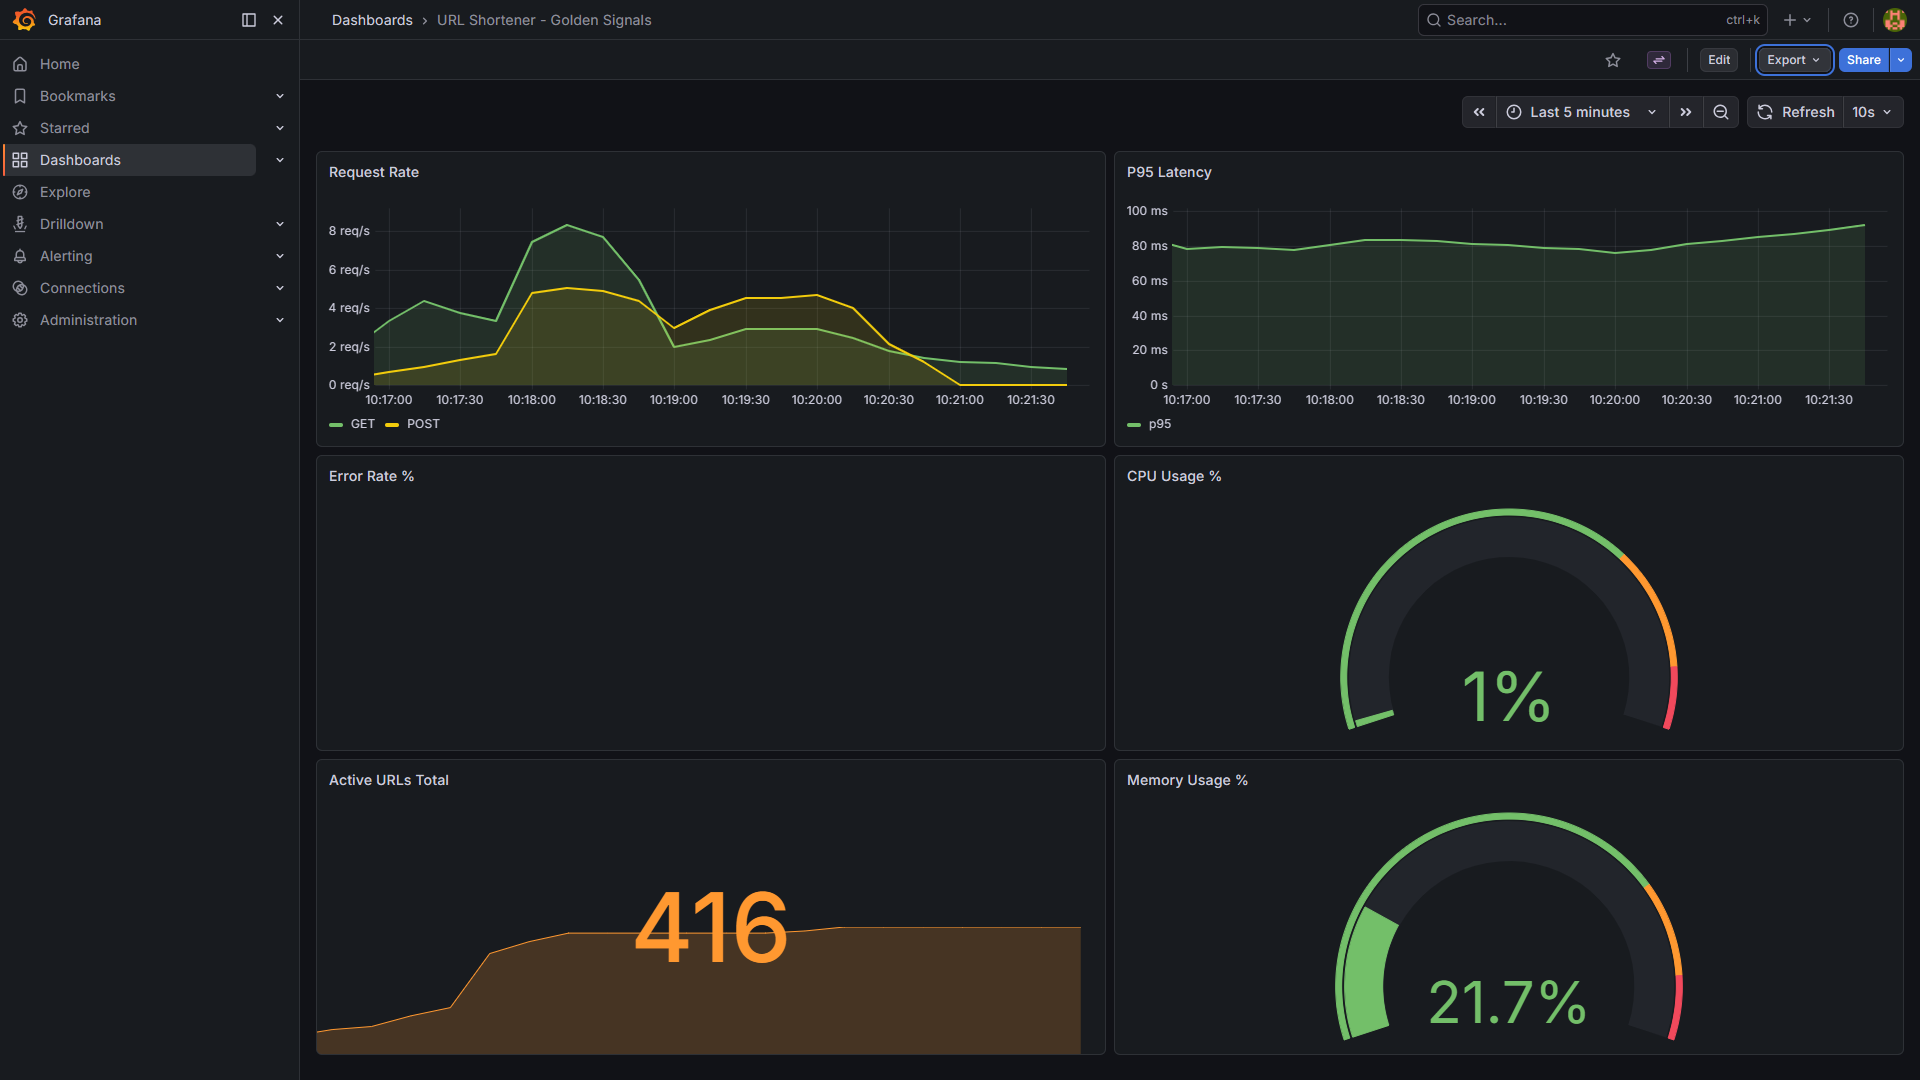
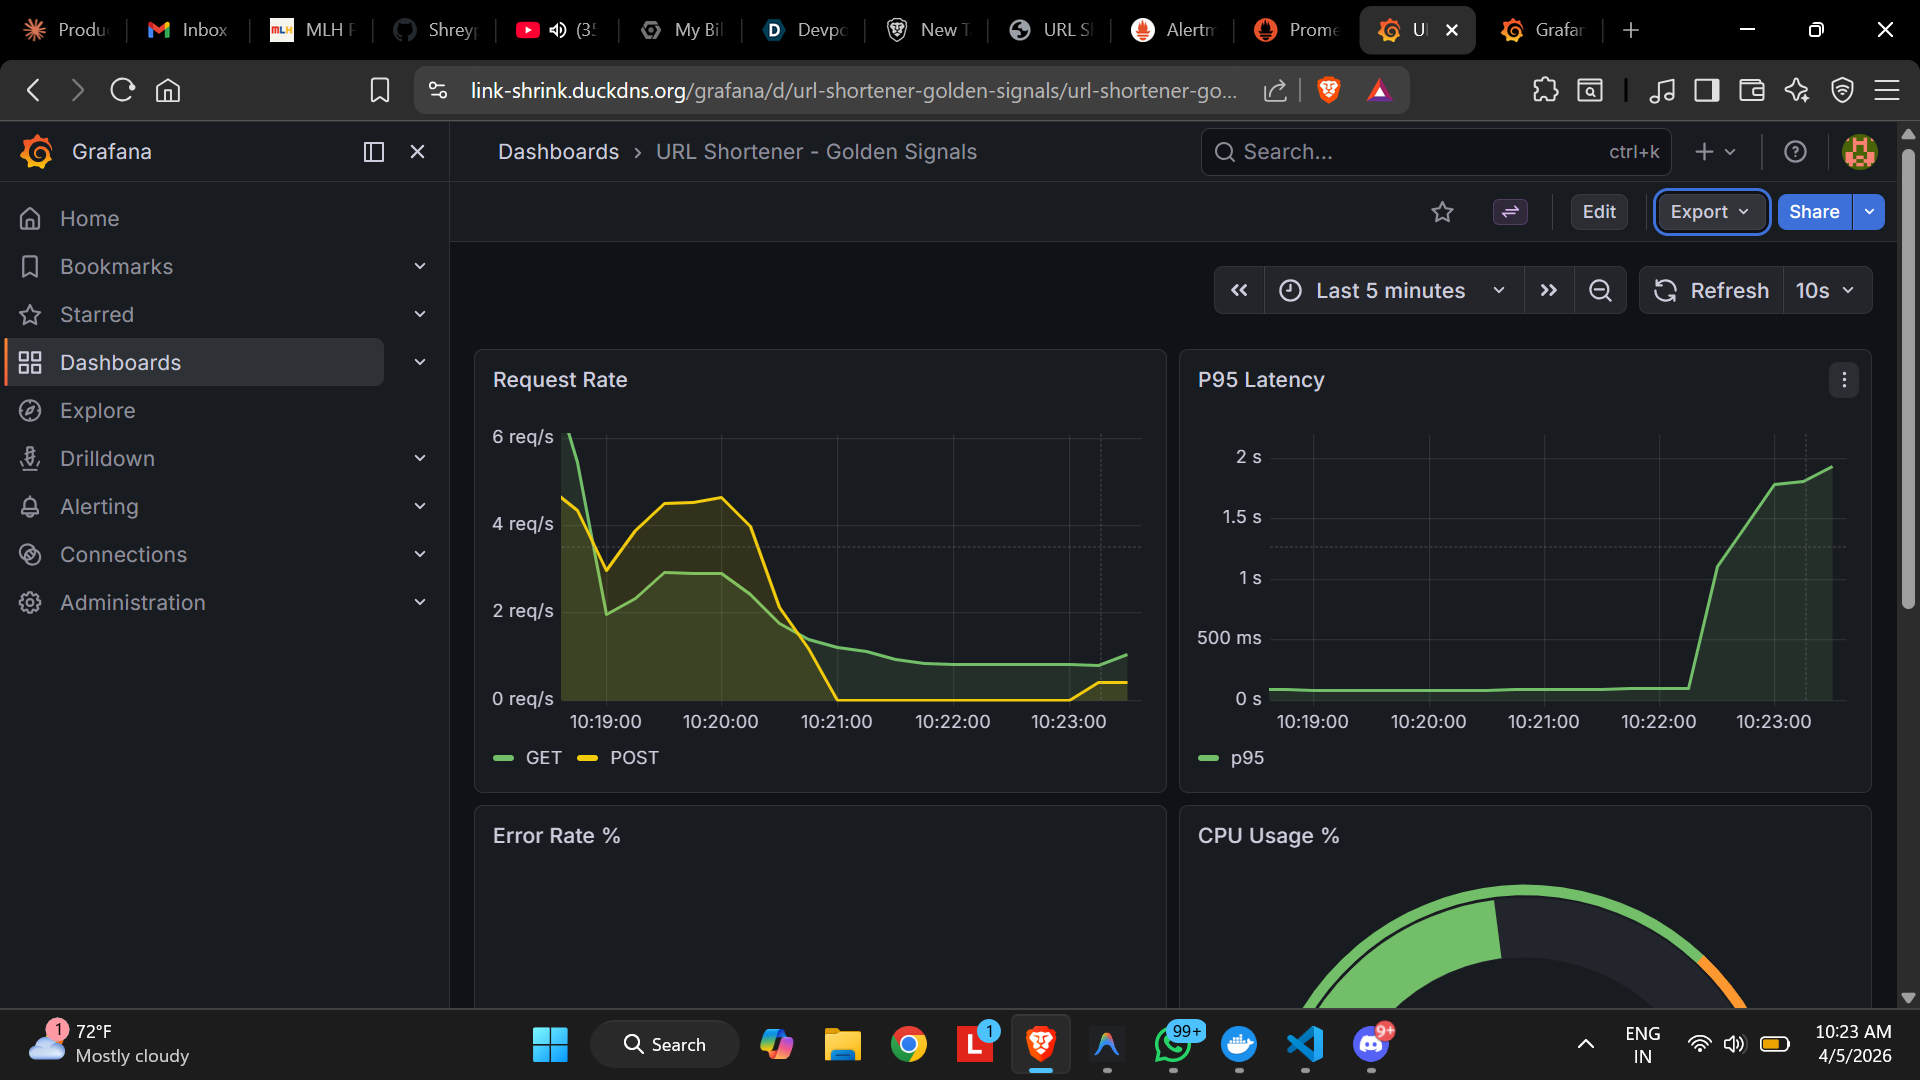
Grafana Observability Dashboard
-
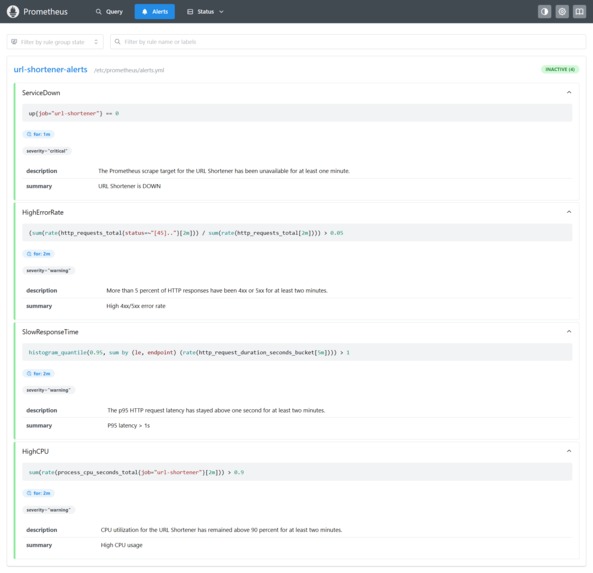
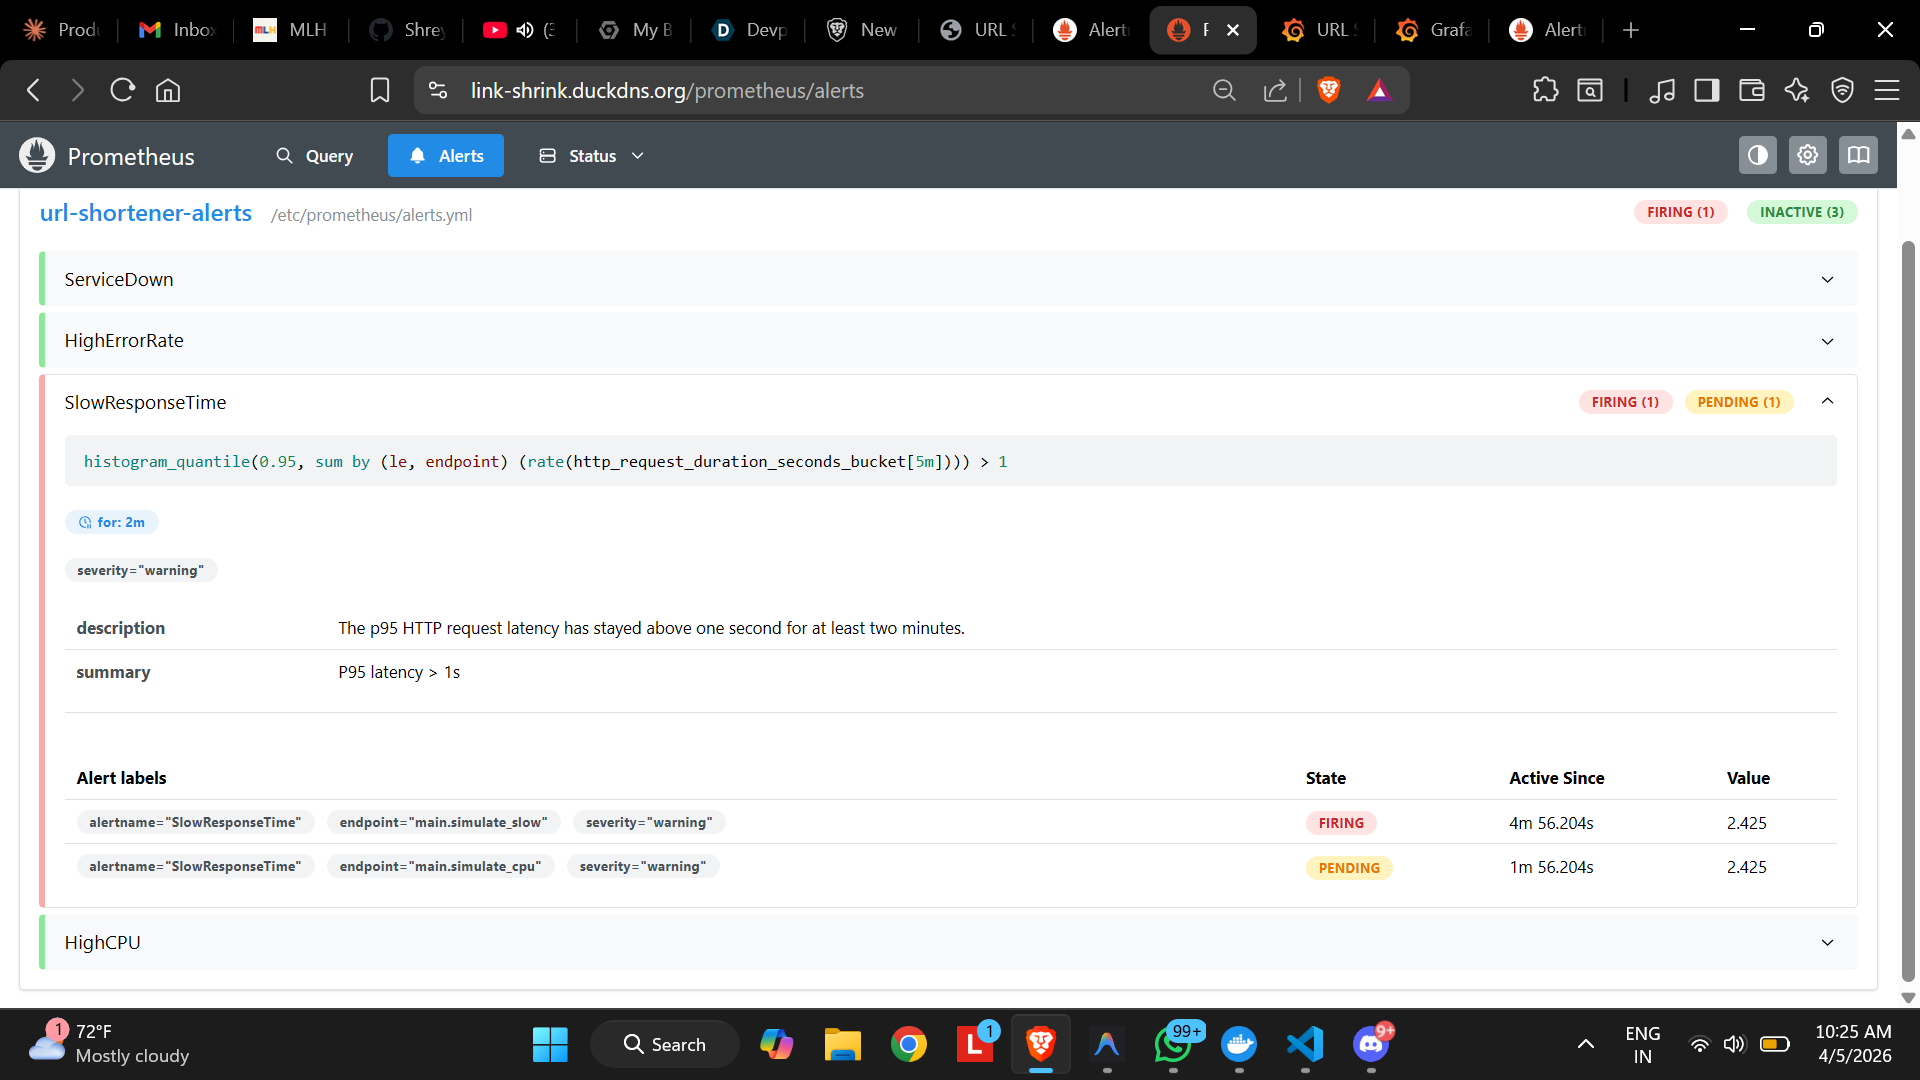
Prometheus Alert Rulebook
-
SlowResponse TIme Visibility (Latency Reaching 2s)
-
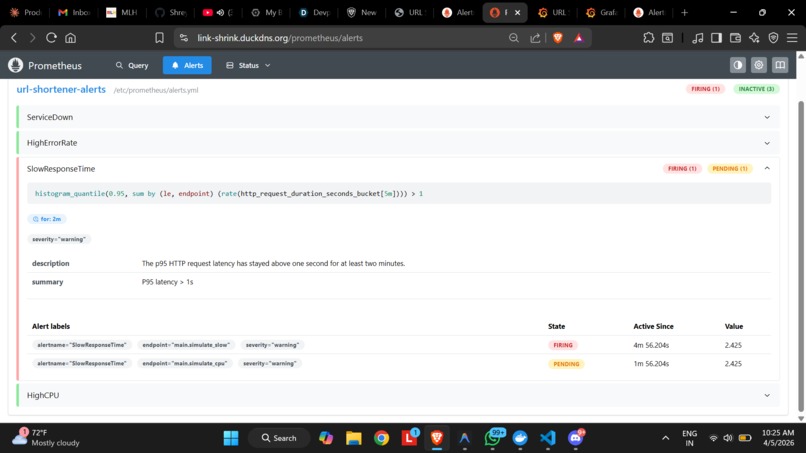
Prometheus Firing Alerts
-
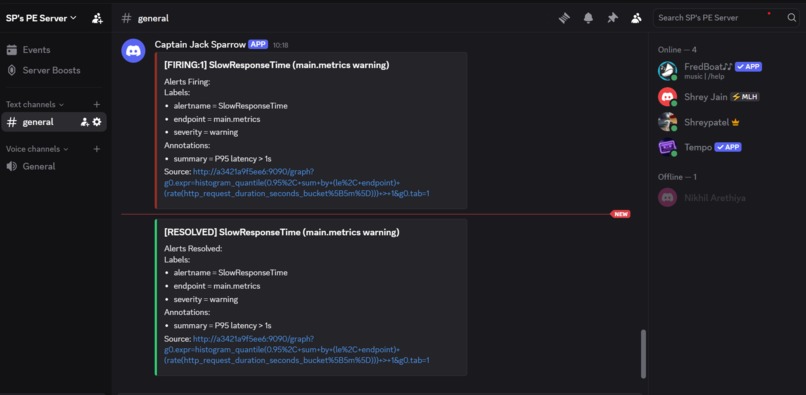
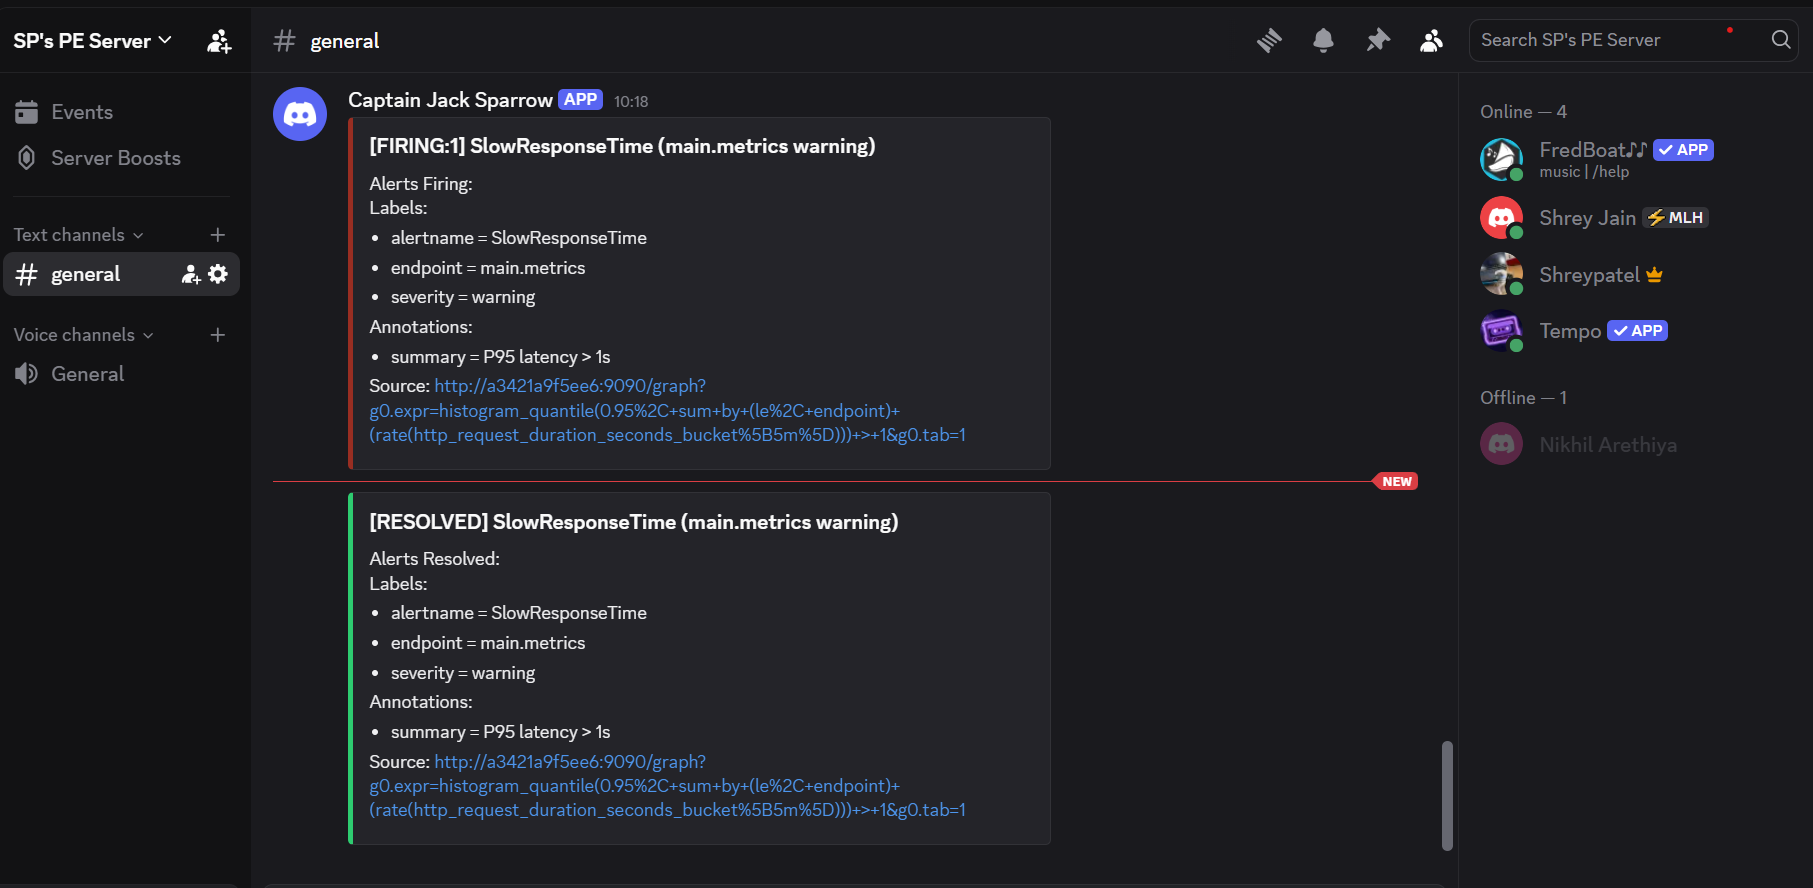
Discord Alerts And Resolution
-
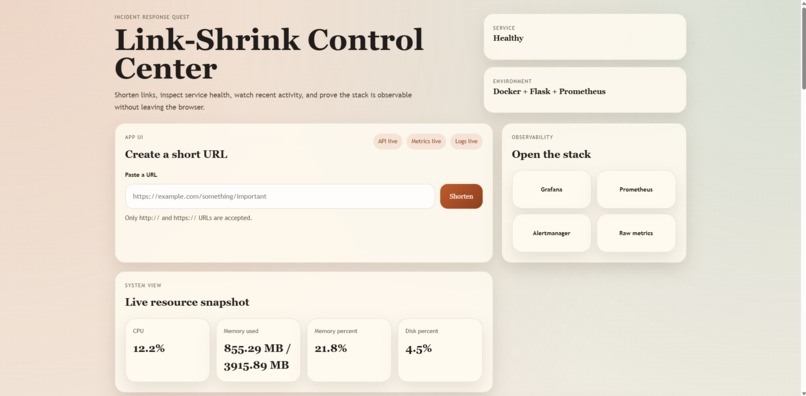
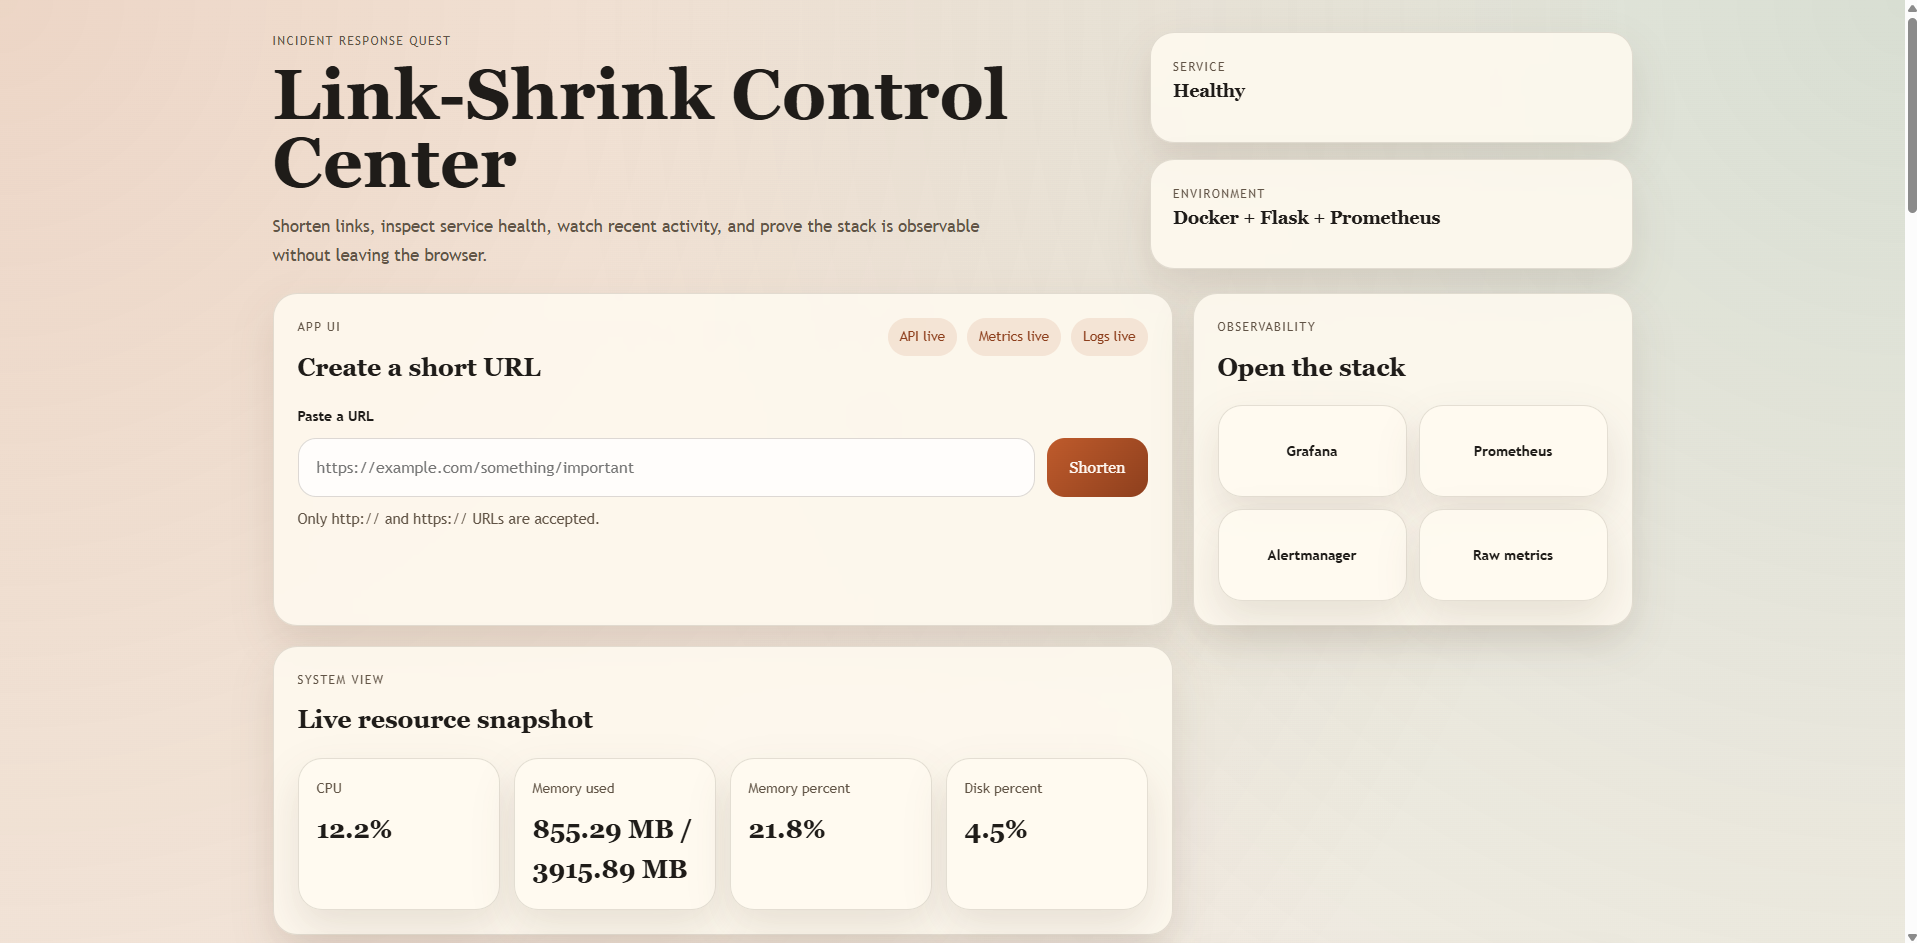
Landing Page With Dashboard Redirection Links
-
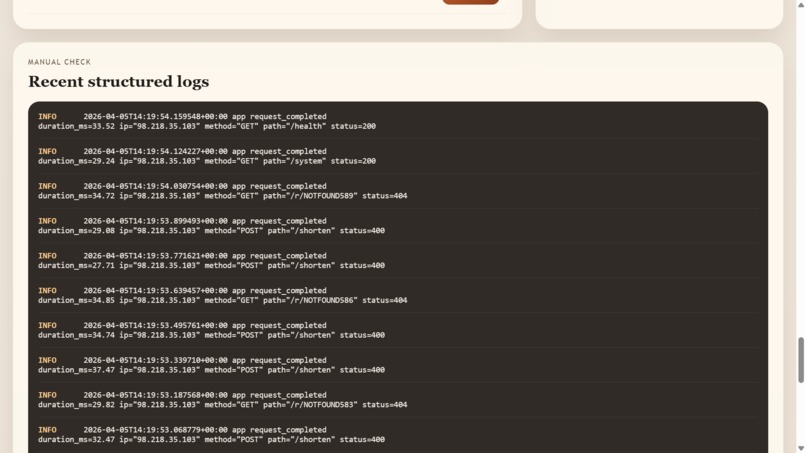
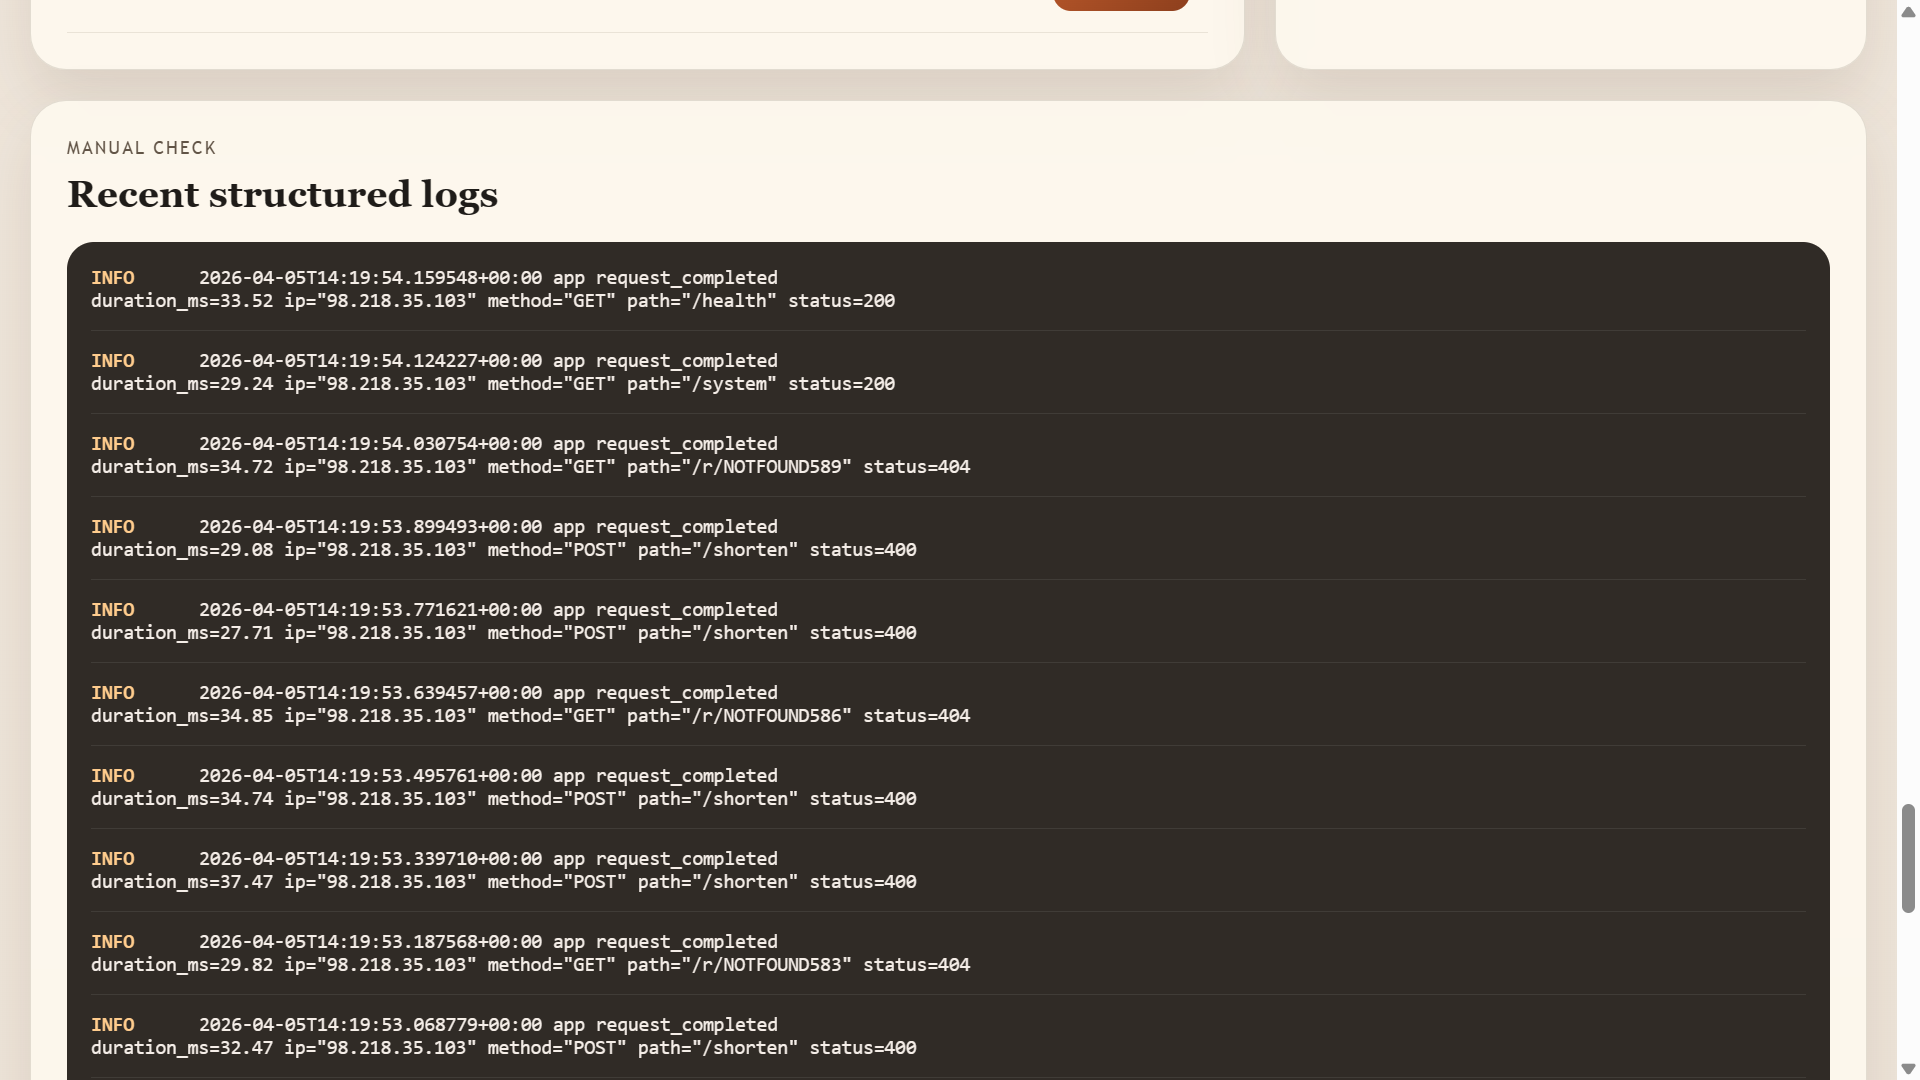
Structured JSON logs
-
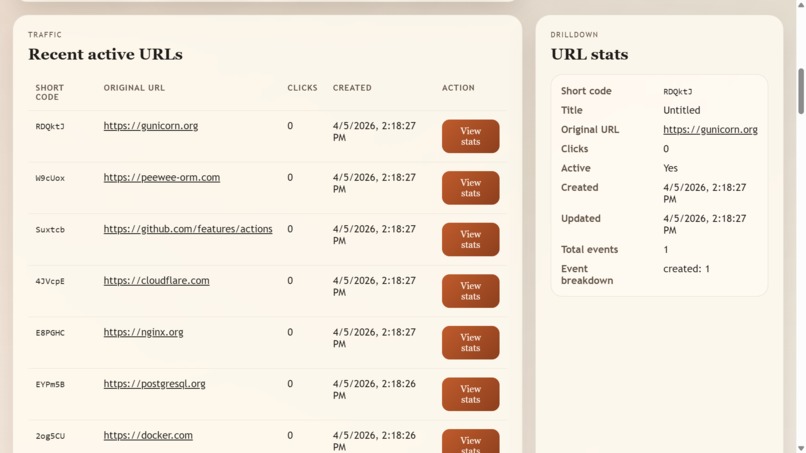
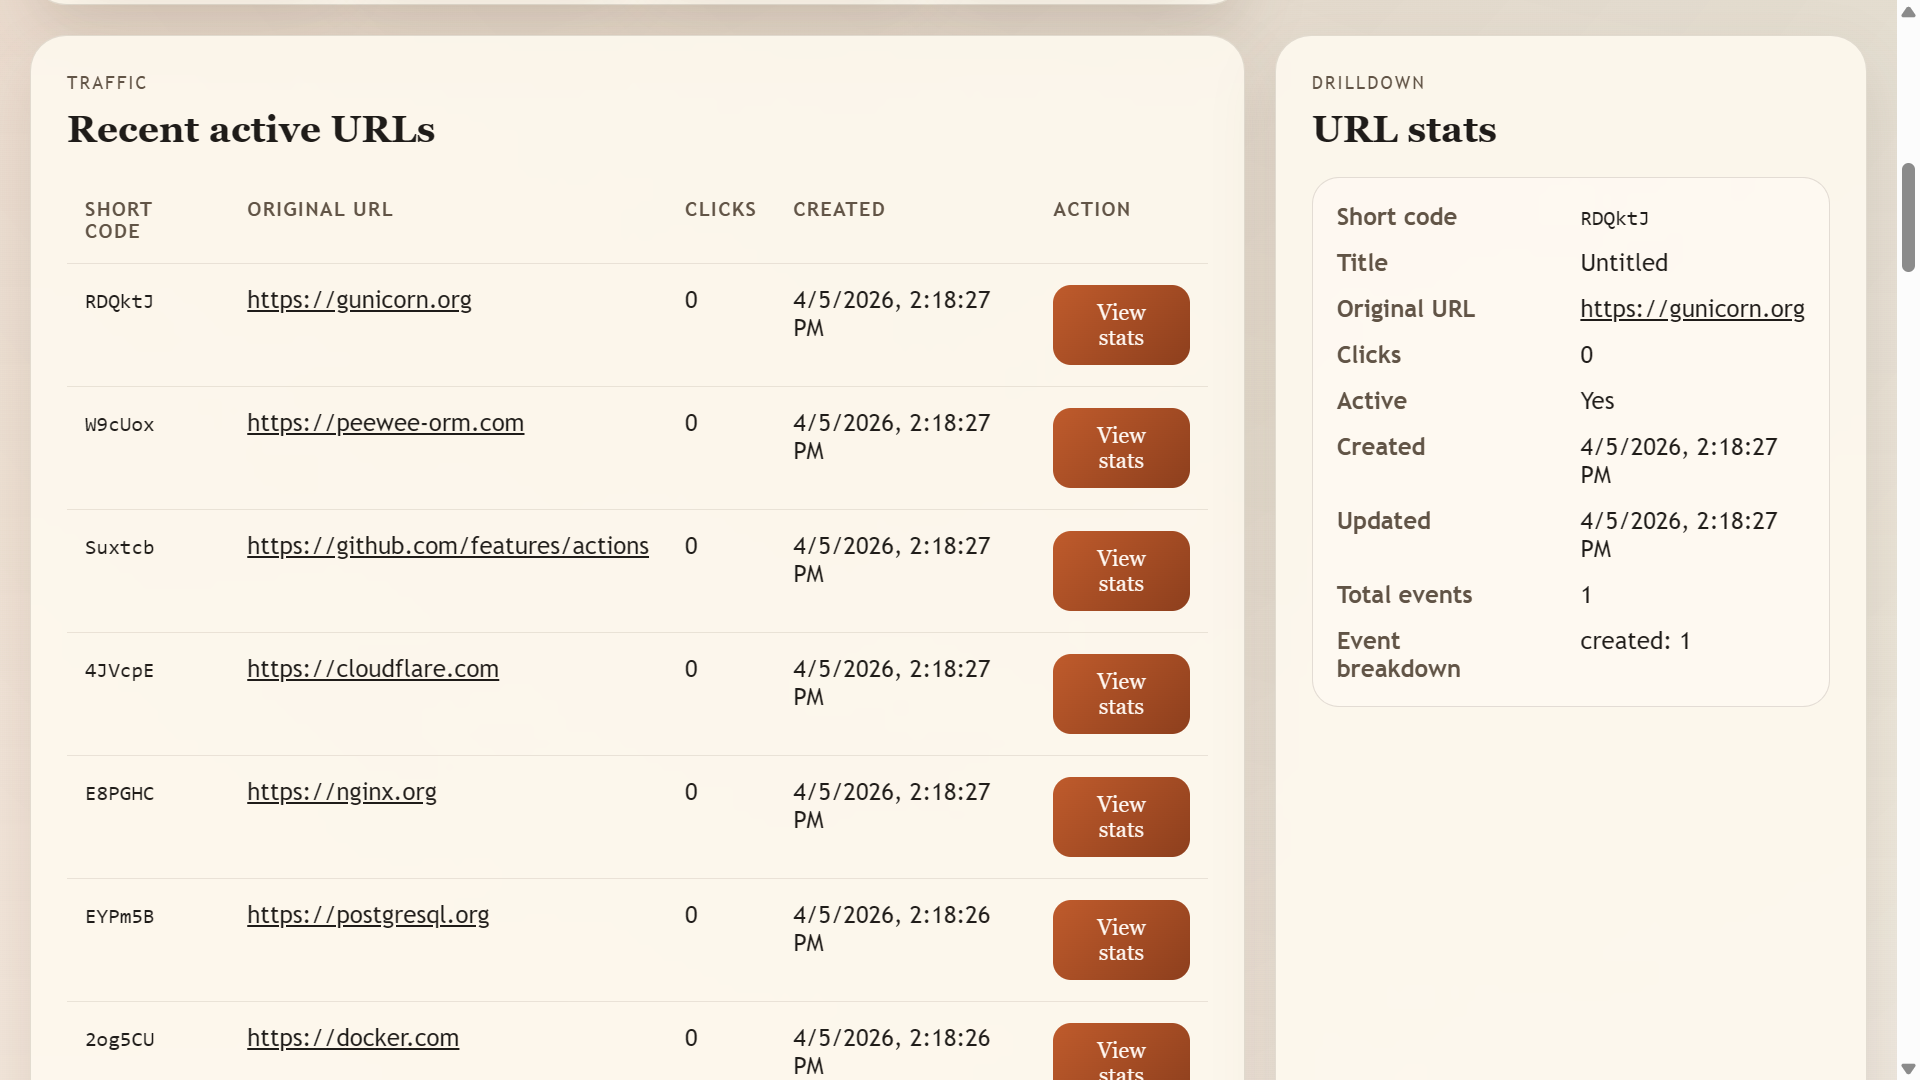
Recent Active URLs
-
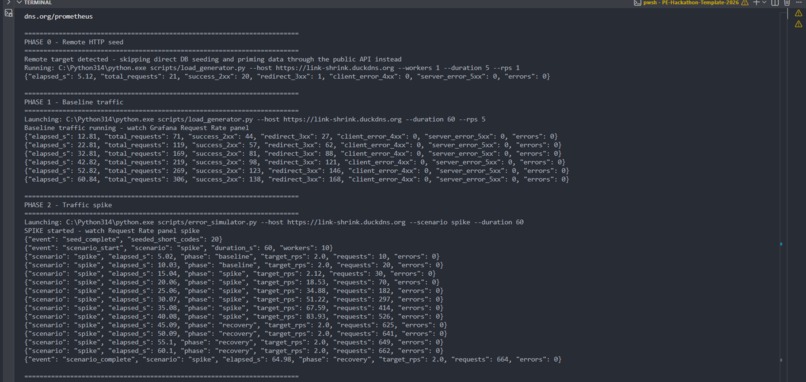
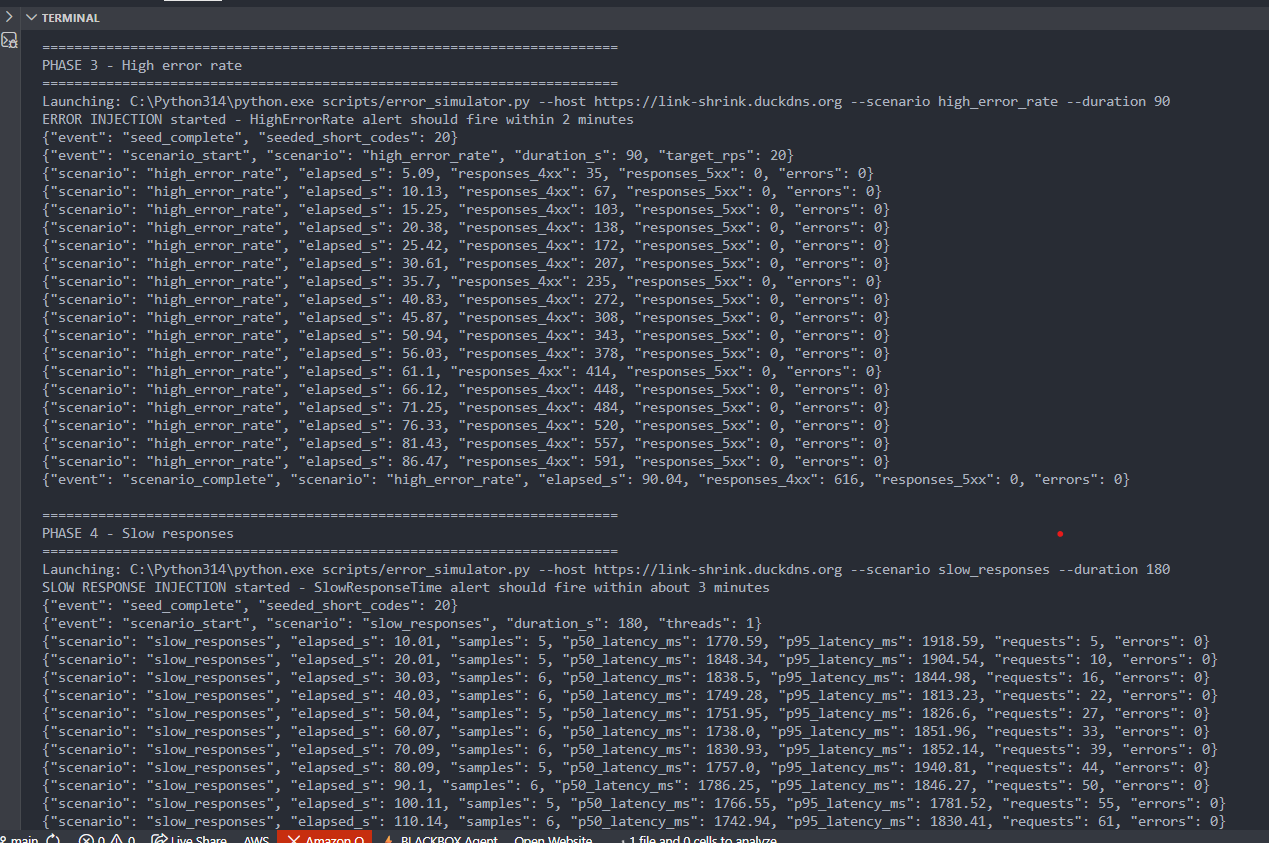
Attack Simulation 1
-
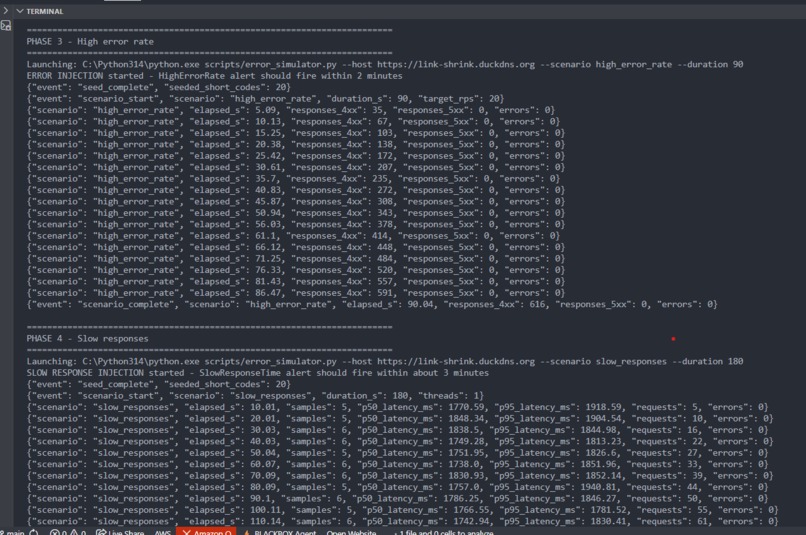
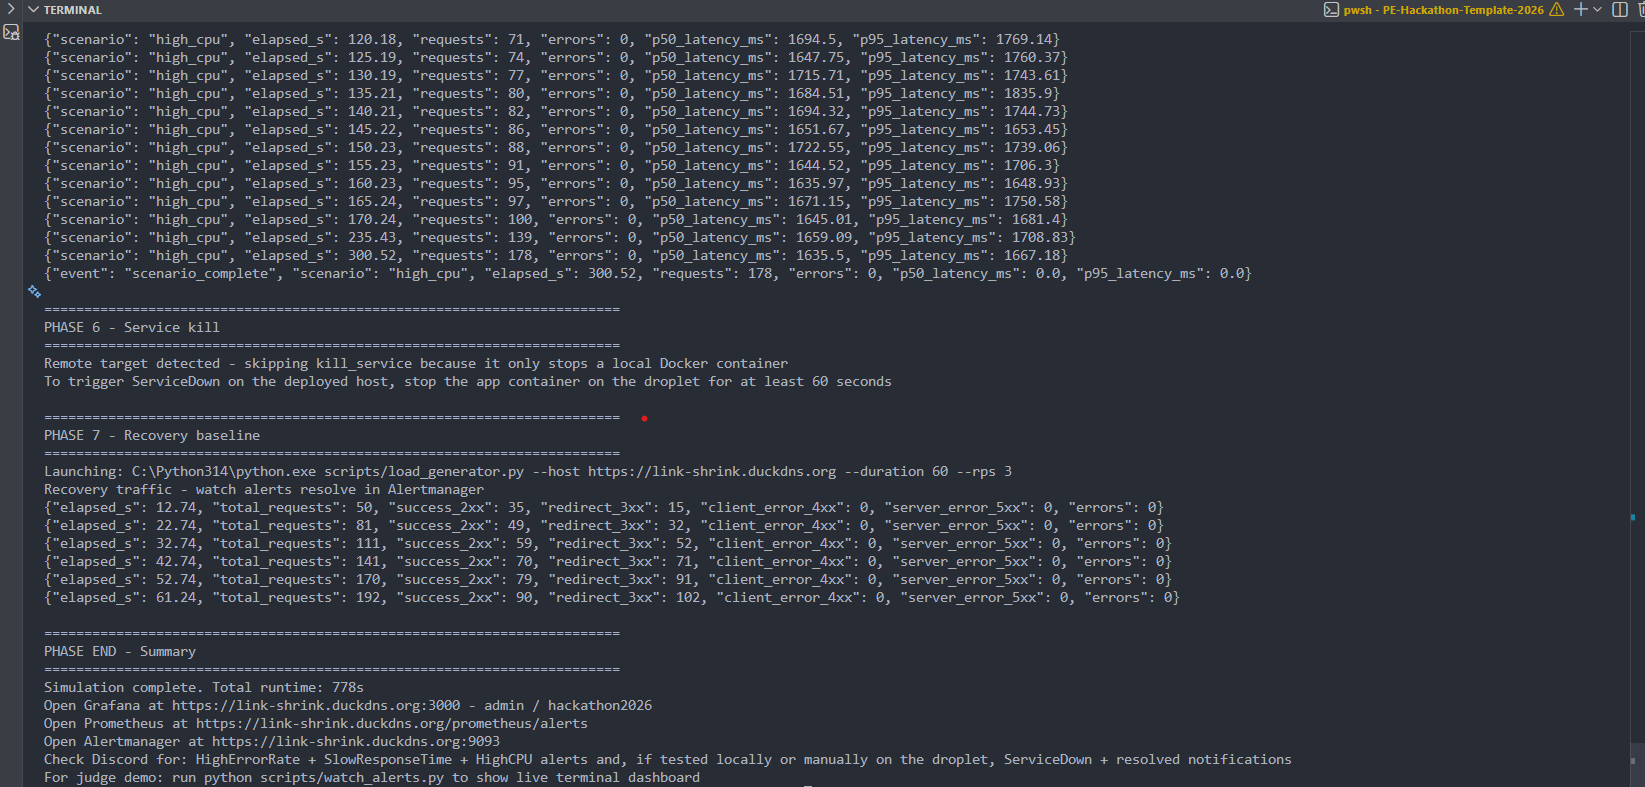
Attack Simulation 2
-
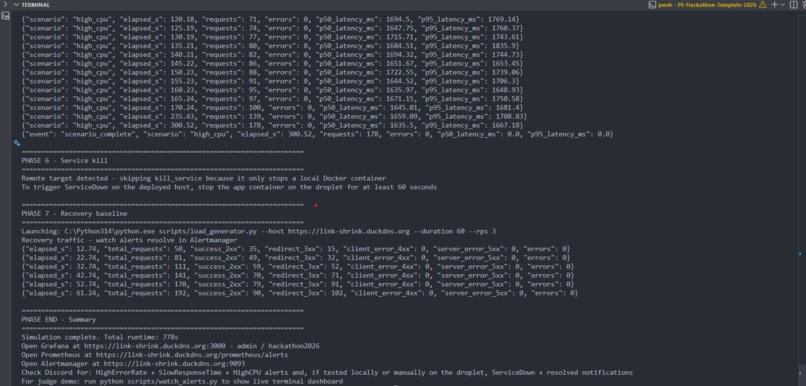
Attack Simulation 3


Short Description
Link-Shrink is a Flask + PostgreSQL URL shortener built for the MLH Production Engineering Hackathon Incident Response track. It goes beyond CRUD by adding JSON logging, Prometheus metrics, Grafana dashboards, Alertmanager notifications to Discord, a runbook, and a simulated incident investigation workflow.
Project URL
https://link-shrink.duckdns.org
GitHub Repo
https://github.com/Shreyp087/PE-Hackathon-Template-2026
Video Demo
Inspiration
Most demo apps stop at “it works.” We wanted to build the next layer: “how do we know it broke, how fast can we detect it, and how do we recover under pressure?” The MLH Incident Response track felt like the perfect excuse to turn a simple URL shortener into a small but realistic production system with monitoring, alerting, incident documentation, and operational playbooks.
What It Does
Link-Shrink lets users create short links and redirect through them, backed by PostgreSQL for persistence and Flask for the application layer. On top of that, it exposes production-grade observability:
- Structured JSON logs with timestamps, log levels, and components
- Prometheus metrics for traffic, latency, errors, and internal DB failures
- A
/systemendpoint for CPU, memory, and disk telemetry without SSH - Grafana dashboards covering the four Golden Signals
- Prometheus alert rules for service down, high error rate, slow response time, and high CPU
- Alertmanager routing to Discord with firing and resolved notifications
- A runbook for on-call response
- A simulated post-incident report documenting a realistic SEV-2 event
This means the project is not just a working app; it is a working service with the tooling needed to detect, diagnose, and respond to incidents.
How We Built It
The core application is a Flask service using Peewee ORM with PostgreSQL as the database. We kept the product simple on purpose so we could focus on operational depth.
The observability stack is built with Prometheus, Grafana, Alertmanager, and Discord webhooks. The app exports metrics at /metrics, host telemetry at /system, and writes structured JSON logs to stdout so they can be collected and inspected without directly SSHing into the server. Grafana is provisioned with a Golden Signals dashboard, and Prometheus is configured with alert rules for outage, error rate, latency, and CPU pressure.
For Incident-Response Maturity, We Added
- A runbook with alert-by-alert response steps
- Simulation scripts to generate realistic failure modes
- A post-incident report documenting a root-cause-analysis workflow
- CI smoke tests that validate key endpoints and logging behavior on every push
The service is deployed behind Caddy for HTTPS and reverse proxying, which made it easy to expose the app and the observability tools cleanly.
Built With
- alertmanager
- caddy
- discord-webhooks
- docker
- docker-compose
- flask
- github
- grafana
- gunicorn
- peewee
- postgresql
- prometheus
- python


Log in or sign up for Devpost to join the conversation.