-
-
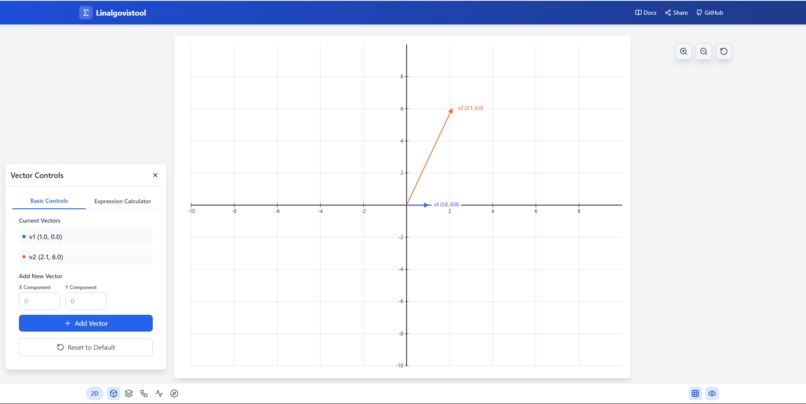
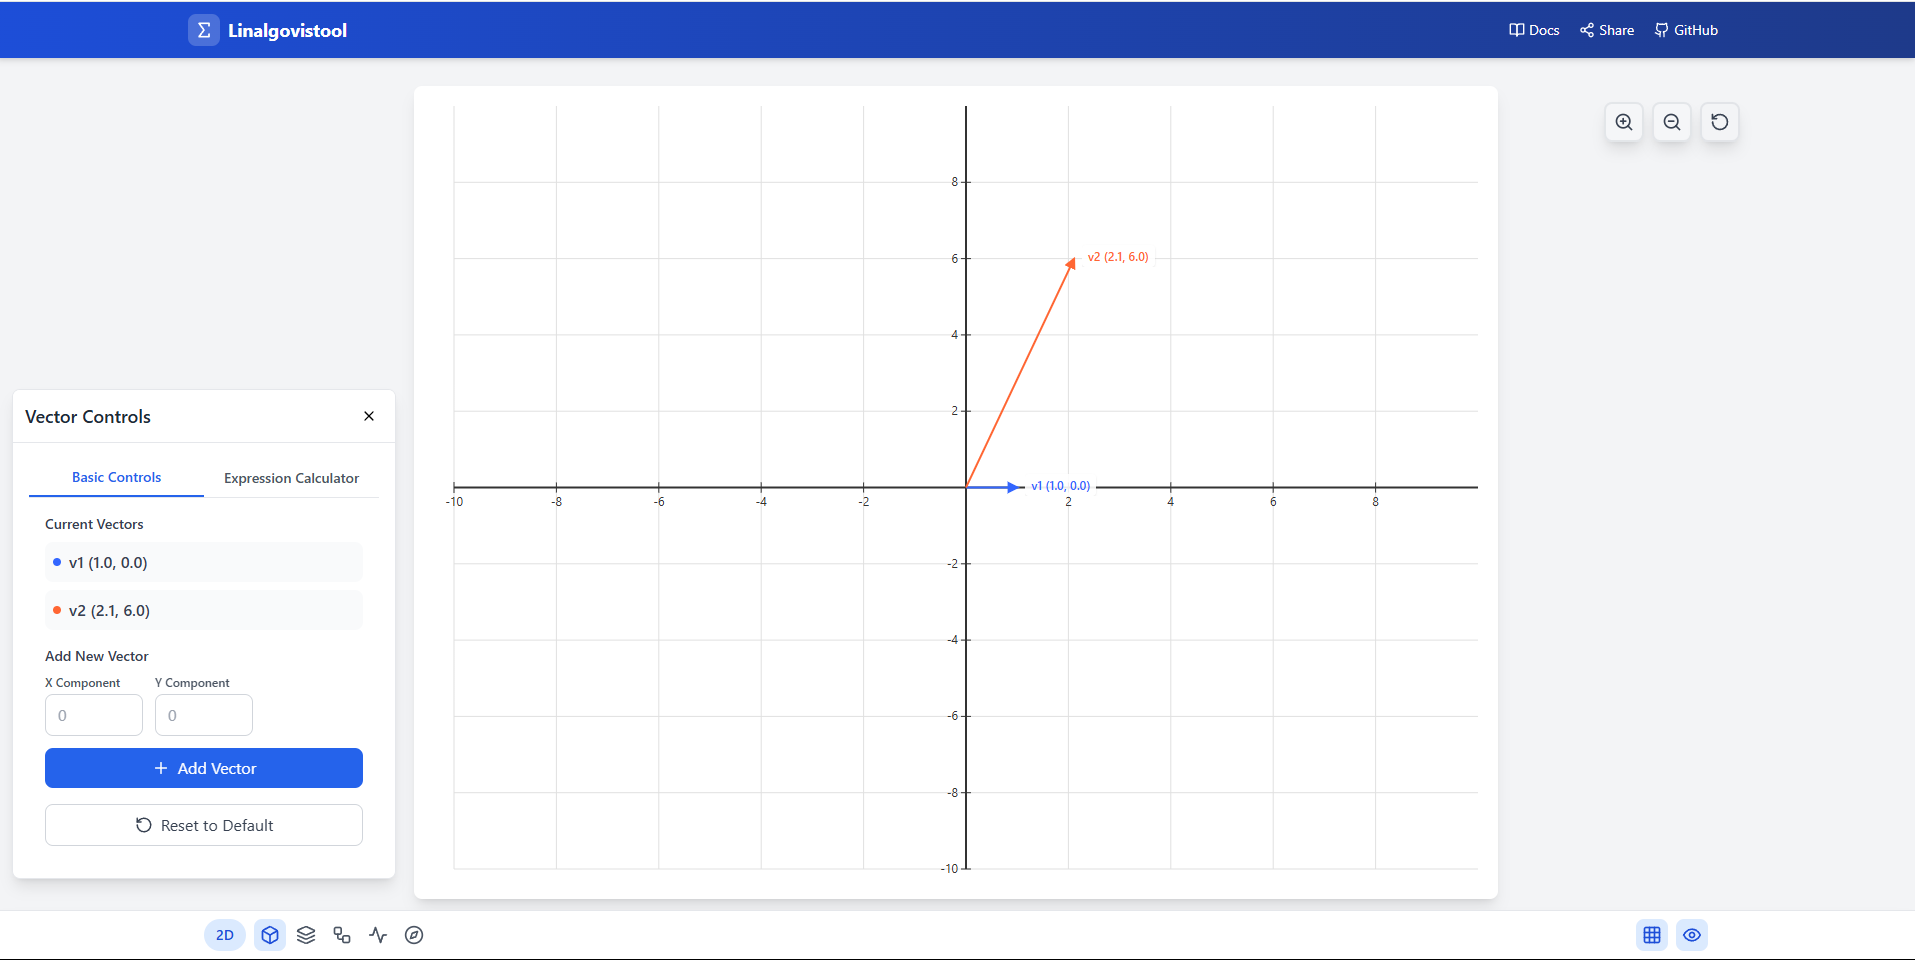
2D vector visualization
-
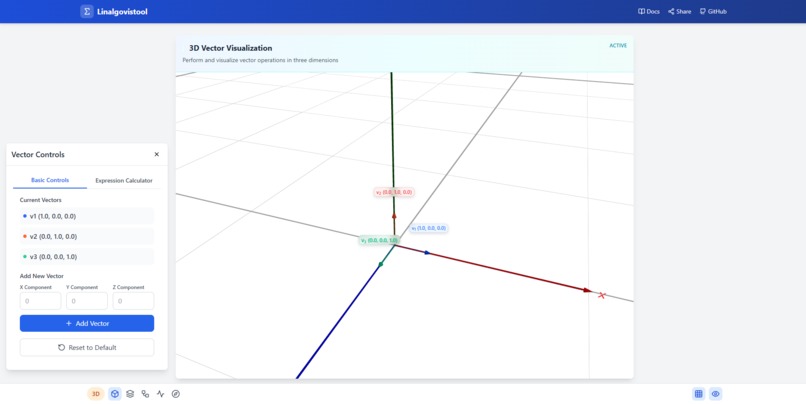
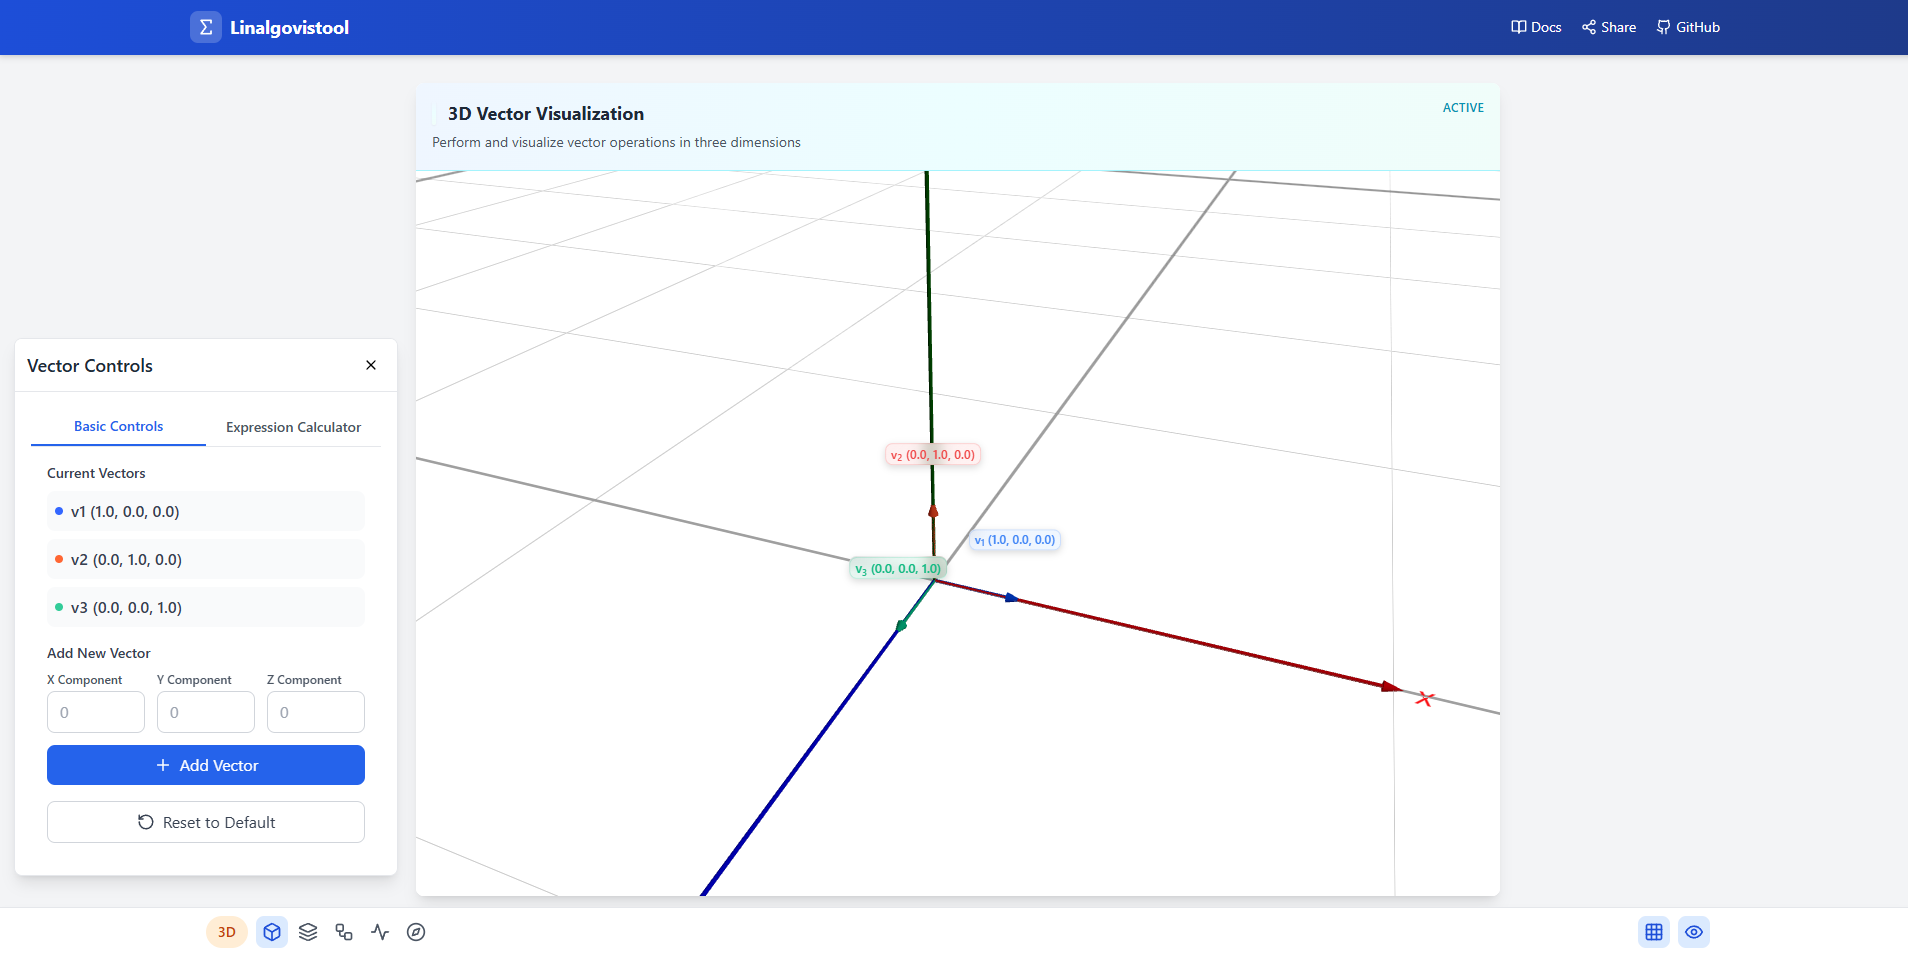
3D vector visualization
-
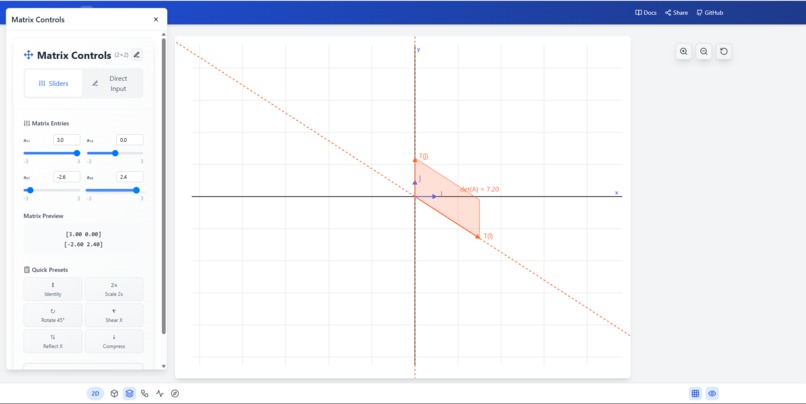
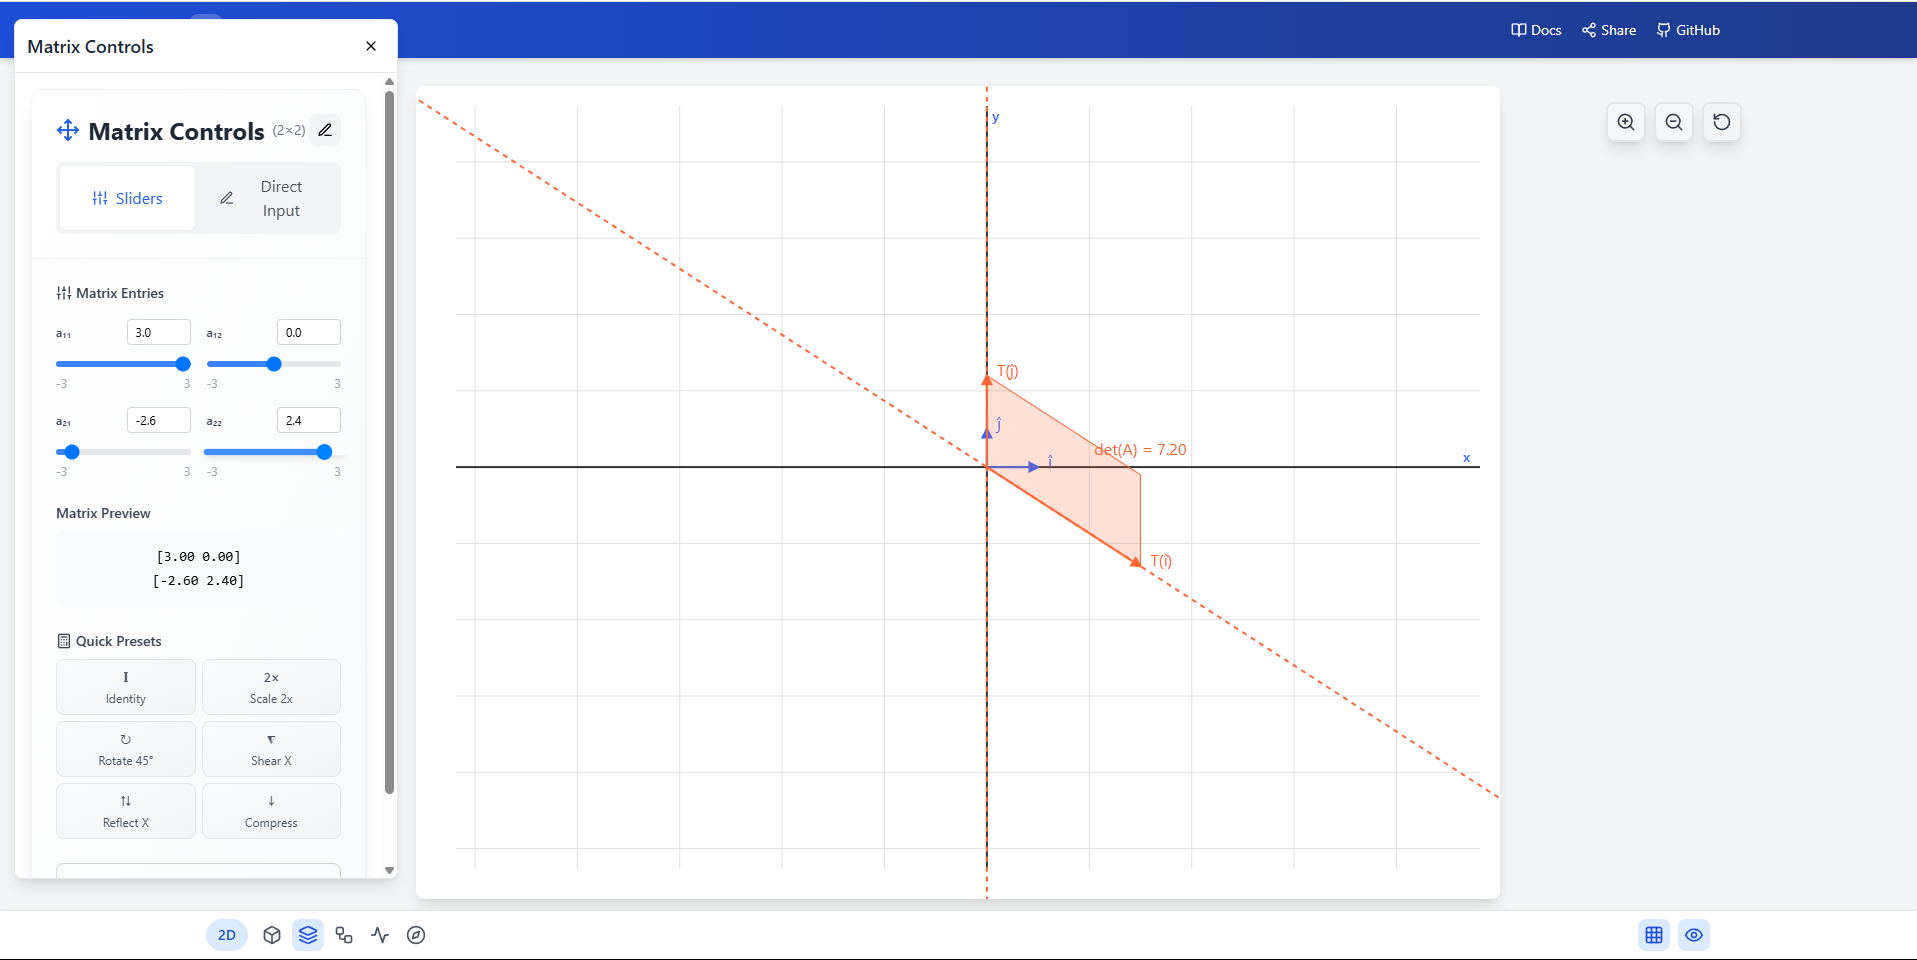
2D matrix transformations
-
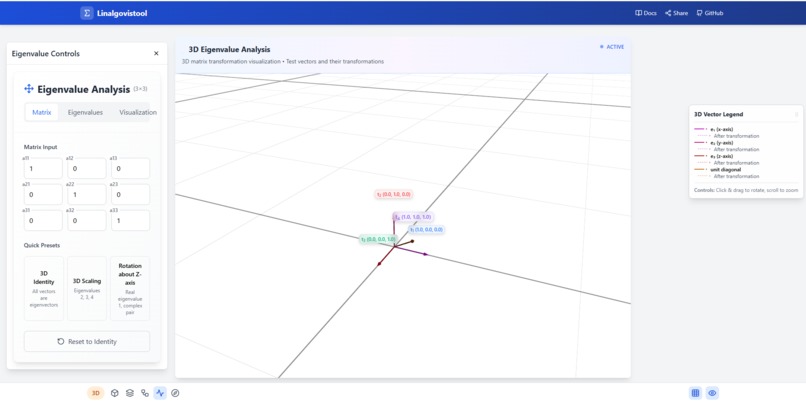
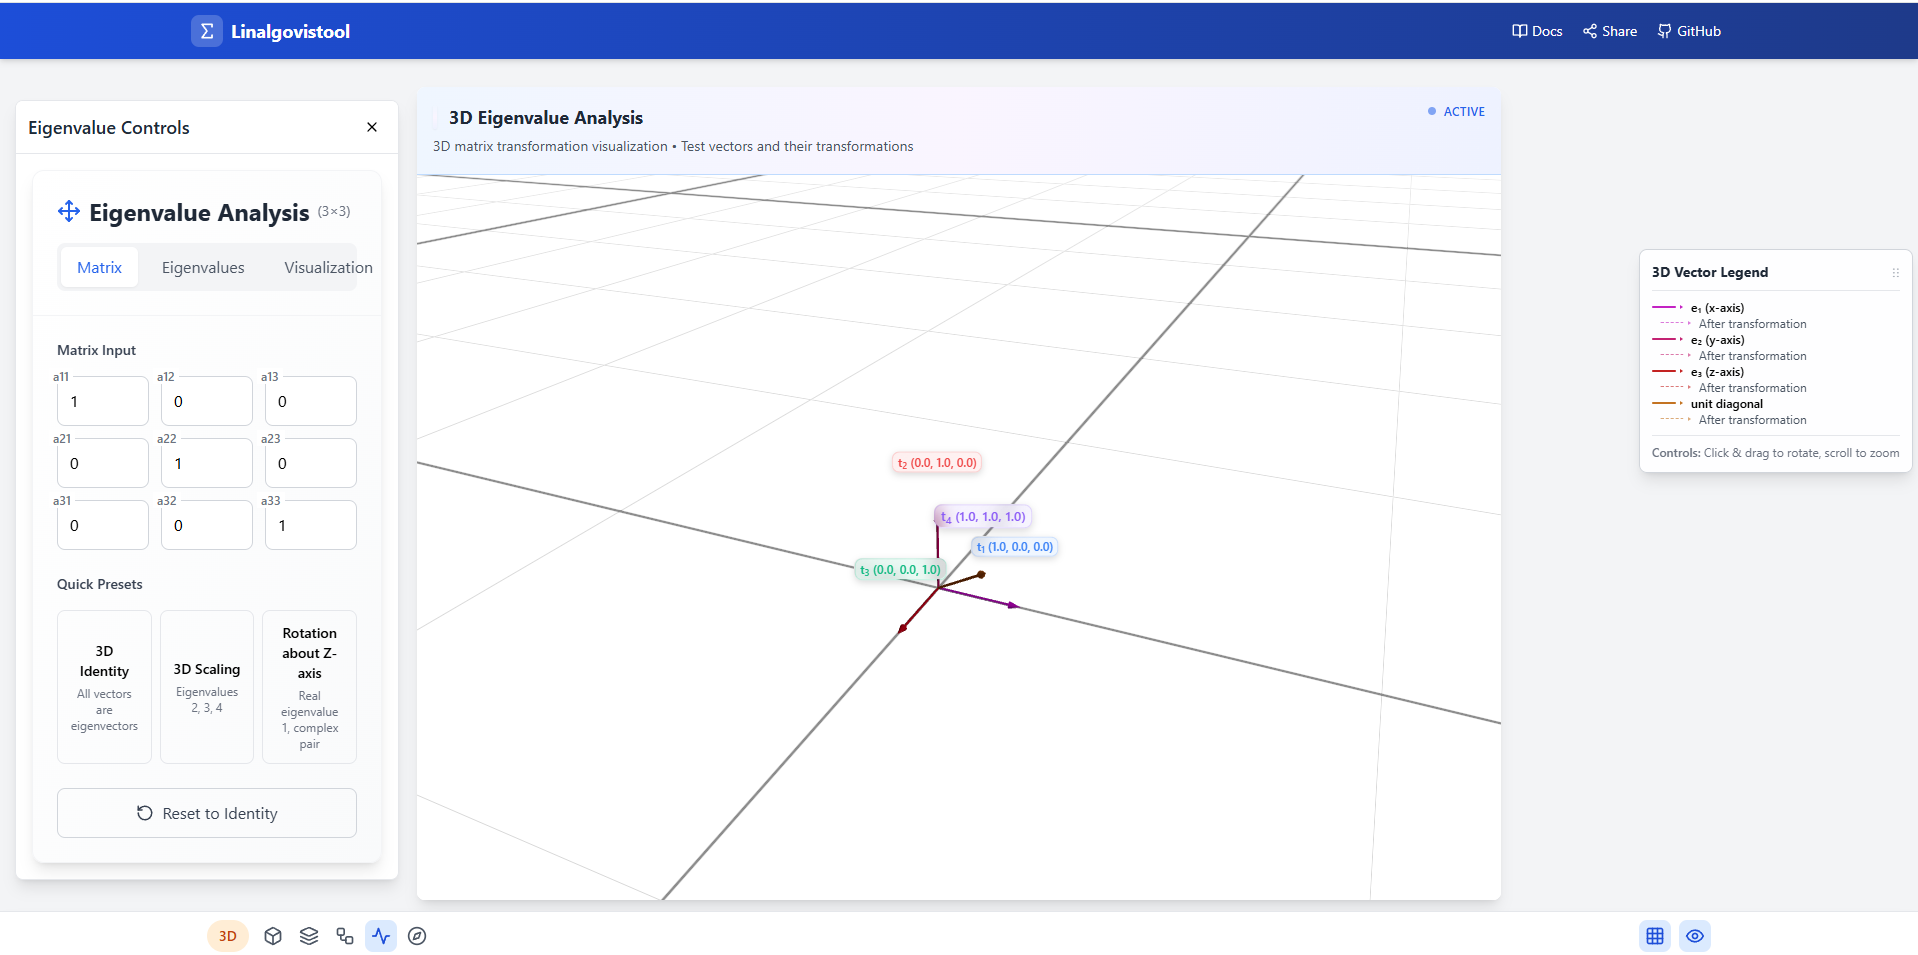
3D eigenvalue analysis
Inspiration
What it does
Linalgovistool: Making Abstract Math Finally Make Sense
🌟 The Inspiration
I just finished taking linear algebra last semester, and honestly? I was drowning. The professor would write these massive matrices on the board, talk about "eigenspaces" and "linear transformations," and I'd just sit there nodding along while having absolutely no clue what any of it actually meant.
The breaking point came during our midterm. I could memorize the formulas, I could crunch through the calculations, but when the professor asked "What does this eigenvalue represent geometrically?" I was completely lost. I realized I was just doing math without understanding what it actually does.
That's when it hit me: I'm a visual learner stuck in a world of abstract symbols. I needed to see what these mathematical concepts were doing, not just calculate them. After talking to my classmates, I realized I wasn't alone—most of us were struggling with the same thing. We could do the math, but we couldn't visualize the math.
So I thought: what if there was a way to actually see these abstract concepts? What if you could watch a matrix transform space right in front of your eyes? What if eigenvalues weren't just numbers, but directions you could actually point to?
That's when I decided to build something that would help students like me finally "get" linear algebra.
🎯 What I Learned (About Math AND Building Stuff)
This project taught me way more than I expected:
Finally Understanding Linear Algebra
- Vectors aren't just lists of numbers—they're arrows pointing in space that you can actually see and move around
- Matrices don't just "multiply"—they stretch, rotate, and flip space like a rubber sheet
- Eigenvalues aren't mysterious constants—they're the directions where a matrix just makes things bigger or smaller without changing direction
- Subspaces aren't abstract concepts—they're like mathematical "slices" of space that you can visualize as lines or planes
Learning to Build Things
- AI tools like Bolt.new are amazing—I could describe what I wanted and it would generate working code
- Iteration is everything—I probably went through 50+ versions, each time saying "can you make the vectors more colorful?" or "the grid is too cluttered"
- Simple ideas can become complex fast—what started as "show me a vector" became a full mathematical playground
- User experience matters in education—if students can't figure out how to use your tool, they won't learn from it
The Power of Visual Learning
- Seeing is believing—once I could watch eigenvalues in action, everything clicked
- Interactive beats static—being able to drag vectors around and see what happens is way better than staring at diagrams
- One visualization can replace pages of explanation—showing how a matrix transforms a square tells you more than any formula
🛠️ How I Built It (The Non-Technical Version)
Discovery: AI Can Build Web Apps!
I discovered Bolt.new—an AI tool that can generate complete web applications from simple descriptions.
The process was like having a conversation with a really smart programming assistant:
Me: "I want to visualize vectors as arrows in 3D space" Bolt.new: generates a working 3D scene with colorful arrows
Me: "Can you add sliders to change the vector components?" Bolt.new: adds interactive controls
Me: "What if I want to see how matrices transform these vectors?" Bolt.new: builds matrix transformation visualization
The Building Process
Week 1: Basic Vectors I started super simple: "Create a web page that shows 3D arrows representing mathematical vectors." Bolt.new gave me a working prototype in minutes. I spent the rest of the week tweaking colors, sizes, and asking for small improvements.
Week 2: Making It Interactive "Can users drag the vectors around?" "Can we add input fields to type in exact numbers?" Each request would generate new code that I could immediately test and refine.
Week 3-4: Adding Everything Else Once I understood the workflow, I got ambitious:
- "Add eigenvalue visualization"
- "Show subspaces as colored regions"
- "Make it work on phones"
- "Add tooltips to explain what everything does"
🚧 Challenges I Faced (And How I Overcame Them)
Challenge 1: "Wait, What's Actually Happening Here?"
Problem: Even with visualizations, I sometimes couldn't tell if what I was seeing was mathematically correct.
Solution: I became my own beta tester. For every feature, I'd work through examples from my textbook and compare the visual results with my hand calculations. When they matched, I knew the tool was working. When they didn't, I'd go back to Bolt.new and say "this doesn't look right."
Challenge 2: "How Do You Show Complex Numbers?"
Problem: My linear algebra class covered complex eigenvalues, but how do you visualize something that involves imaginary numbers?
Solution: I researched online and learned that complex eigenvalues often represent rotations. So I asked Bolt.new to "show complex eigenvalues as spinning animations" and "add a 2D view that shows the complex plane." It wasn't perfect, but it gave students a way to see that complex numbers aren't just abstract—they have geometric meaning.
Challenge 3: "This Is Too Overwhelming for Beginners"
Problem: I kept adding features, and the tool became intimidating for students who were just learning basic vector addition.
Solution: I added a "step-by-step" approach. New users see simple vectors first, then gradually unlock matrix transformations, then eigenvalues, then advanced features. I also added lots of tooltips that explain what each button does in plain English, not math jargon.
Challenge 4: "It Doesn't Work on My Phone"
Problem: I built everything on my laptop, but my study group wanted to use it on their phones during class.
Solution: I told Bolt.new "make this work on mobile devices" and it automatically adjusted the interface. The AI was smart enough to create touch-friendly controls and responsive layouts without me needing to understand responsive design.
Challenge 5: "The Math Gets Weird with Big Numbers"
Problem: When students input really large vectors or matrices, strange things would happen—vectors would disappear or look distorted.
Solution: I learned this was a "numerical stability" issue. I asked Bolt.new to "add safeguards for extreme inputs" and "automatically scale the view when vectors get very large or very small." The AI implemented solutions I never would have thought of myself.
🎯 What Actually Happened (The Results)
Personal Impact
- I finally "got" linear algebra: After building this tool, I went back and re-read my textbook. Suddenly, everything made sense. I could visualize what each equation was doing.
Helping Other Students
- My study group loved it: I shared it with my classmates, and suddenly our study sessions became way more productive. Instead of just doing practice problems, we could experiment and explore.
Unexpected Lessons
- Teaching others helps you learn: Explaining how to use the tool to other students forced me to understand the concepts even deeper.
- Simple can be powerful: The most helpful features weren't the fancy 3D animations—they were basic things like being able to input vector components and immediately see them as arrows.
- AI democratizes creation: I built something useful without being a professional programmer. That's pretty amazing.
🔗 Try It Yourself
- Use the Tool: Linalgovistool - Try it out and see if it helps you understand linear algebra concepts better
- See the Code: GitHub Repository - Check out what Bolt.new generated (it's pretty impressive!)
- Built with: Bolt.new - The AI tool that made this possible
Built by a struggling linear algebra student who refused to give up. If this helps even one person finally "get" eigenvalues, it was worth it.

Log in or sign up for Devpost to join the conversation.