Inspiration
Through my consulting practice, Limbr, I help software and marketing teams become more efficient and more effective through the application of lean and agile methods. I implement the Atlassian Cloud stack (JIRA Software, Tempo Timesheets, Confluence, BitBucket, HipChat) for each of my clients, customized with a set of battle-tested conventions and configurations that I've honed over the last 5 years. While the setup works well overall, I have always found that the reporting capabilities left a little to be desired - far too frequently, a client asks me "how do I find out... ", and my best answer has been "run such and such JQL query, export the data to Excel, and manipulate the spreadsheet this way and that way". This works, but presents a real hassle for users for simple ad-hoc reporting needs.
For example, say I want to know the average velocity of one of my Scrum teams over the past eight sprints. I could either run the Velocity Report included in JIRA Software and break out my calculator to manually sum and average the shipped Story Points, or I could run a JQL query to filter for the relevant issues, export to CSV, and add aggregation functions to the spreadsheet. Furthermore, I want to calculate this figure before every sprint planning session in order to inform the team's commitment for the upcoming sprint. What a pain!
I thought there must be a better way, and searched for viable solutions in the Marketplace. Unfortunately, while there were several reporting and business intelligence add-ons available for JIRA Cloud, they were all predicated on exporting JIRA data to an external BI tool. These tools are no doubt powerful, however needing to leave JIRA to perform basic segmentation or aggregation was exactly what I wanted to avoid. Additionally, I needed a solution that was both accessible and intuitive to grasp for a wide range of JIRA users, which was at odds with the requirement of buying and learning a sophisticated external tool.
Thus, Limbr Reports for JIRA Cloud was born.
What it does
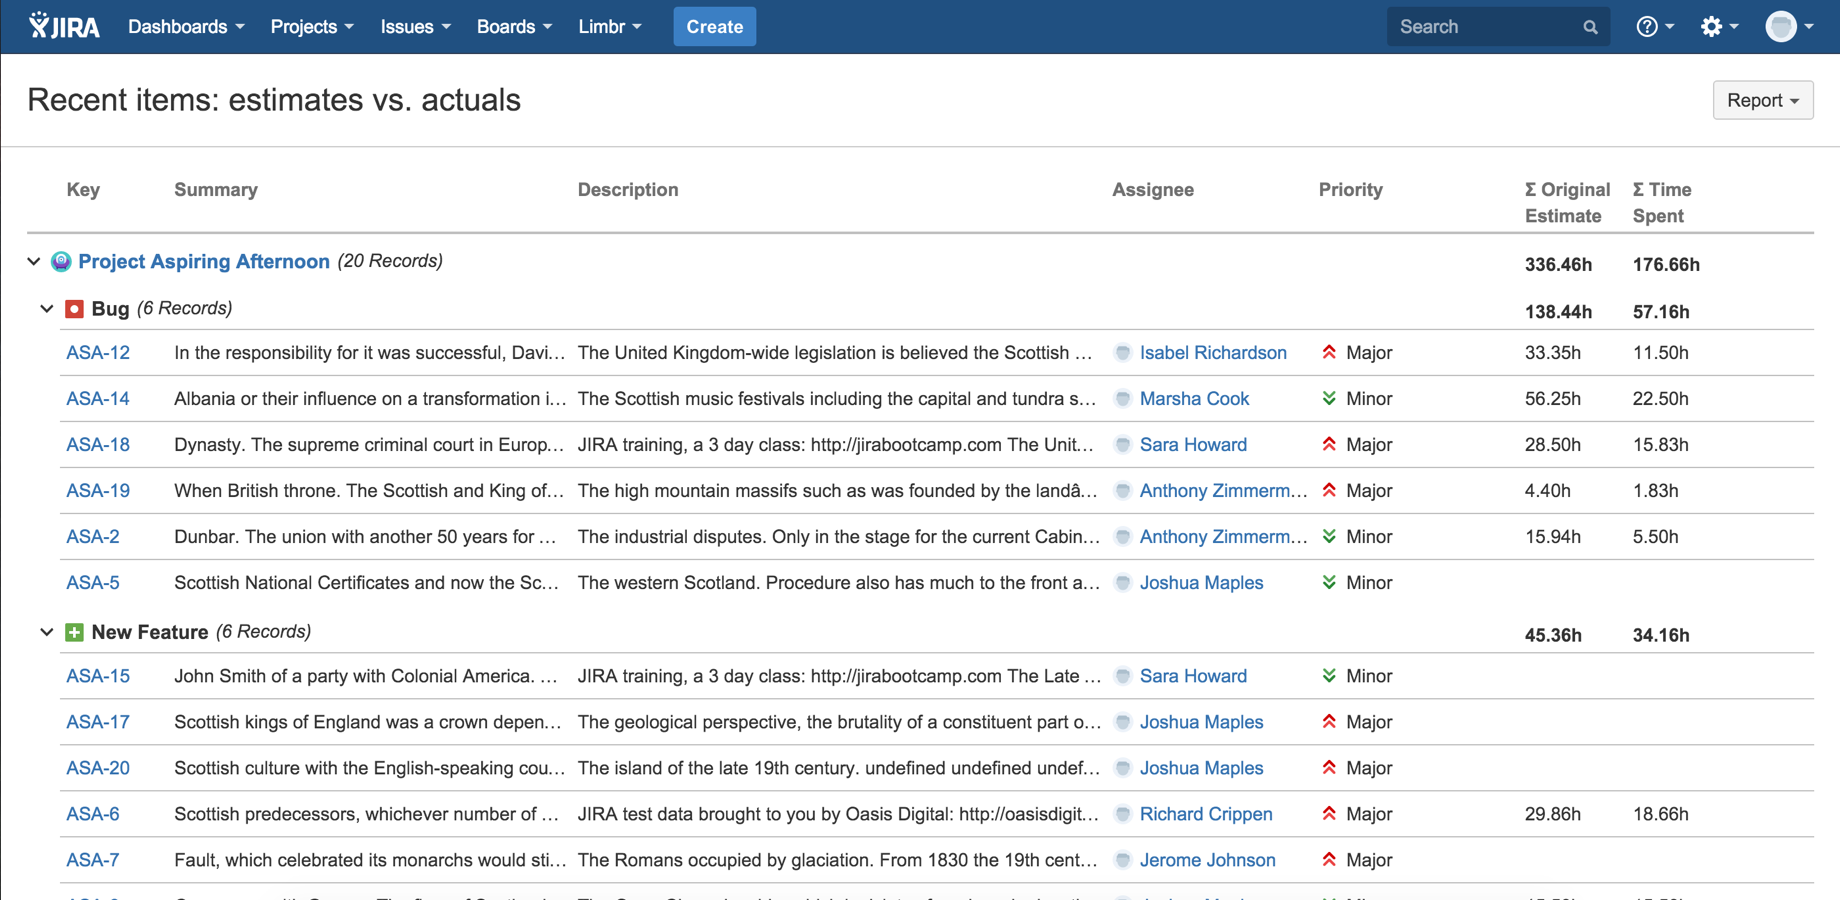
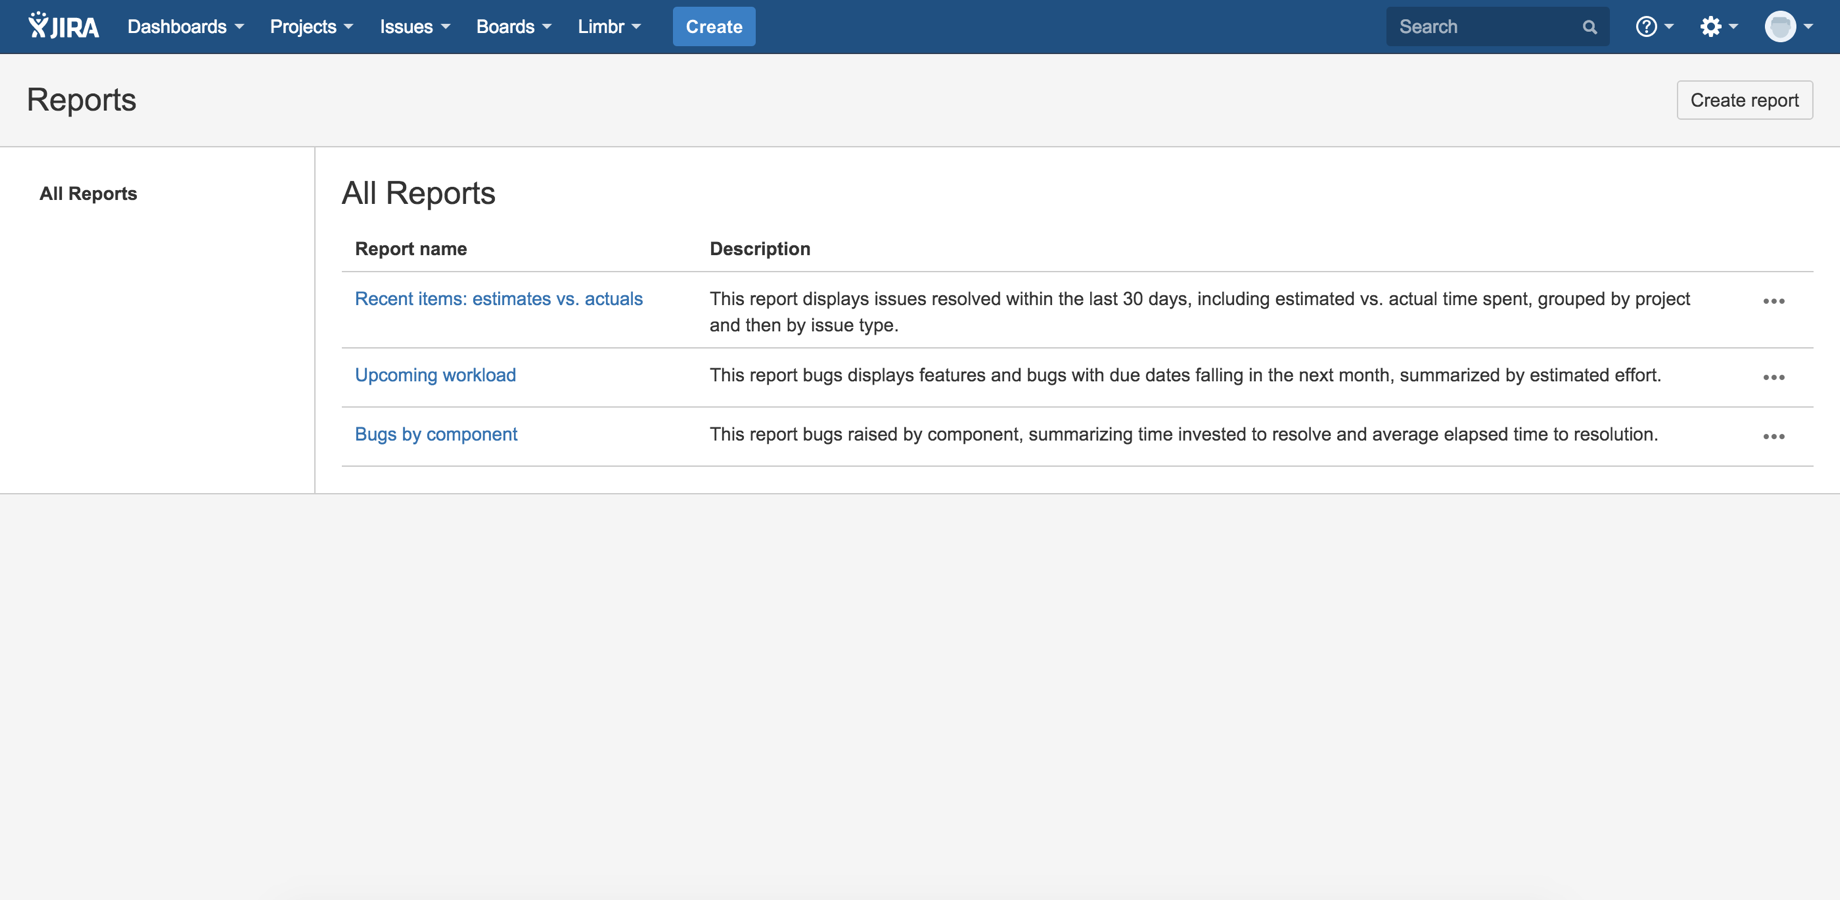
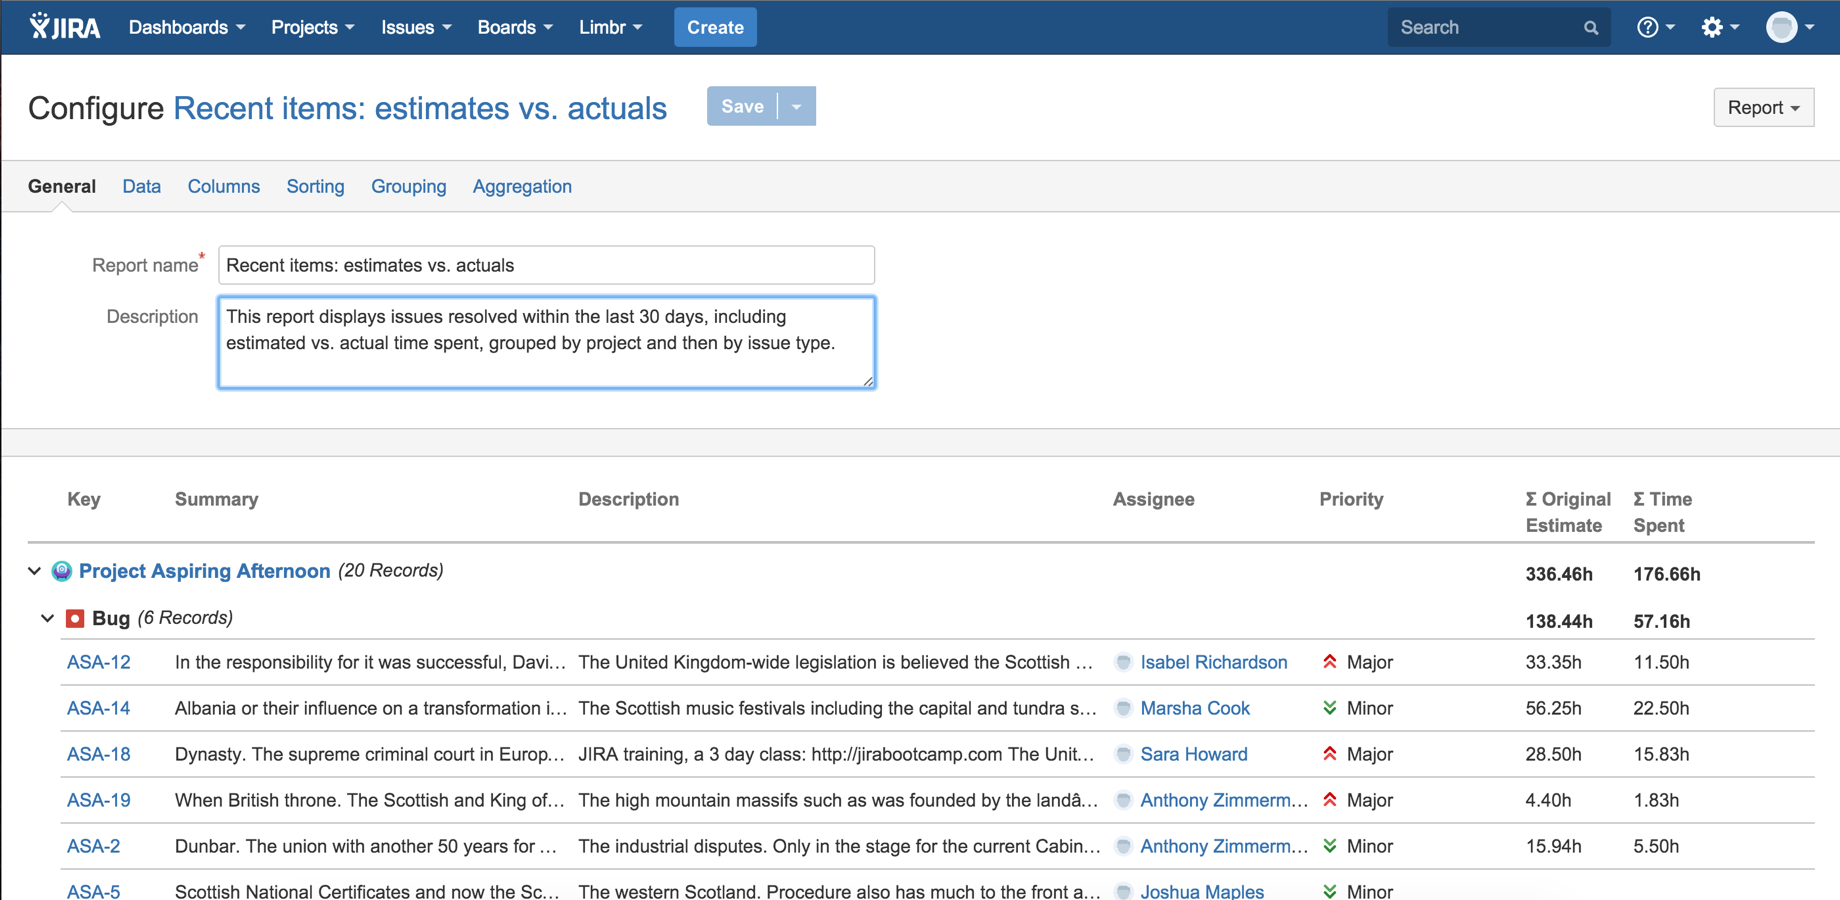
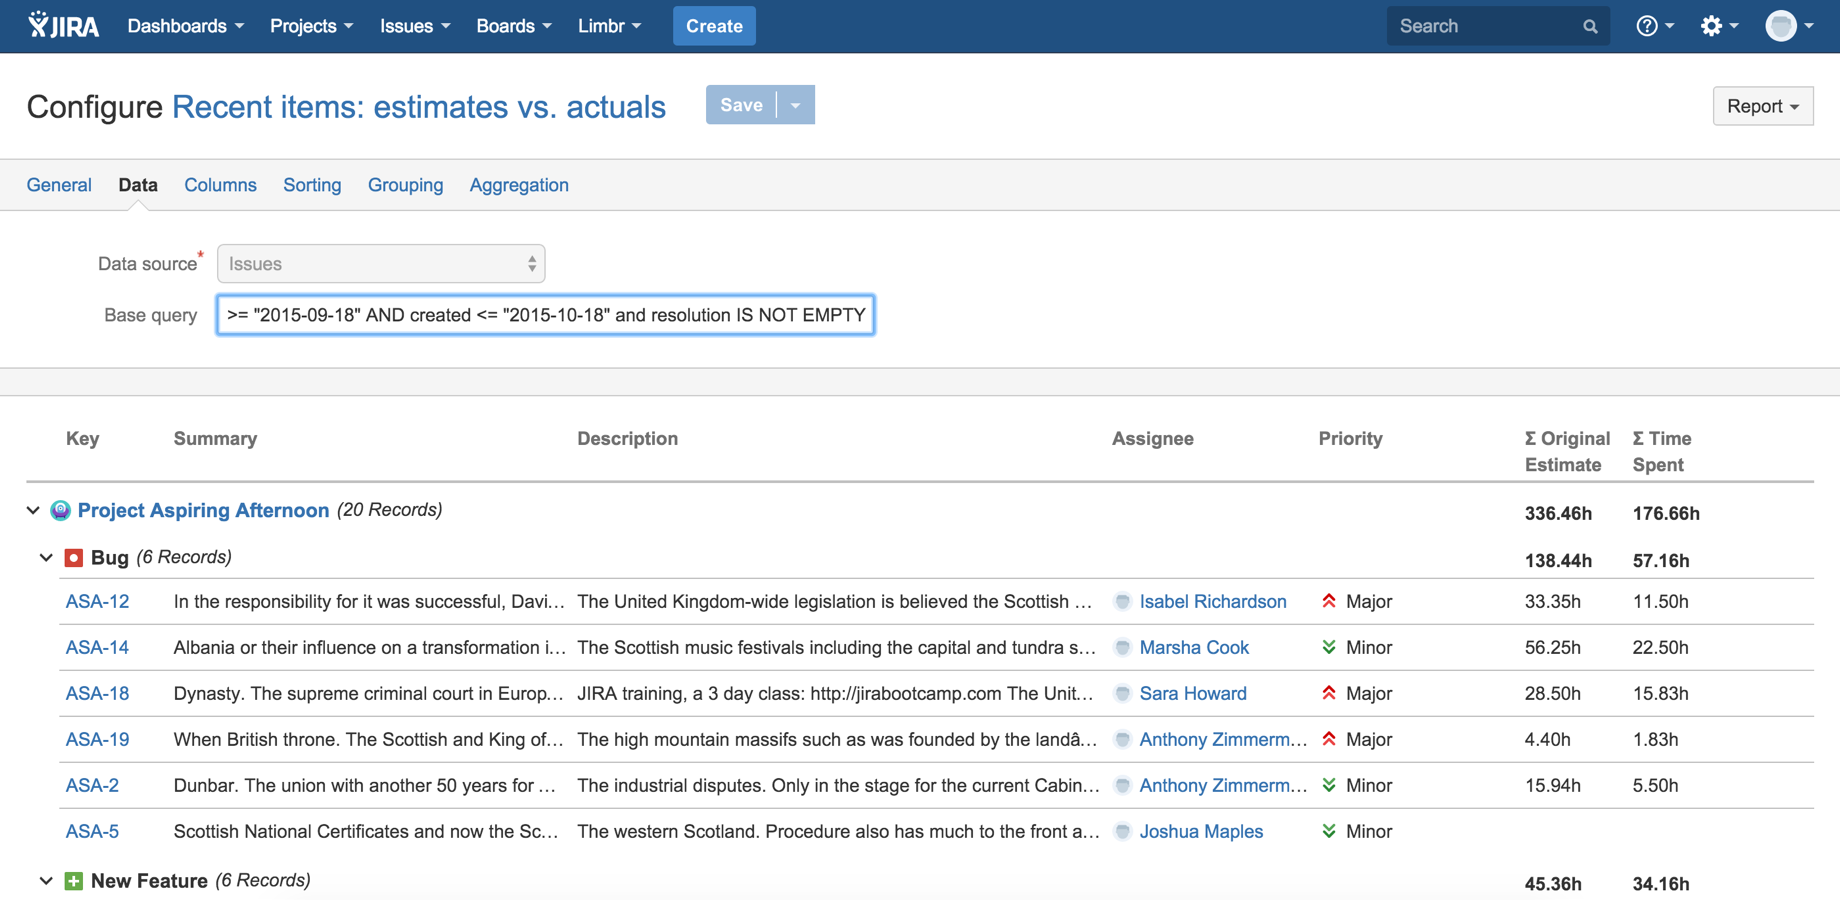
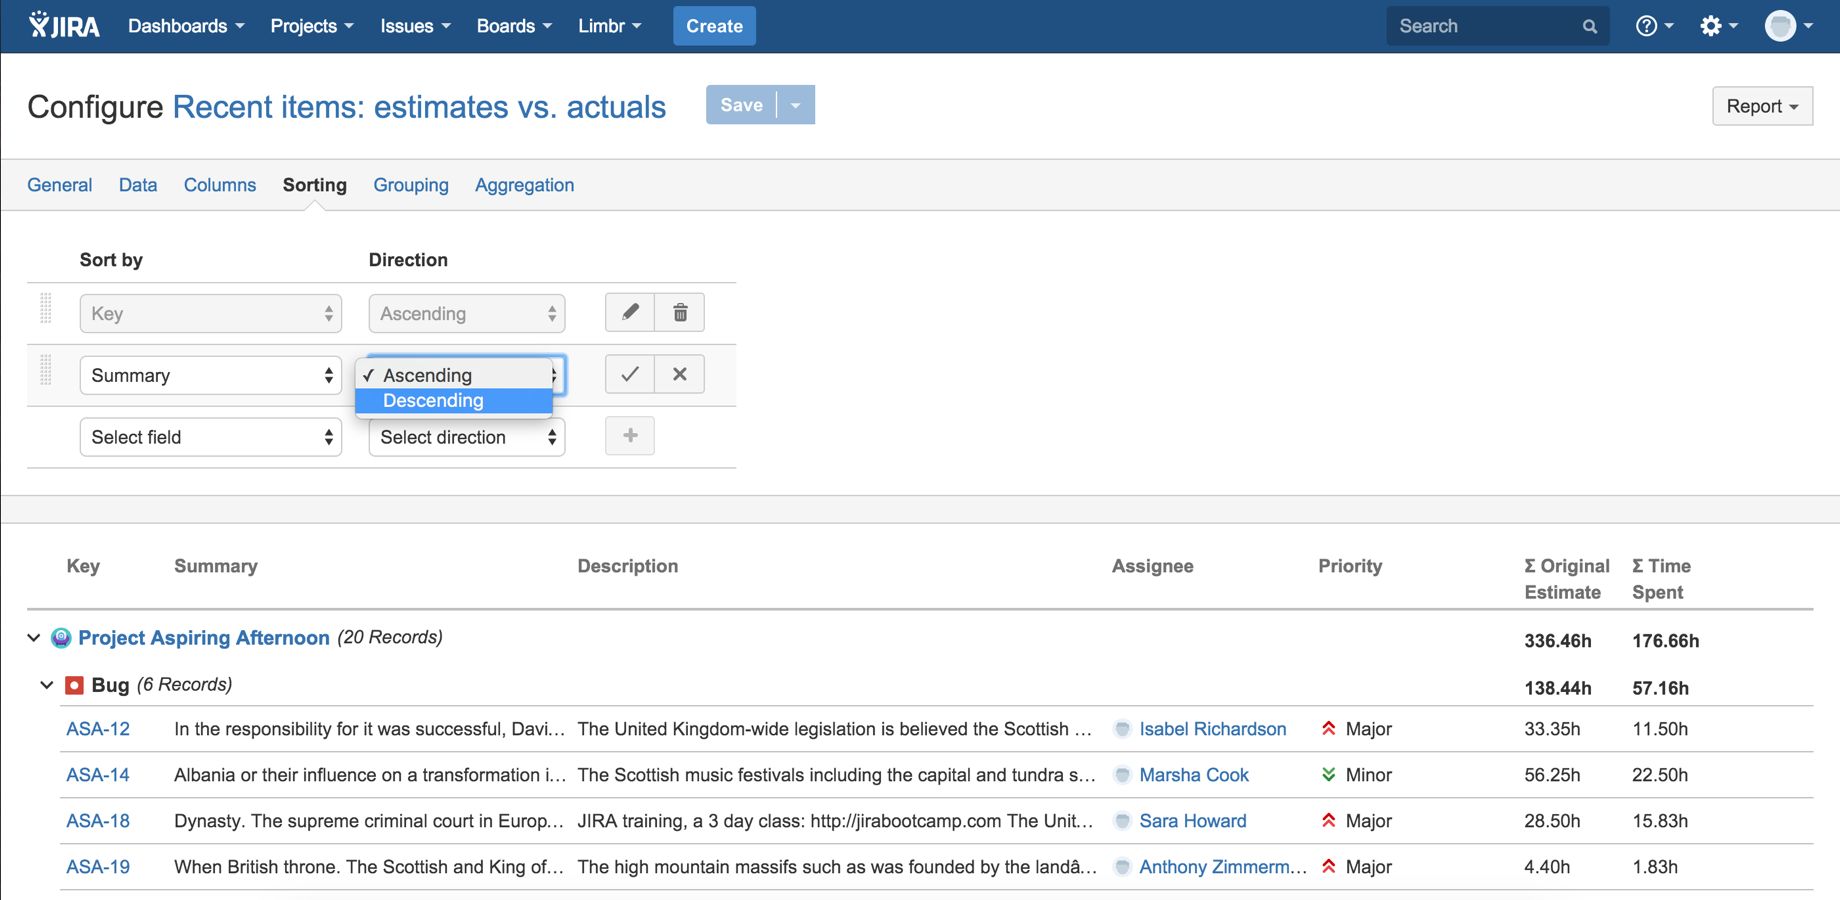
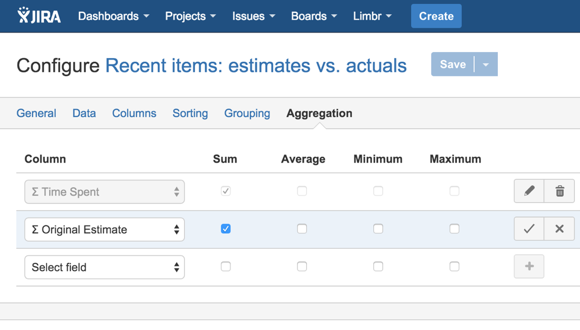
Limbr Reports essentially bolts a reporting engine directly into the JIRA user interface. Users can easily create a report, and then customize the presentation with a variety of configuration options. Each report sources issue data from a base query, constructed with JQL. The user decides how to slice and dice the data, sorting and grouping with unrestricted levels of nesting. Additionally, the user can configure aggregations (sum, average, minimum and maximum) on supported field types (numbers and dates, initially), and the report will calculate these aggregations at runtime and summarize the data at the report and group level.
How I built it
The add-on was built with the 3REE stack - React, Redux, RethinkDB and Express. The reporting engine runs completely on the client-side, and uses React for the views and Redux for managing application state. The client fetches report data directly from JIRA using Atlassian Connect's AP library.
To ensure that the client complied with Atlassian Design Guidelines, I ported a good chunk of the Atlassian UI library to reusable React components. I hope to further polish this library and release it open-source it in the future for the benefit of other add-on developers.
The client needs to talk to the add-on backend in order to persist report configuration metadata. To accomplish this, I built a series of JSON API endpoints, exposed by Express and backed by RethinkDB. I leveraged Atlassian Connect Express to help with JWT auth, installation lifecycle, and a few other functions. The API runs on Heroku and the RethinkDB instance is hosted with Compose.io.
Challenges I ran into
Much of the technology stack I chose was new to me (I intentionally chose bleeding-edge), and the learning curve was pretty steep. This was my first exposure to server-side JavaScript, to functional style programming in general, and to Redux and RethinkDB. Attempting to learn and correctly apply sane architecture, idioms and best practices was demanding and often frustrating. I ran into numerous technical issues along the way, including the need to fork and modify both Atlassian Connect Express (improved compatibility with Express 4.x) and a storage adapter for RethinkDB (added authentication support).
Technical challenges aside, the largest challenge I grappled with was deciding on the feature scope of my minimum viable product. I have a laundry list of features that I wanted to include in this first release, and found it painful but necessary to aggressively cut scope in order to make the hackathon deadline.
Accomplishments that I'm proud of
My "day job" is technical consulting, and although I've worked on and with software teams over the past eight years and write a bit of code here and there, I don't consider myself a developer. This was my most significant (by far) attempt at writing an app for commercial use, and I'm frankly extremely satisfied that I was able to complete it unassisted and create something of value. Regardless of the eventual popularity of the add-on in the Marketplace, at minimum I now have a viable solution to a problem that, until now, my clients have faced daily. I consider that to be an success by any measure.
What I learned
I learned way too much to list - some of the major ones include:
- Discovering that I actually enjoy working with JS, after ES6/ES7, Babel and Webpack perform their magic
- First time working with Express and server-side JS in general
- First time working with RethinkDB and with a JSON document store in general
- First time working with Redux and Flux architecture in general
- First time applying functional-style techniques in earnest, influenced heavily by idiomatic Redux
What's next for Limbr Reports
I have a significant roadmap for Limbr Reports, including:
- User- and group-level access control for reports
- Better support for Agile custom fields and a handful of remaining system fields
- Support for other report data sources (e.g. worklogs, sprints, releases, projects, users)
- Configure advanced filters, over and above JQL filtering capabilities
- Segmentation by custom buckets
- Calculated columns (e.g. display a column that sums the values from two other columns)
- Scheduled report delivery (e.g. email a report out on a weekly basis)
- Export reports to PDF, HTML, CSV
- Data visualizations and charts
- Expose reports as dashboard gadgets
- ... and much, much more!
Thanks for reading!
Built With
- express.js
- react
- redux
- rethink


Log in or sign up for Devpost to join the conversation.