-
-

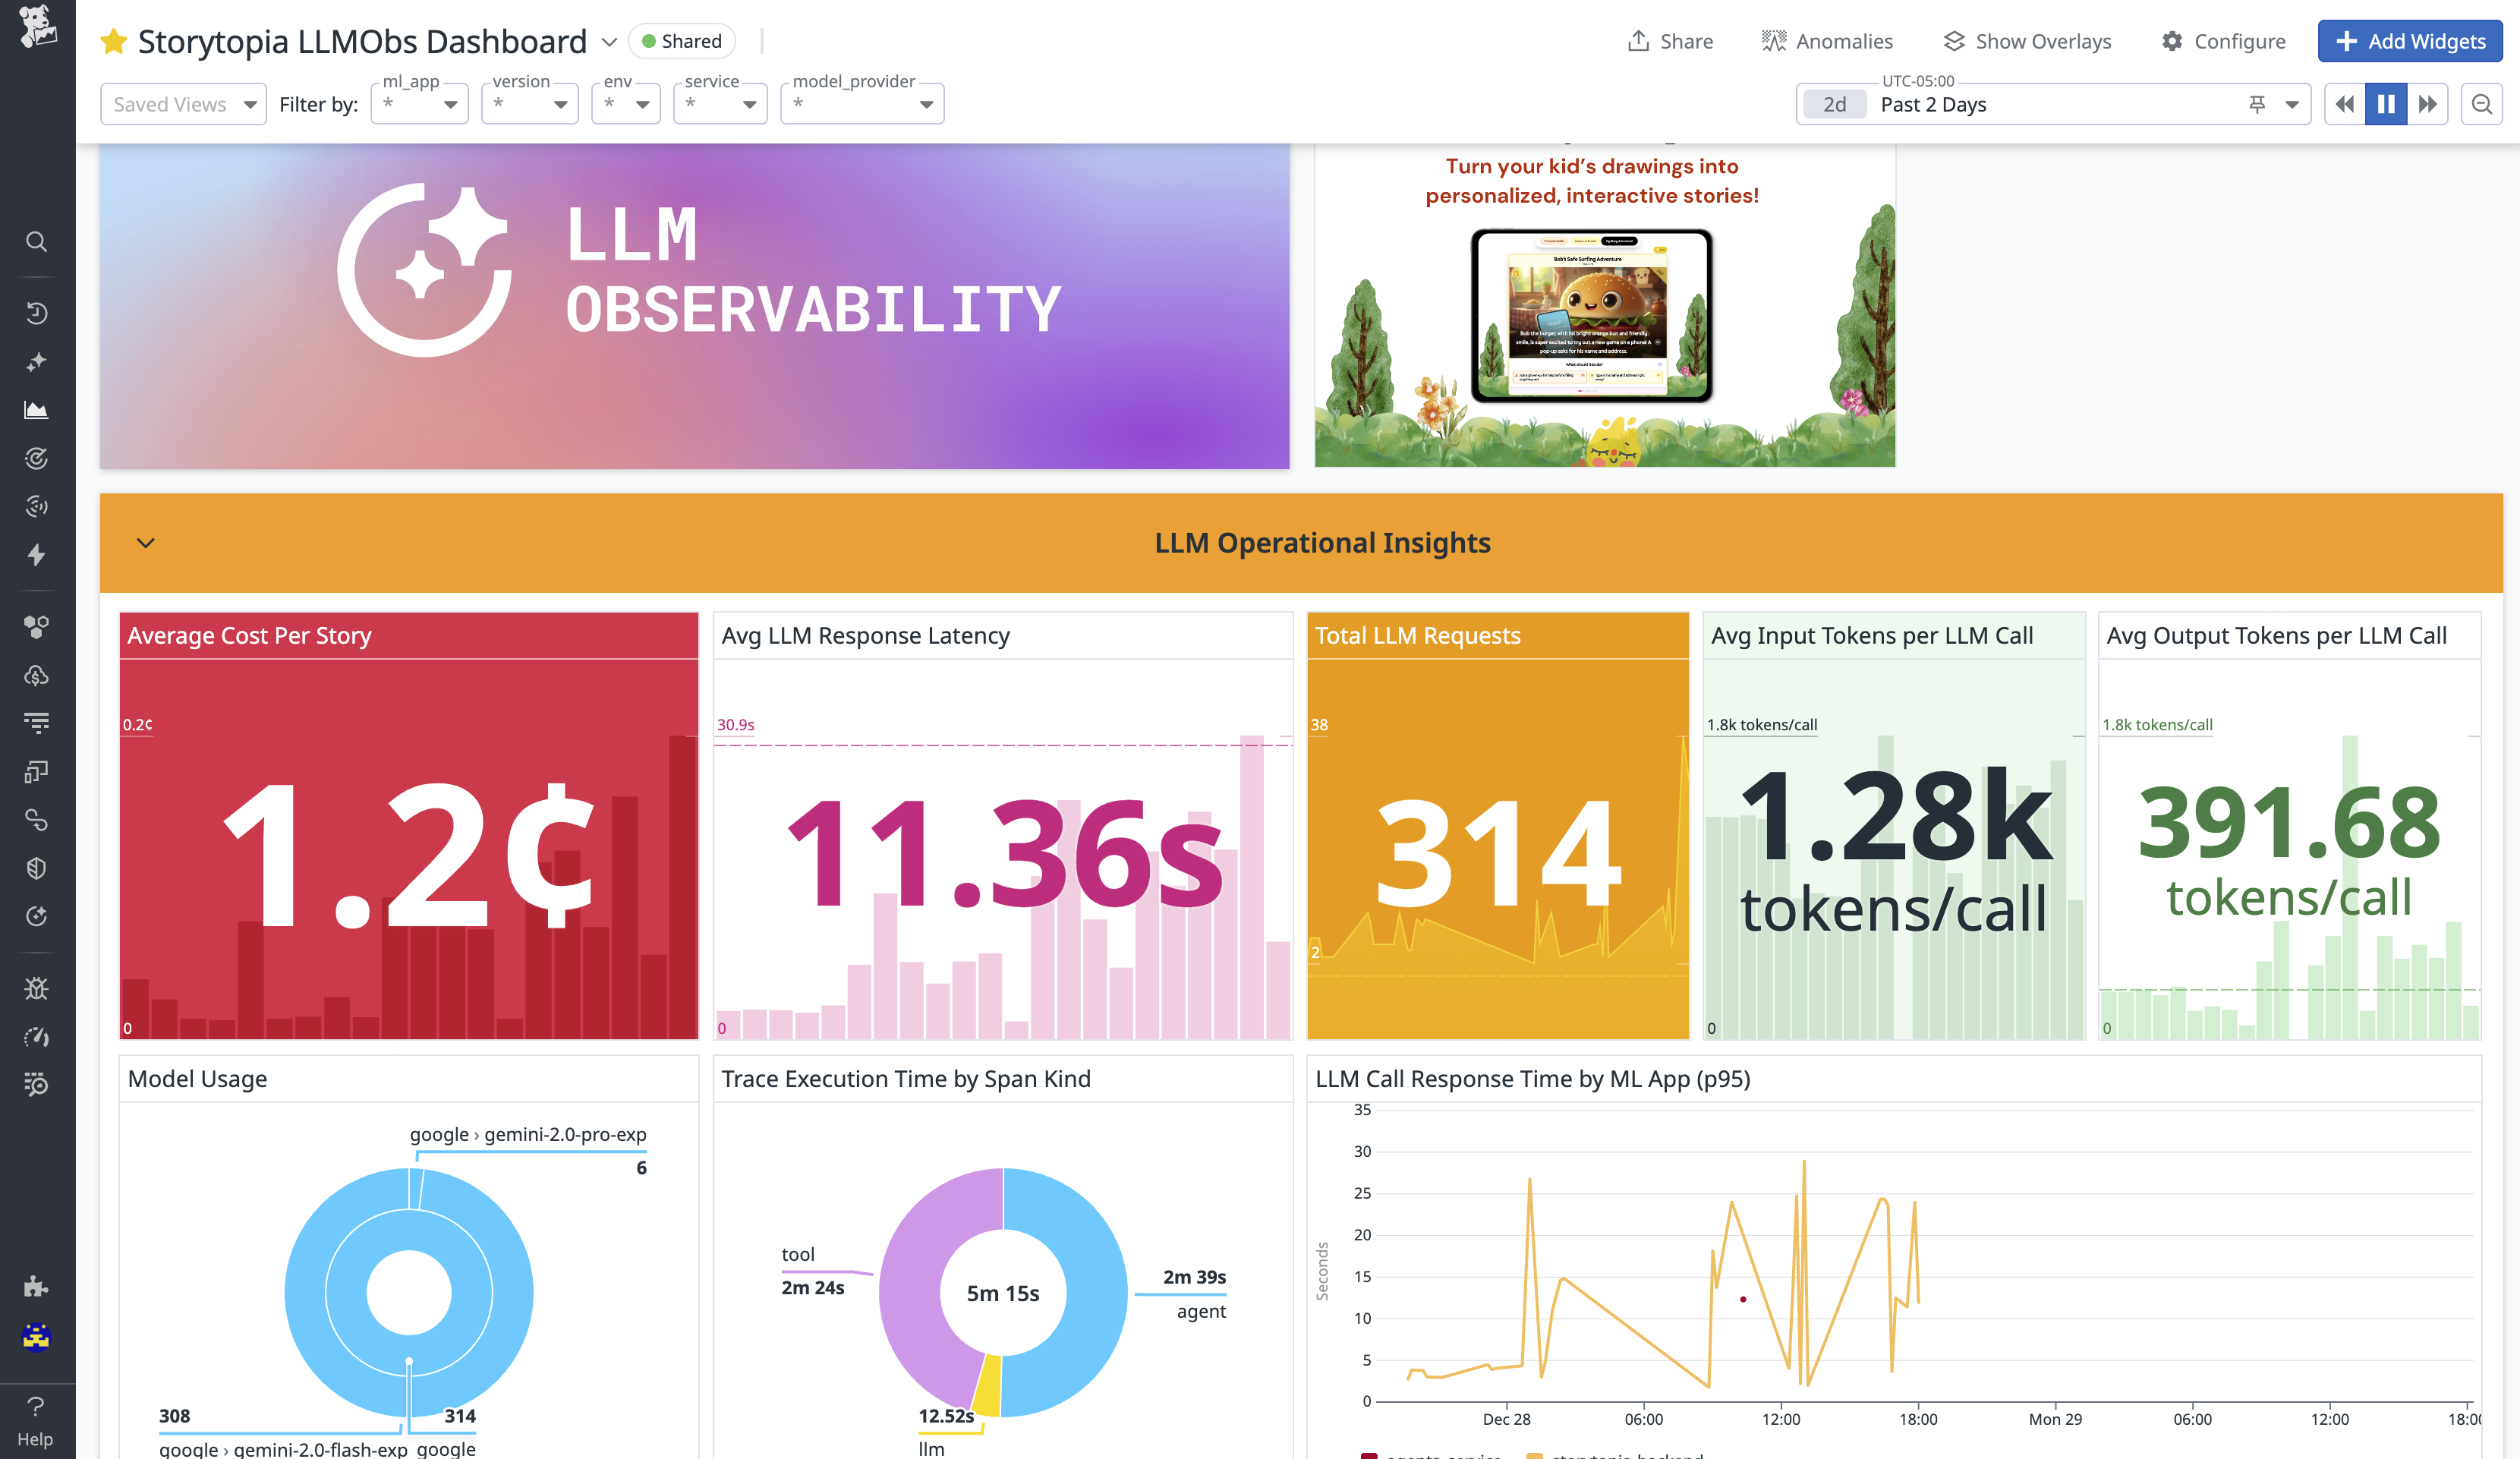
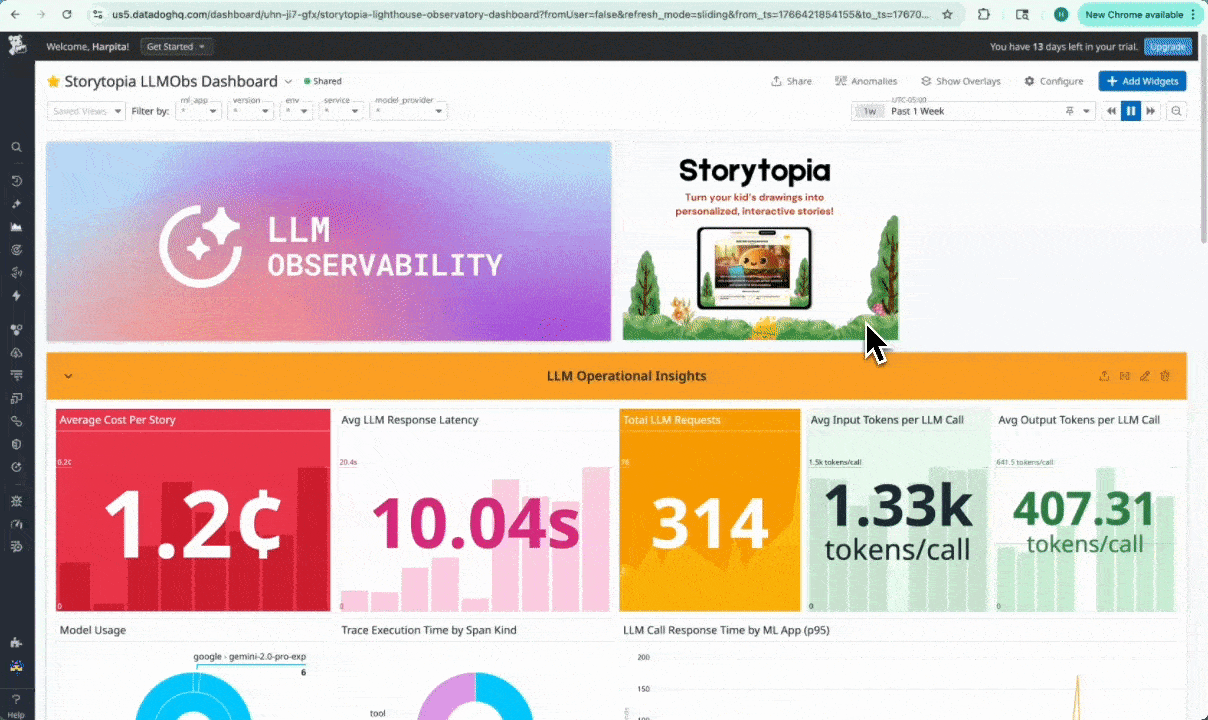
In-Datadog view of Storytopia Dashboard with LLM Operational Insights
-
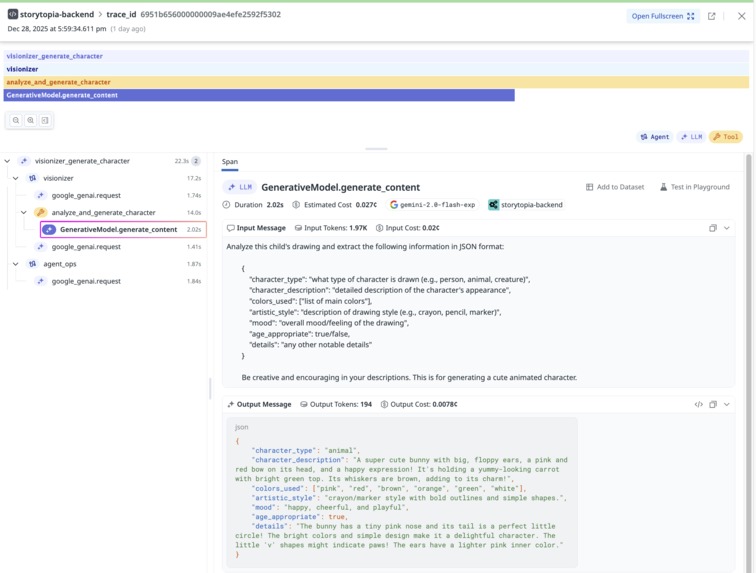
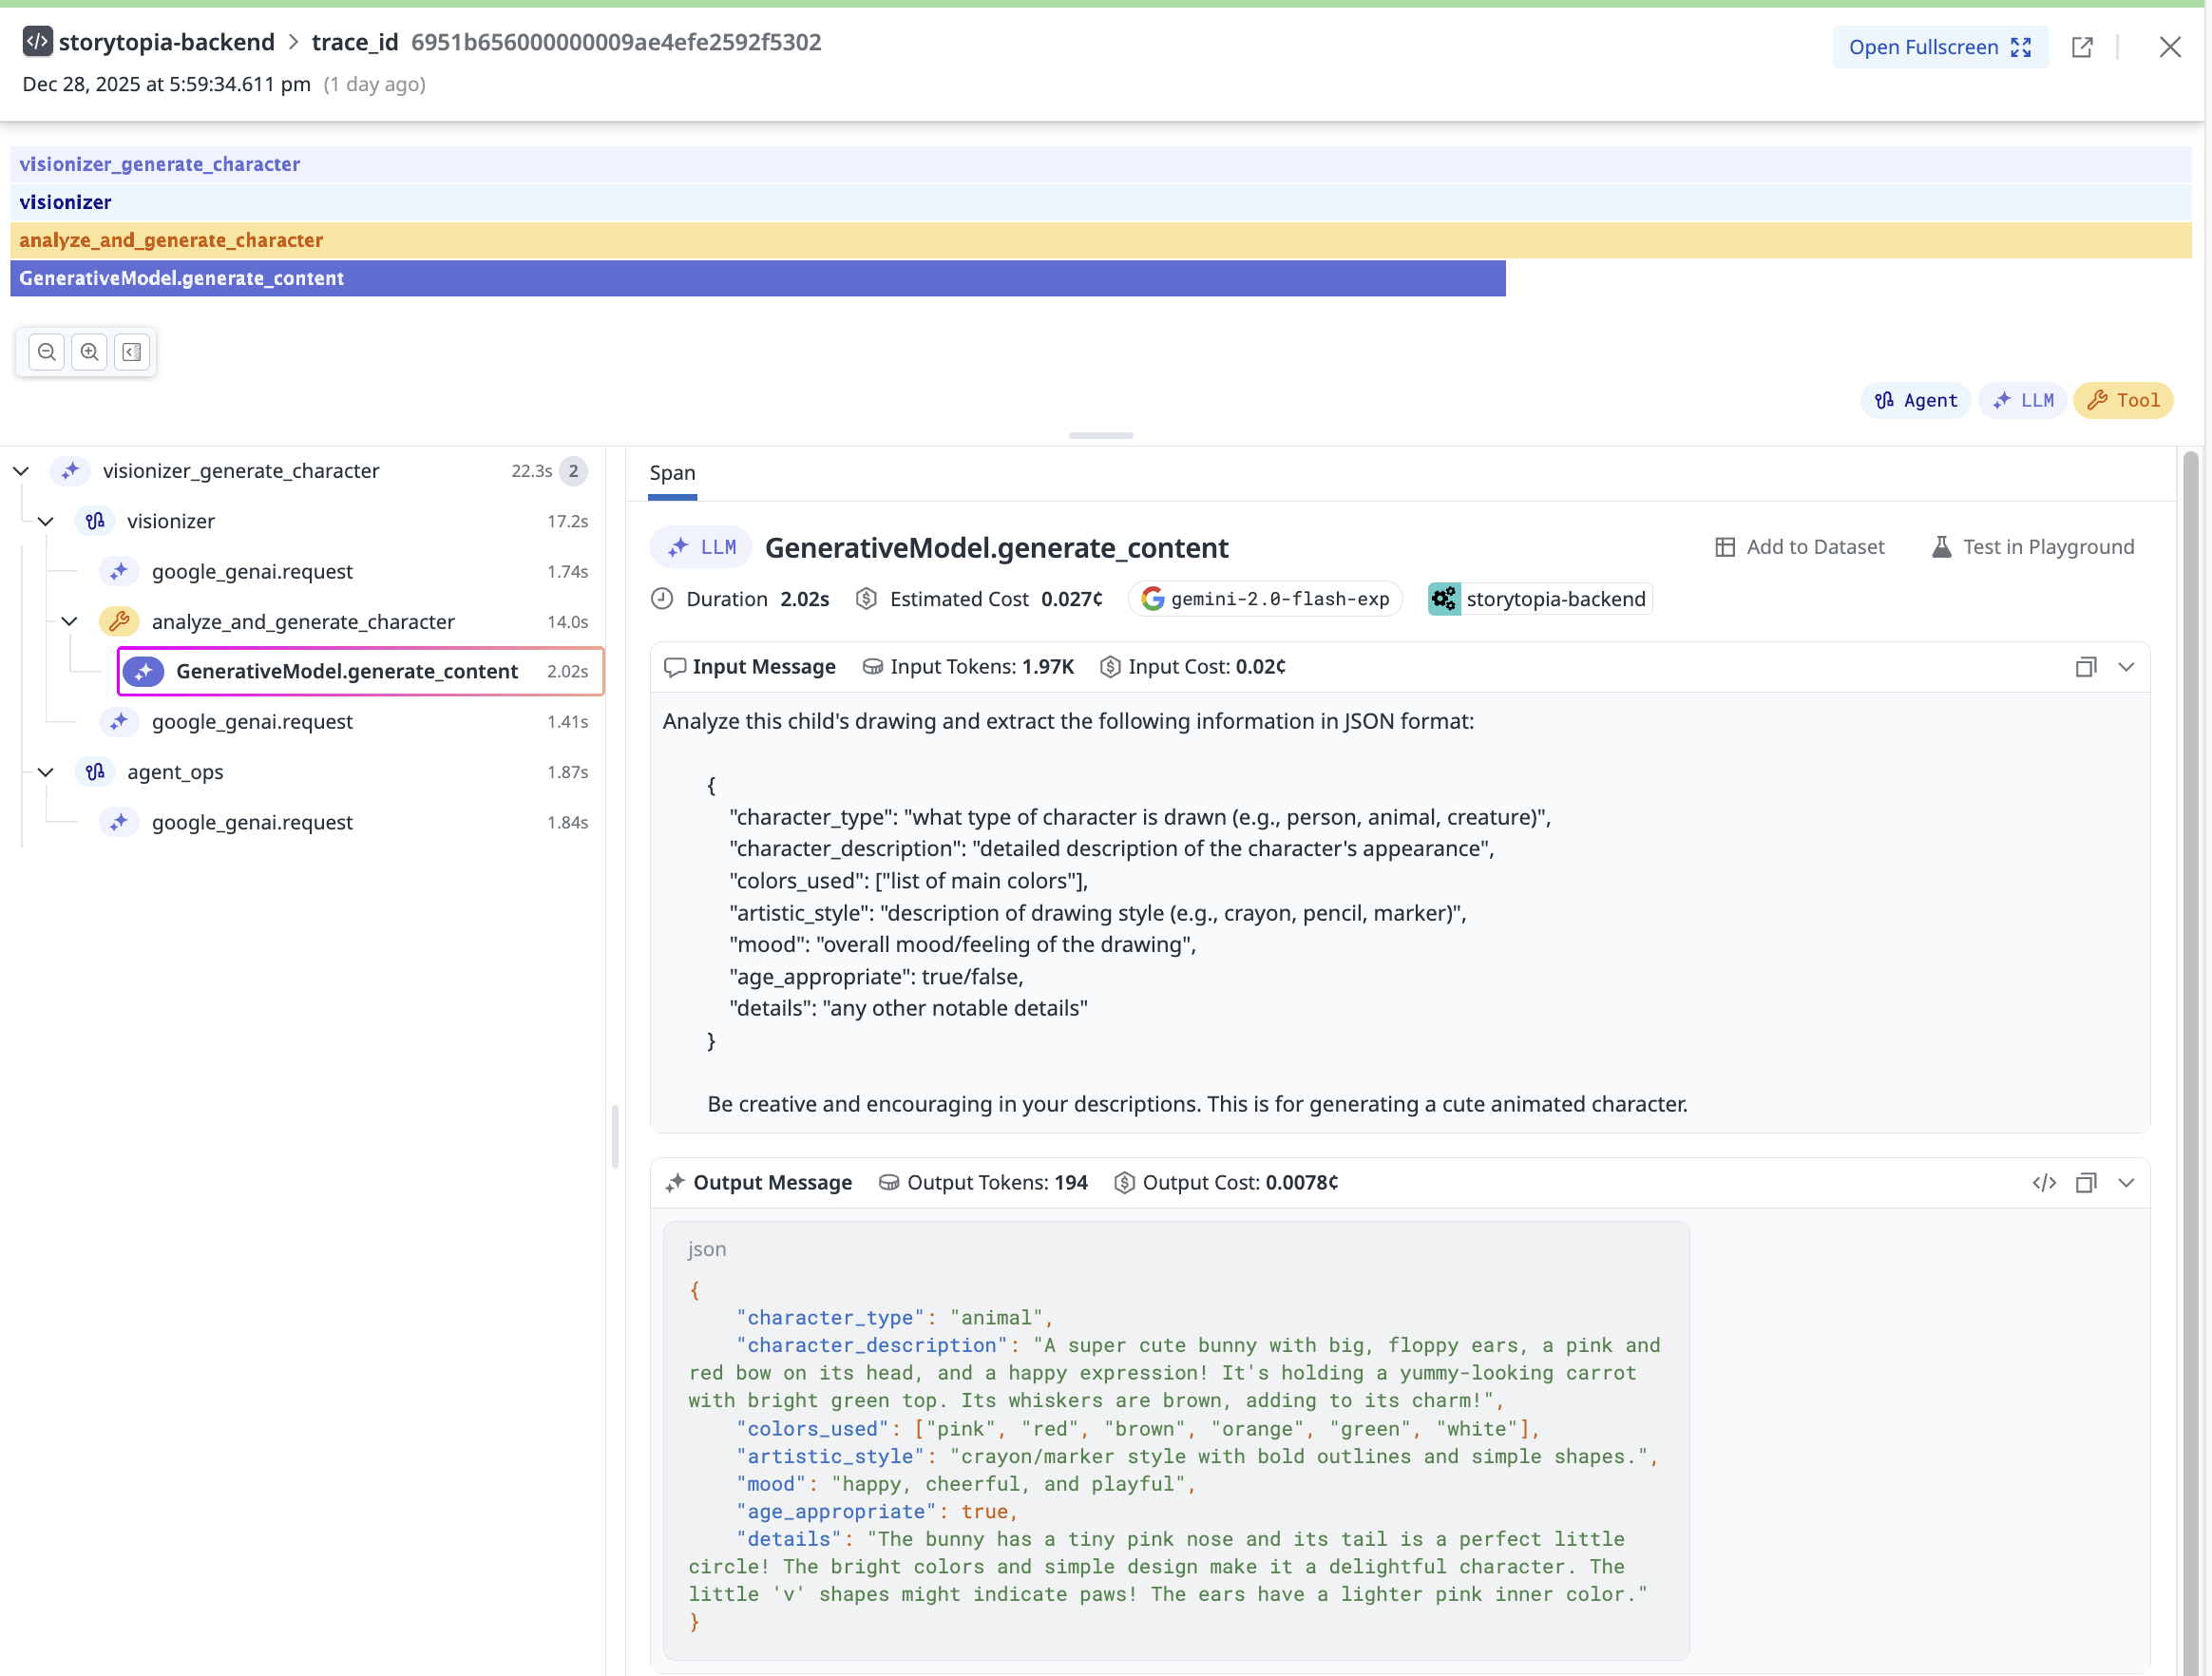
Detailed Datadog tracing view capturing agent orchestration, tool usage, and input/output JSON for a single user request.
-

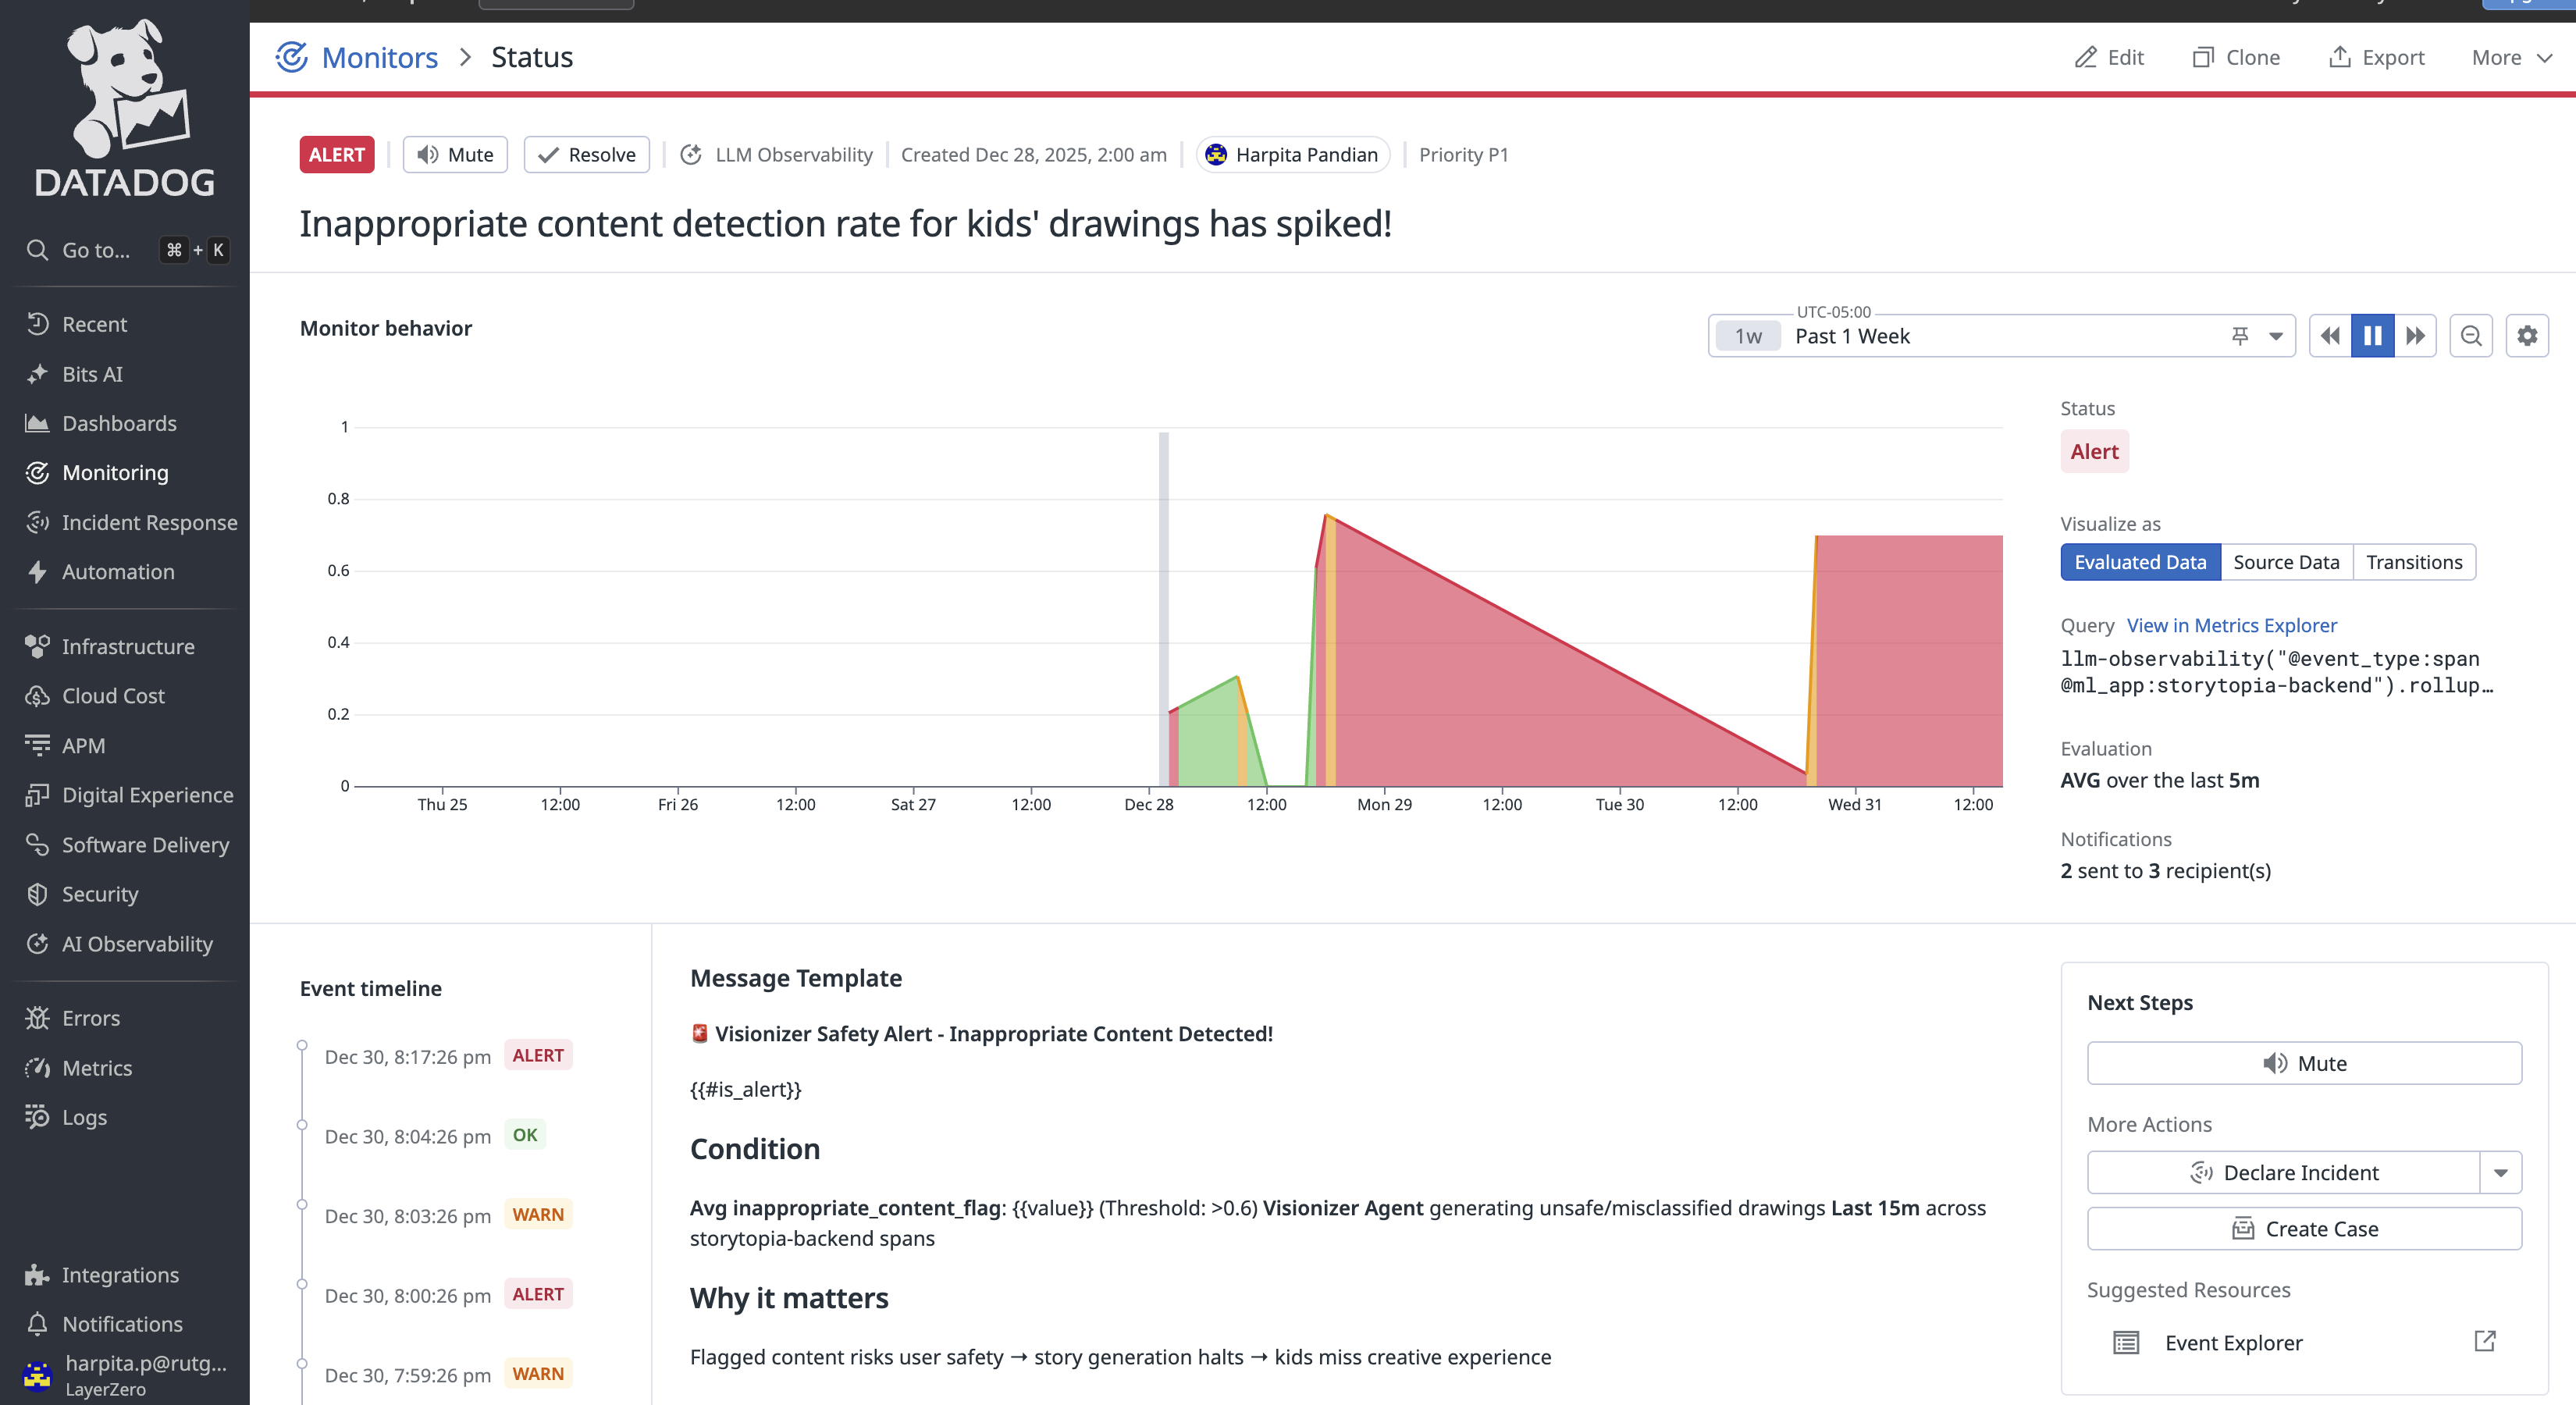
Custom alert monitor configured to notify when inappropriate content rates increase.
-
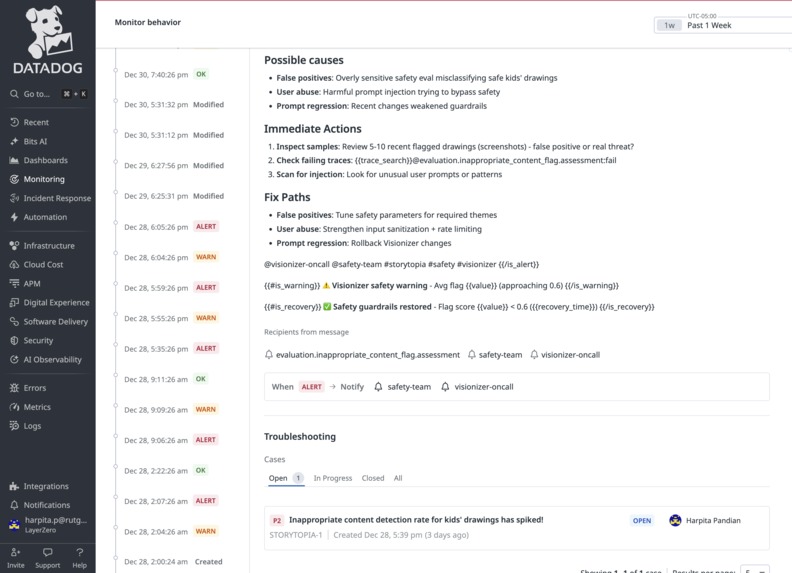
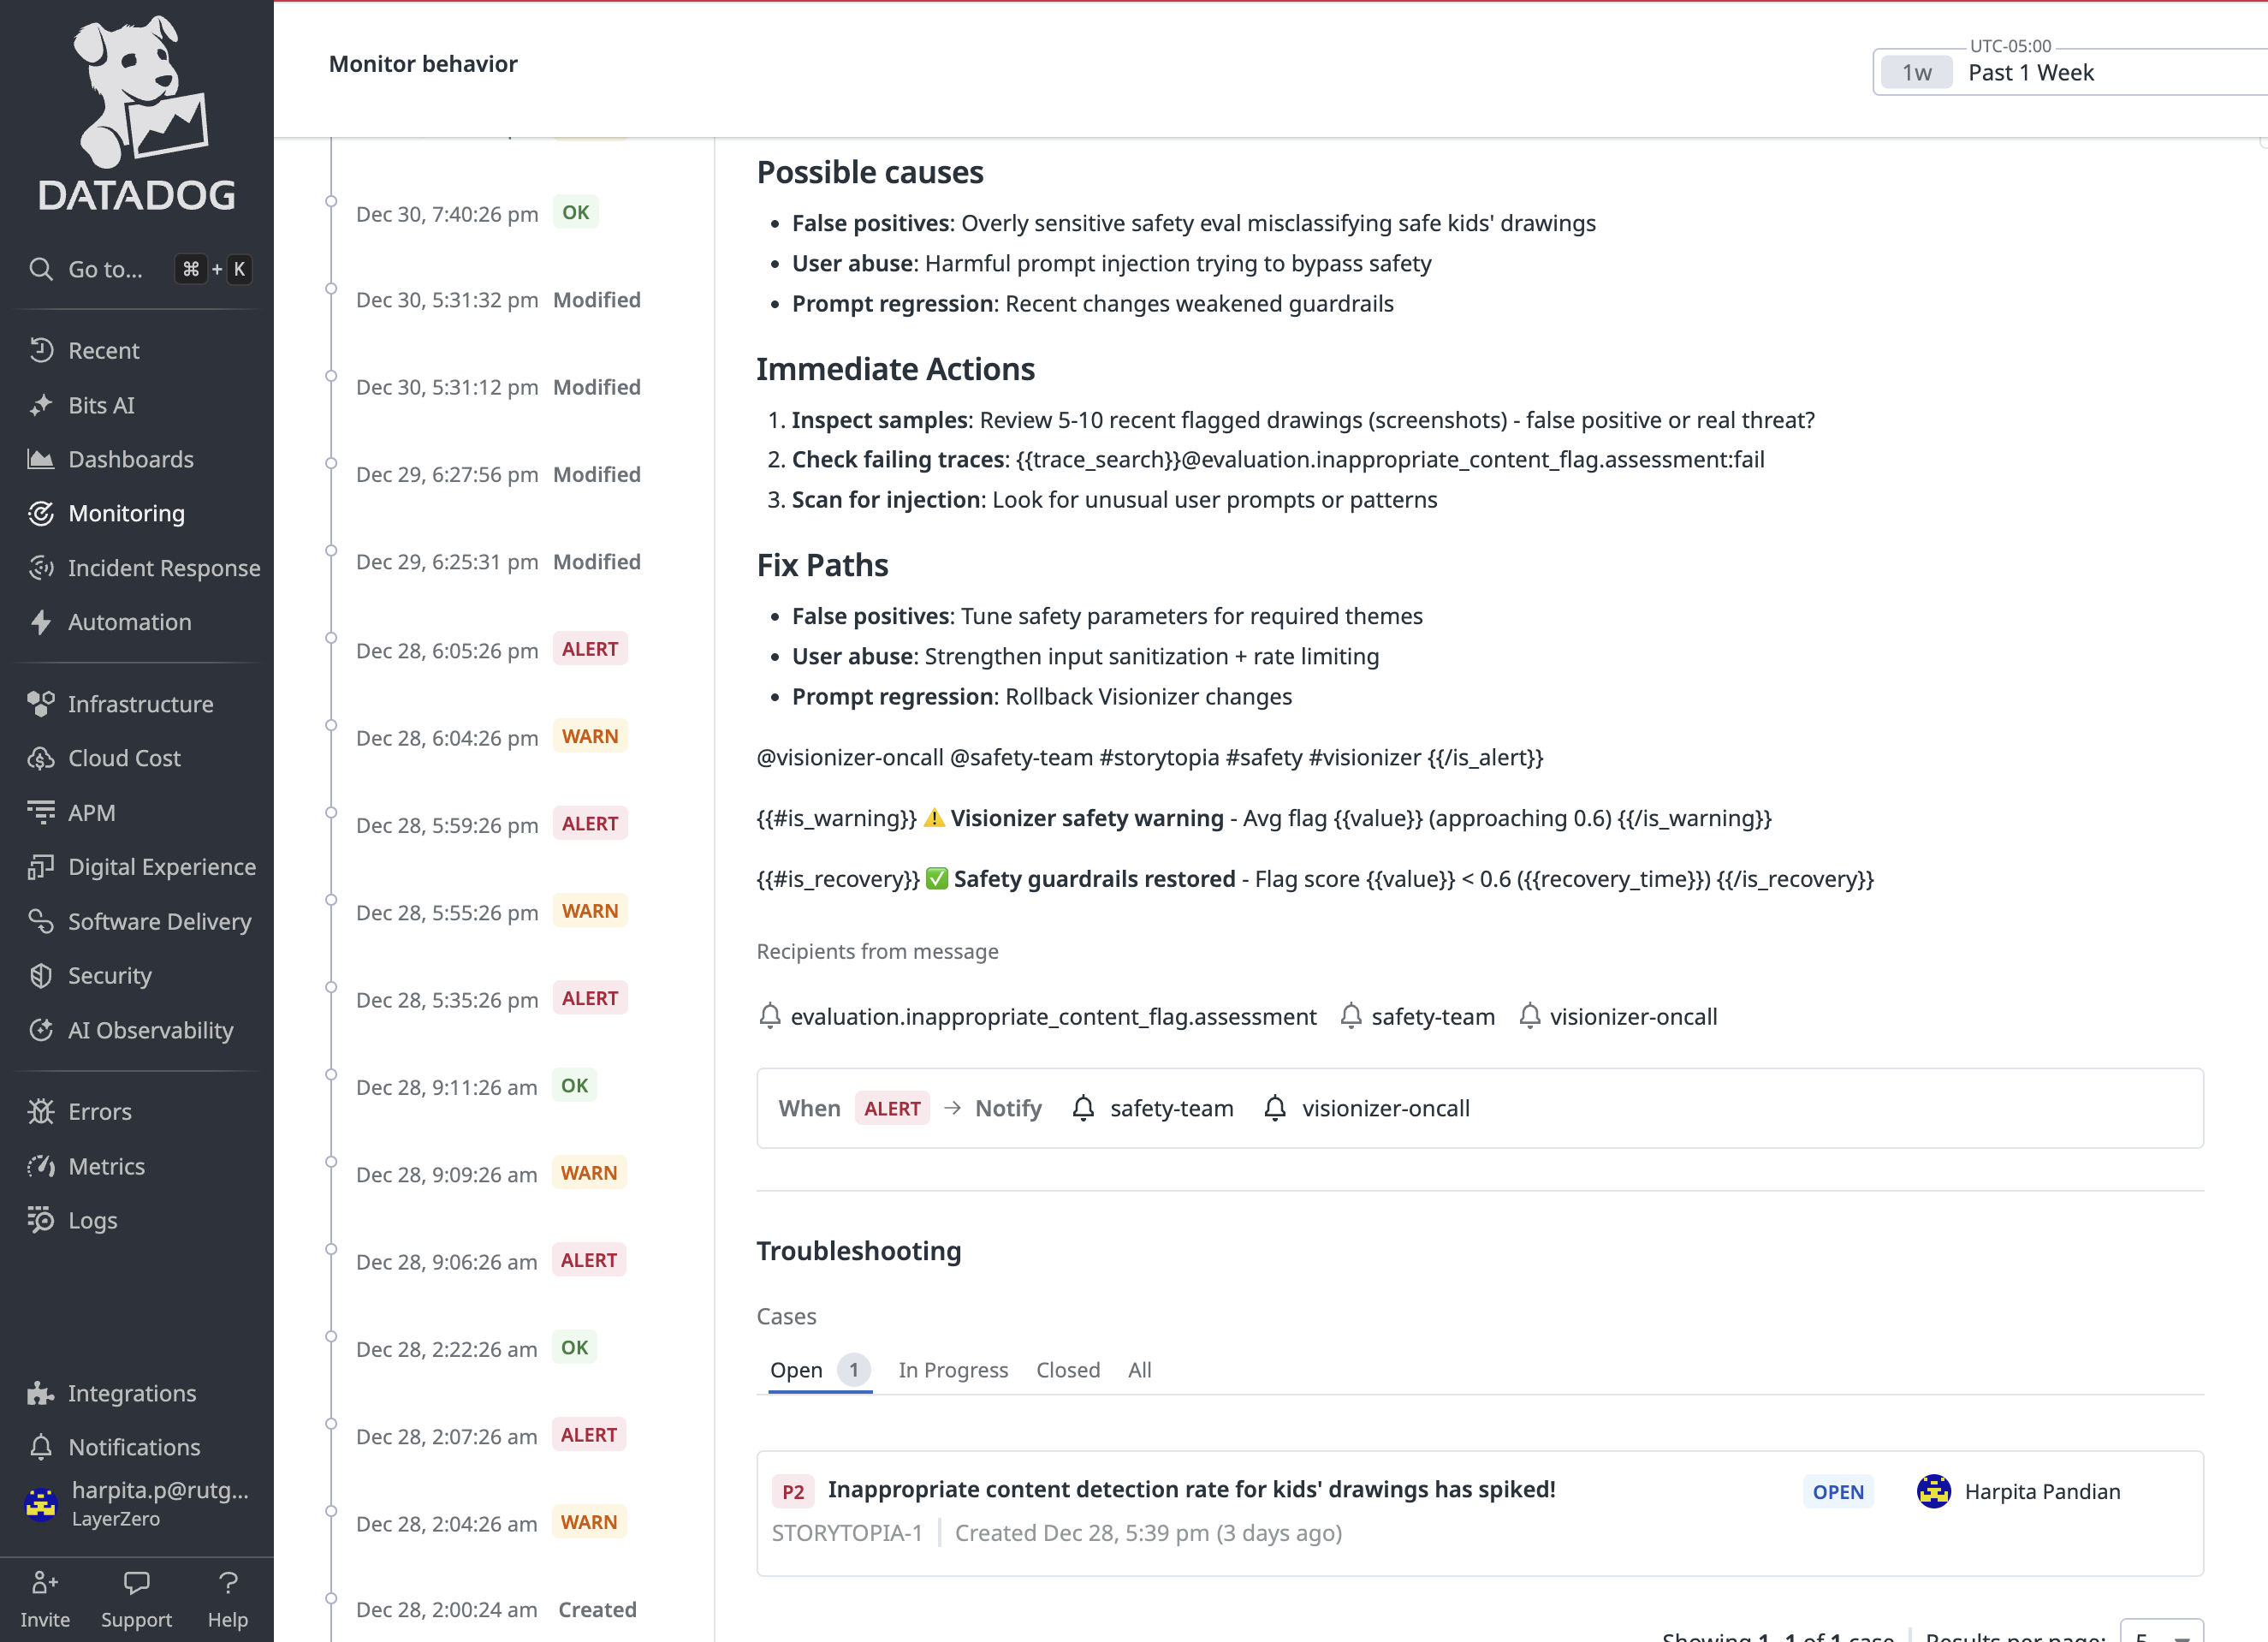
Context around the Signal + Open Case for teams to take action on
-

Our 5 AI Agent Evaluation Signals streamed as telemetry to Datadog
-
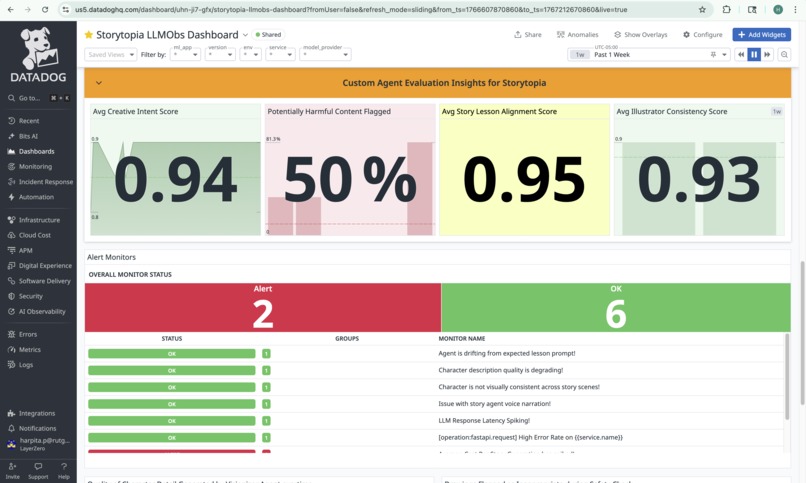
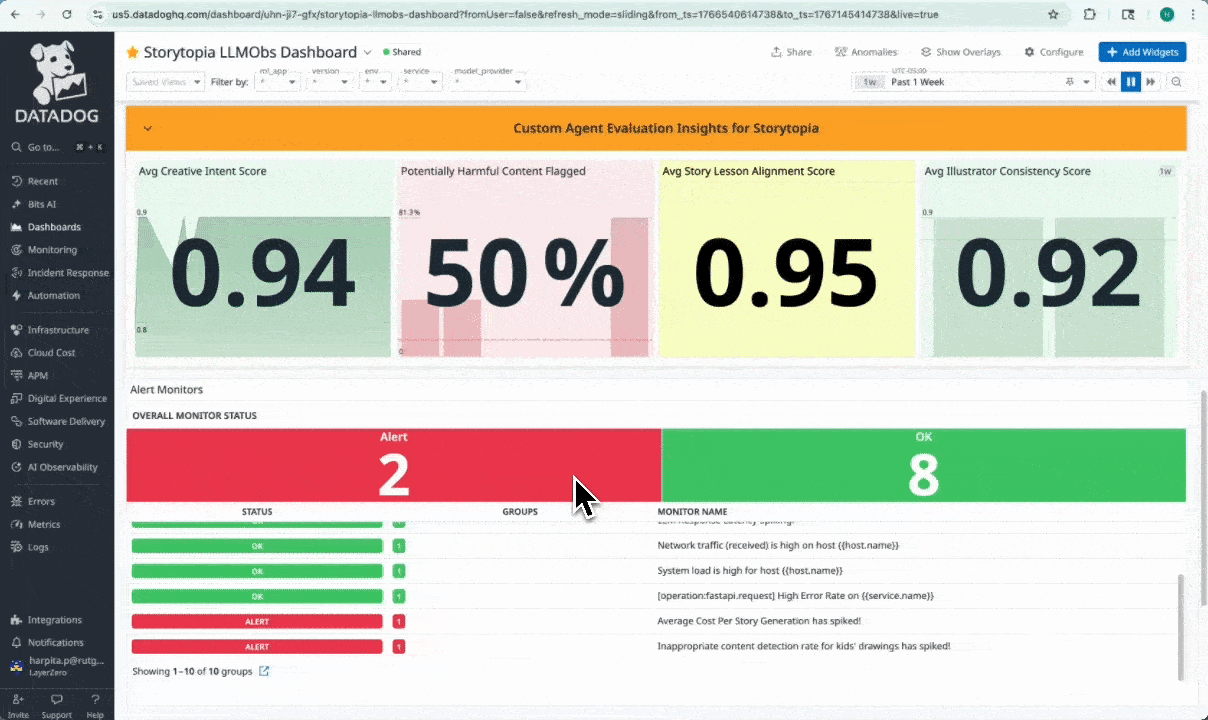
Datadog Dashboard with Agent-Specific Evaluation Signals + 7 Custom Alert Monitors


Inspiration & Challenge
We recently built Storytopia, a fun, multi-agent AI application that helps make screen time less passive and more creative for children. A major problem we noticed is that kids spend too much time passively consuming content online, instead of being authors of their own ideas. Storytopia lets kids draw their favorite characters and watch them come to life in an interactive, 8-scene storybook – complete with questions that encourage critical thinking and learning. Parents can also guide the learning experience by personalizing lesson themes like kindness, values, and real-life skills. The app uses a coordinated system of 3 AI agents built with the Google Agents SDK, powered by Gemini and Imagen models via Vertex AI for text and image generation. After hosting our app on Google Cloud Run, we were very excited to see kids & parents genuinely enjoy creating their own drawings & stories.
But as the AI engineers behind Storytopia, we faced a new challenge in monitoring the performance of our agents. Traditional metrics told us the app was “healthy,” but they couldn't answer the questions we were actually curious about:
- Are the AI agents in our app always producing high-quality & safe outputs across different kids’ drawings and stories?
- Where do the AI agents struggle? Are there any specific drawings / themes that the LLMs find difficult to analyze or generate?
We wanted a way to understand whether Storytopia was truly delivering the experience we promised – not just whether APIs were responding or servers were up. That curiosity led us to Datadog LLM Observability.
What we built
We built a Datadog-powered observability layer into our existing app Storytopia using Datadog’s LLM Observability SDK to capture rich telemetry on our AI agents.
What makes our observability approach unique is that we go beyond standard LLM telemetry – such as cost, latency, errors, and request traces – to also stream custom AI Agent Evaluation Telemetry that reflects how our multi-agent system behaves in production. These 5 unique signals are: Creative Intent, Inappropriate Content, Lesson Alignment, Visual Consistency, and Story Narration Status. These observability signals are crucial as they help us measure agent quality, safety indicators, and creative consistency across different user drawings and story inputs. On top of these signals, we configured custom Datadog alert monitors that trigger when evaluation metrics degrade, with actionable case context to quickly investigate and respond to issues. We put all these metrics together in a custom Datadog dashboard for Storytopia, (View here) with multiple widgets to monitor LLM operational insights and agent-level performance evaluations. For more technical details on our implementation, see below!
Instrumentation and Tracing
We instrumented the Storytopia backend using Datadog’s LLM Observability SDK alongside Datadog’s Python tracing library (ddtrace) to establish end-to-end visibility across our FastAPI service. Every user request is traced as it flows through API handling, multi-agent orchestration, LLM calls, and tool executions, providing a complete view of application behavior.
We were able to capture & stream to our dashboard:
- LLM request latency, token counts, and error rates
- LLM call timing and cost signals (Computing average cost per story created)
- End-to-end traces spanning our 3 AI agents (Visionizer, Quest Creator and Illustrator agents) with insights on prompt inputs, outputs, failure cases, etc.
Our Strategy: 5 Custom LLM Evaluation Signals for Smarter Agent Monitoring
As an innovative component, we designed 5 custom, externally computed LLM evaluation signals that capture how our AI agents perform beyond traditional system metrics. These signals are: Creative Intent, Inappropriate Content, Lesson Alignment, Visual Consistency, and Story Narration Status. These evaluations are computed by invoking an external evaluation system (AgentOps), which analyzes our agent outputs and returns structured scores with human-readable explanations. These evaluations are attached to active trace spans using Datadog’s LLM Observability SDK and streamed as first-class telemetry into Datadog.
Each evaluation is defined by:
- A clear label describing what is being measured
- A normalized metric value (typically a score between 0 and 1, or a binary 0/1 flag)
- A pass/fail assessment derived from configurable thresholds
- Contextual metadata tying the evaluation back to a specific agent, task, and user interaction
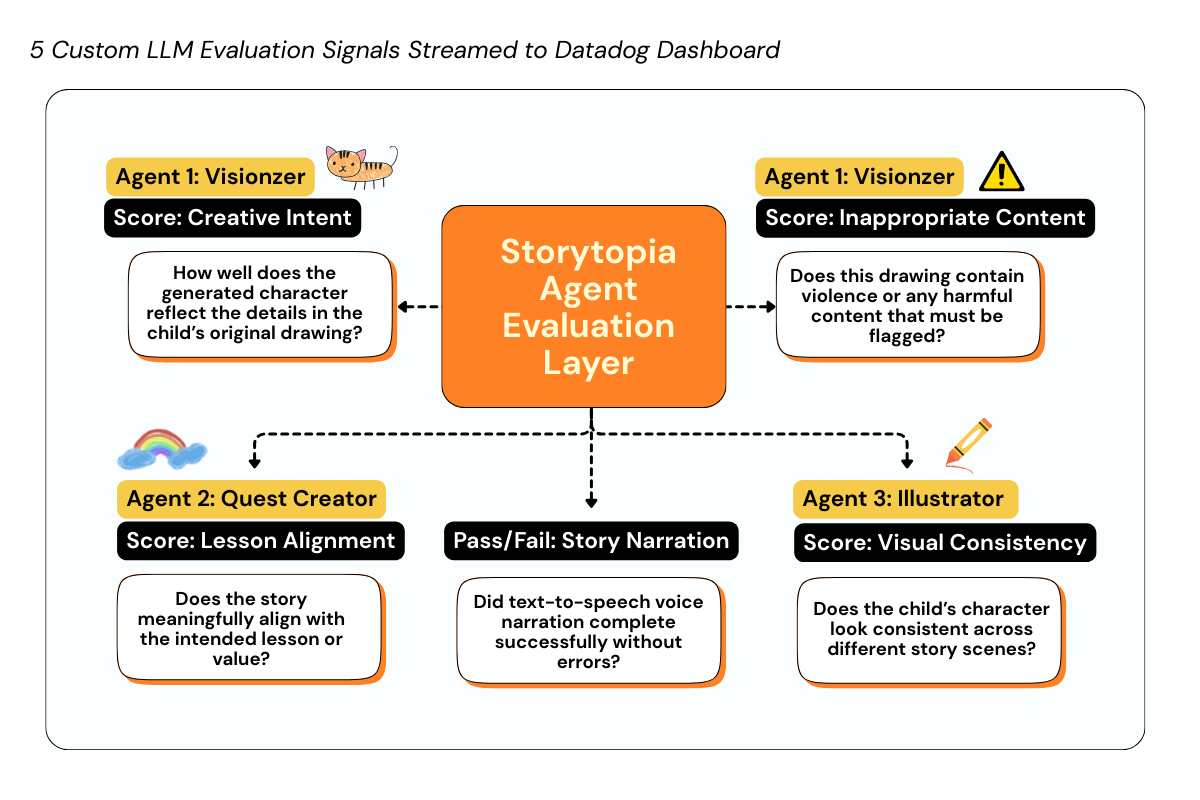
By correlating these 5 unique signals – Creative Intent, Inappropriate Content, Lesson Alignment, Visual Consistency, and Story Narration Status – with request traces, we can monitor silent quality and safety failures, understand where specific agents struggle in our Multi-Agent pipeline.
Custom Alert Monitors with Actionable Context
We built 7 custom Datadog alert monitors directly on top of Storytopia’s custom LLM evaluation signals to detect degradations in AI agent behavior in near real time. Each monitor includes actionable context, such as explicit descriptions of what signal degraded, why it matters to the user experience, and guided next steps (e.g., reviewing recent LLM traces, validating prompt changes, inspecting safety false positives, or identifying high-cost agent loops).
Criteria for Each of Our Detection Rules
| Monitor Name | Detection Criteria | Purpose / Impact |
|---|---|---|
| Inappropriate Content Detection Spike | Avg inappropriate_content_flag ≥ 0.6 over 5 minutes |
Surfaces Visionizer safety failures, false positives, or prompt abuse early to protect child safety |
| Lesson Prompt Drift Detection | Avg lesson_alignment_score < 0.6 over 5 minutes |
Ensures agents remain aligned with educational objectives, not just creative output |
| Character Visual Consistency Degradation | Avg illustrator_consistency < 0.7 over 5 minutes |
Catches character identity drift across scenes to preserve narrative continuity |
| Story Voice (TTS) Agent Failure | tts_status success rate < 50% |
Detects narration failures caused by TTS errors, quota exhaustion, or queue issues |
| Character Description Quality Regression | Avg creative_intent_score < 0.5 over 5 minutes |
Flags low-fidelity character descriptions that reduce immersion and visual grounding |
| Average Cost Per Story Spike | Computed cost per story > $1.80 (rolling 5 minutes) | Prevents budget overruns from token bloat, agent loops, or unintended model upgrades |
| LLM Response Latency Spike | Avg LLM span duration > 18s | Catches performance regressions that degrade the real-time storytelling experience |
Together, this approach turns LLM observability from passive monitoring into an active control layer – enabling fast, precise interventions and continuous improvement of our Storytopia multi-agent AI system.
Challenges we ran into
Instrumenting a multi-agent generative AI system and attaching custom external evaluations to the right trace spans was challenging, especially when navigating the SDK and figuring out where in the workflow each evaluation should be emitted. We found Datadog’s GitHub resources + Jupyter notebook demos for the LLM Observability SDK super helpful! We taught ourselves how to submit external evaluations, attach them to active traces, and verify that the resulting telemetry appeared correctly across our Datadog dashboard and traces.
Looking Ahead
Storytopia is now running in production, and this observability strategy gives us the confidence to monitor how our AI agents behave in real user scenarios – not just in controlled tests. By detecing silent quality and safety issues early, we can continuously refine prompts, improve agent coordination, and raise the overall experience for kids and parents using our app! Try out Storytopia today - Open Storytopia Web App (Best viewed on Desktop or iPad as mobile layout not yet fully optimized).
🔗 View Storytopia's Datadog Dashboard
https://p.us5.datadoghq.com/sb/c7d3a3fb-e381-11f0-84dd-828a698ac737-4c196bb0c4c7eefb0add01f19bff8a5f


Log in or sign up for Devpost to join the conversation.