-
-
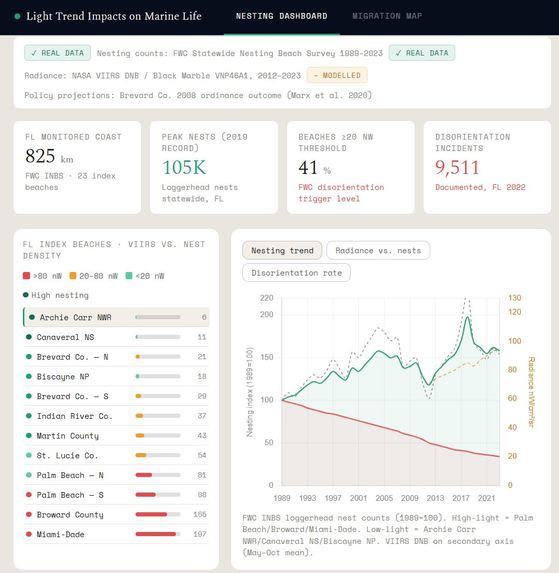
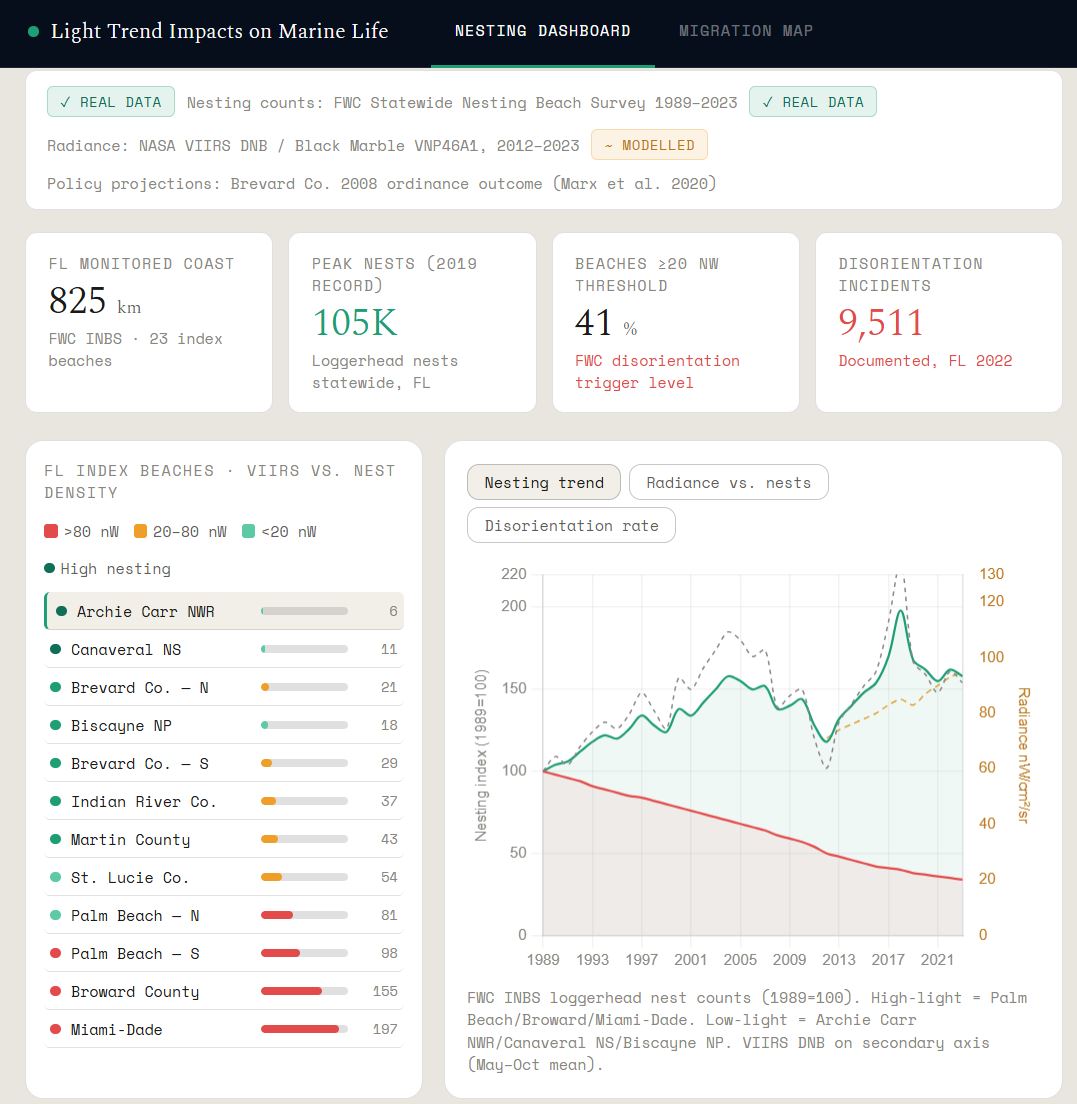
Snippet of our dashboard
Inspiration
We kept reading about sea turtle hatchling disorientation but couldn't find anything that actually showed the scale of the problem visually. We wanted to know if you could see the damage light pollution was doing just by overlaying satellite imagery on nesting records — and the answer was a pretty alarming yes. The 68% nesting decline on high-light beaches versus almost no decline on protected beaches made us realize this wasn't just an environmental talking point, it was a quantifiable crisis with a clear geographic signature. That's what pushed us to build something that could turn that data into a real policy argument.
What it does
There are two parts to our interactive data showcase, and those are the telemetry map, and the charts & visualization. The charts and visualization have three parts -
The graphs, there is a scatterplot, a bar graph, and an overlapping color map to represent yearly trends, these just showcase the worsening conditions for turtles on our coastlines. Urban Squeeze - Loss Model, we have a selection of beaches to choose from and through the loss model we can see if these zones fall into red, green, or yellow depending on how safe and suitable that area is for turtles. Policy Impact Modeler, what this does is it is a clear cut way to get through and showcase policy makers, with some sliders about the attainable goals, and future outcomes of applying non-costly solutions, and how much attainable beach we can regain for the turtles.
How we built it
The way we built ShoreLight, was first researching through multiple databases, and finding a marine mammal to focus on that could be impacted by humans and their environmental actions. that is the way we landed on choosing the turtle. After that we navigated through multiple databases (one of the two being OBIS-SEAMAP), to get the data we needed to generate the charts and our map. Afterwards, we kept building and writing our code on python, updating our rough drafts and occasionally pasting our code into Claude when we ran into error or wanted to upgrade our visuals)
Challenges we ran into
Some challenges we ran into were most surely early on, when we were getting our whole idea together. One word: data. Finding, agreeing upon, and executing on research from all our collective databases was our biggest obstacle — figuring out which datasets were credible, which numbers were comparable across different sources, and how to present information we had never worked with before in a way that was accurate and honest. But once we got that settled on our first day, the momentum shifted completely. We worked together to make decisions quickly, leaned on each other when one of us got stuck, and pushed through the moments where it felt like the project was bigger than our skill level. Looking back, the data challenge that felt like our biggest setback early on is actually what made the final product stronger — because we took the time to get it right instead of just making something that looked good on the surface.
Accomplishments that we're proud of
When we started this hackathon, both of our coding skills were minimal — we genuinely weren't sure what we were capable of building in this timeframe, and that uncertainty was intimidating. Over the course of the project we taught ourselves far more than we expected, especially around CSS, data visualization, and how to structure a multi-panel interactive dashboard from scratch. We are equally proud of how well we worked together as a team: we pushed each other to keep going when things felt too hard, divided problems in a way that played to each of our strengths, and supported each other through every bug and rebuild. Most of all, we are proud of what we actually shipped — a real, polished, data-grounded tool that neither of us could have imagined building 48 hours ago, and that we genuinely believe could make a difference if it got into the right hands.
What we learned
We learned so much about how human activity and light pollution caused by humans are slowly, but surely wiping out the existence and creating harm to not just turtles, but many marine mammal species. We learned about their migration paths, we learned about steps we can take as a community, and steps policymakers themselves could take (such as amber covers on streetlights - to help solve the problem.
What's next for Light Trend Impacts on Marine Life
The next thing that we hope Light Trend Impacts on Marine Life - or Simply our name, ShoreLight to add more datasets and more variables to our code. We also want to spread awareness and help policymakers and help additionally sway the general public into learning about a better future for these turtles and the steps that we as humans can help to restore it.

Log in or sign up for Devpost to join the conversation.