-
-
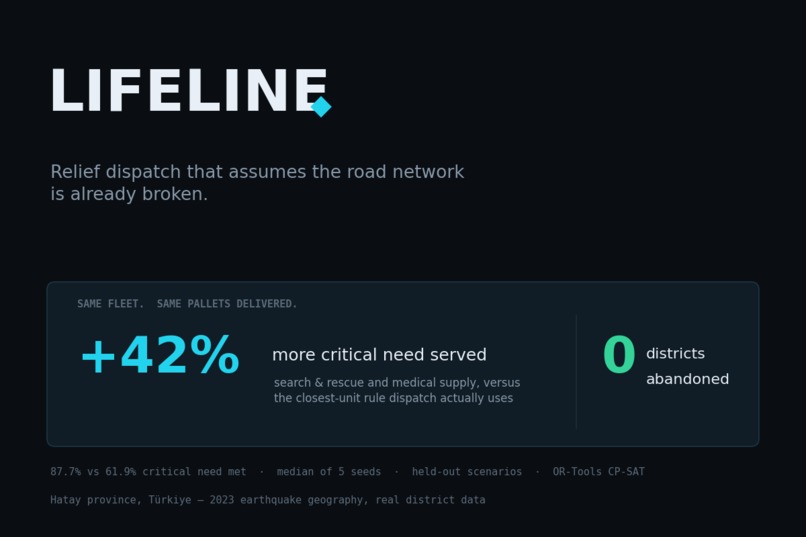
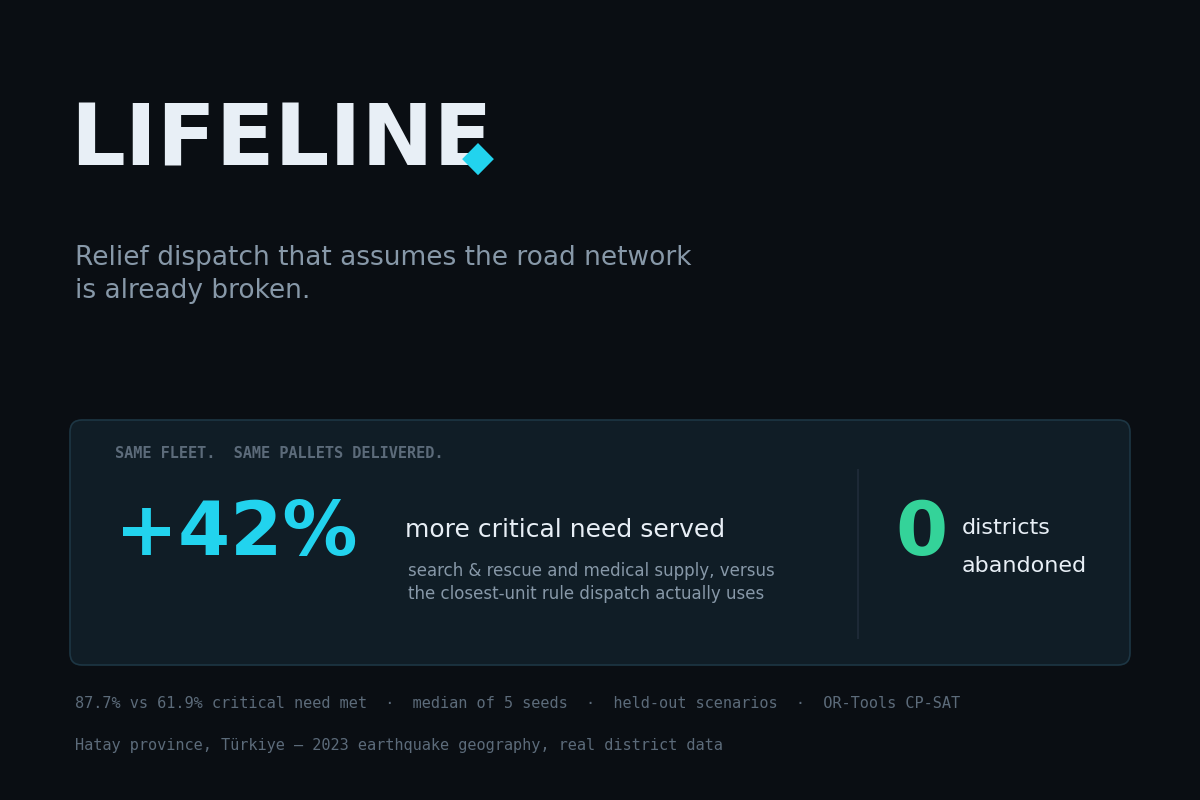
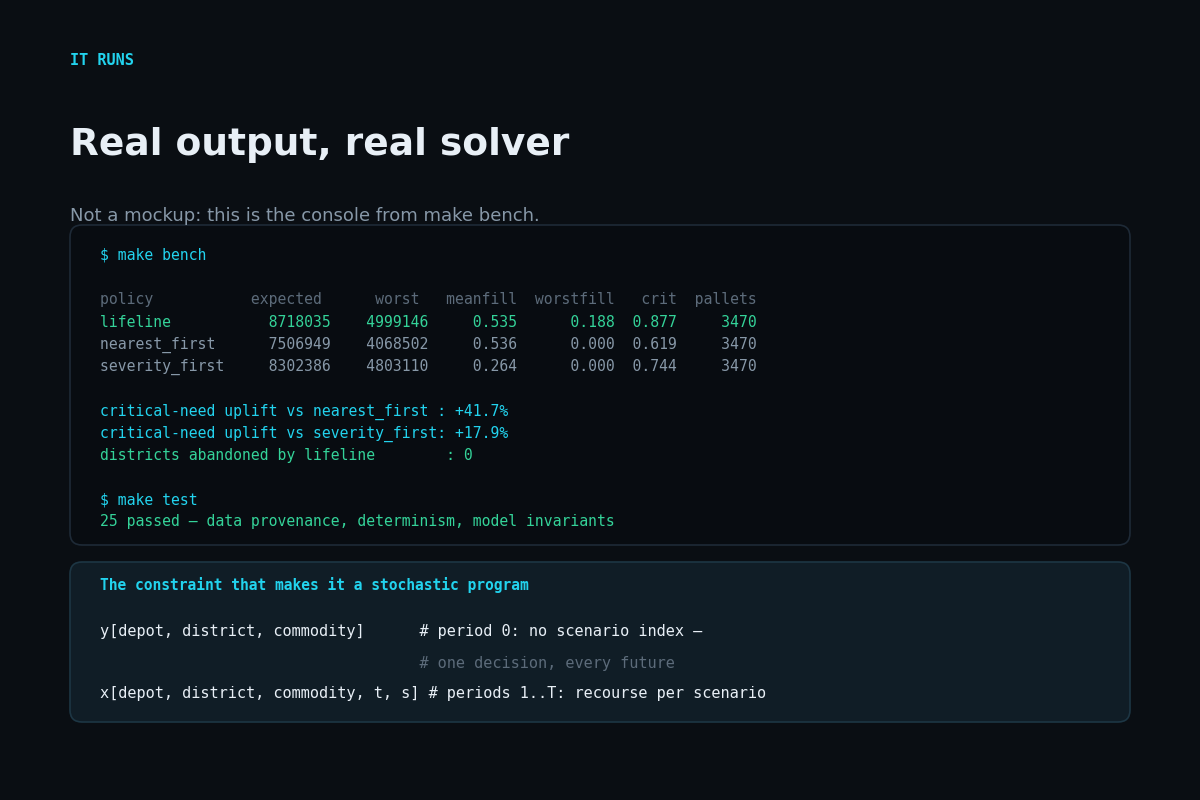
Same fleet, same pallets delivered: 42% more critical need served, and no district abandoned.
-
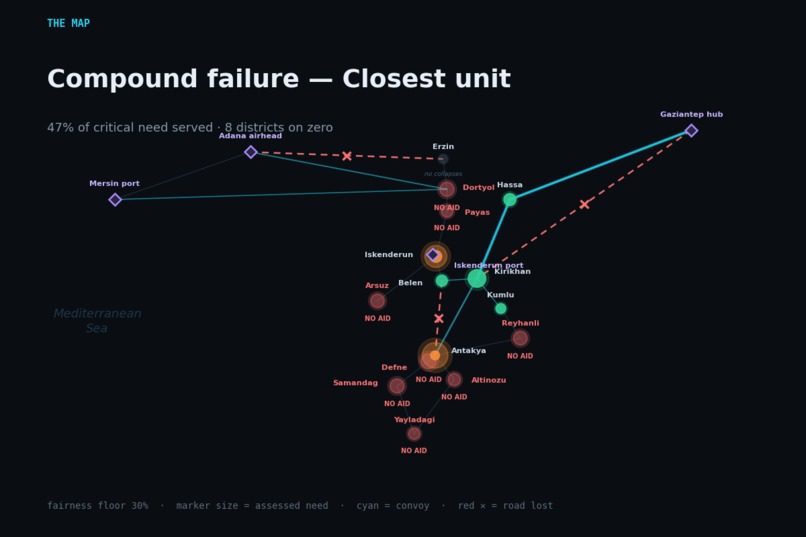
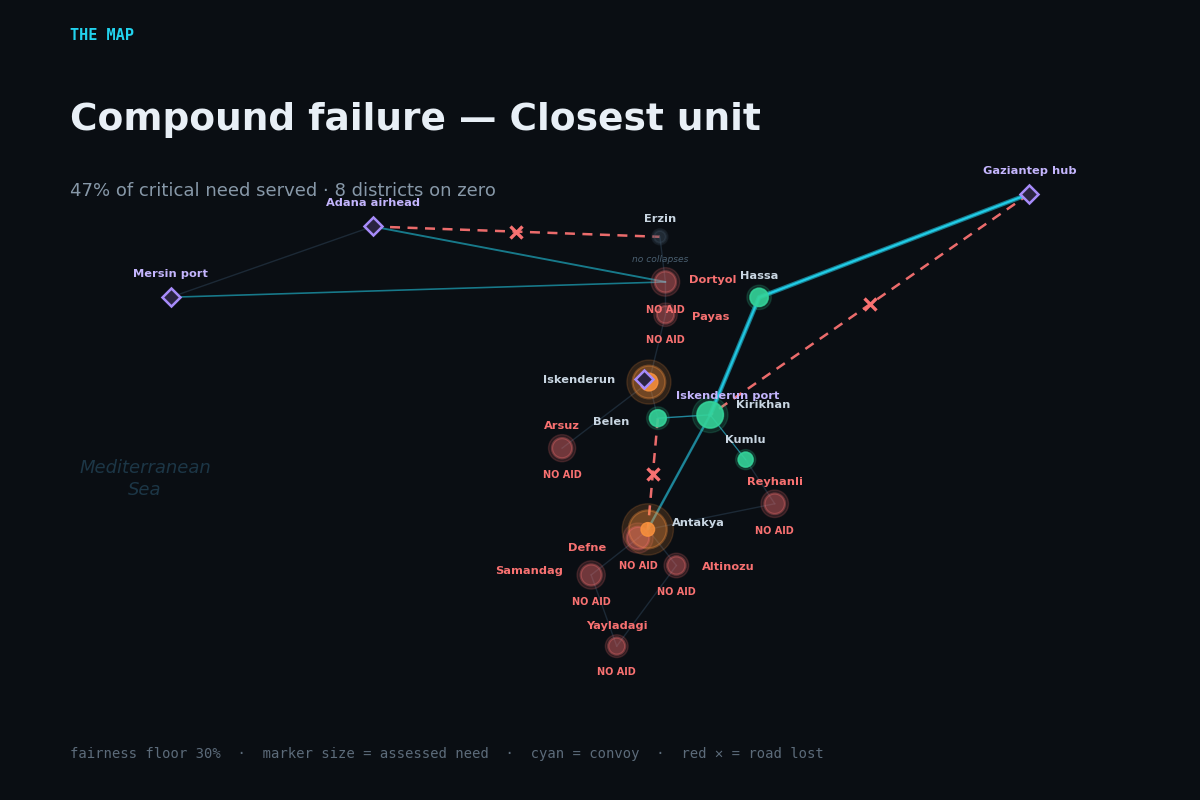
The same failure under closest-unit dispatch: eight districts marked NO AID.
-
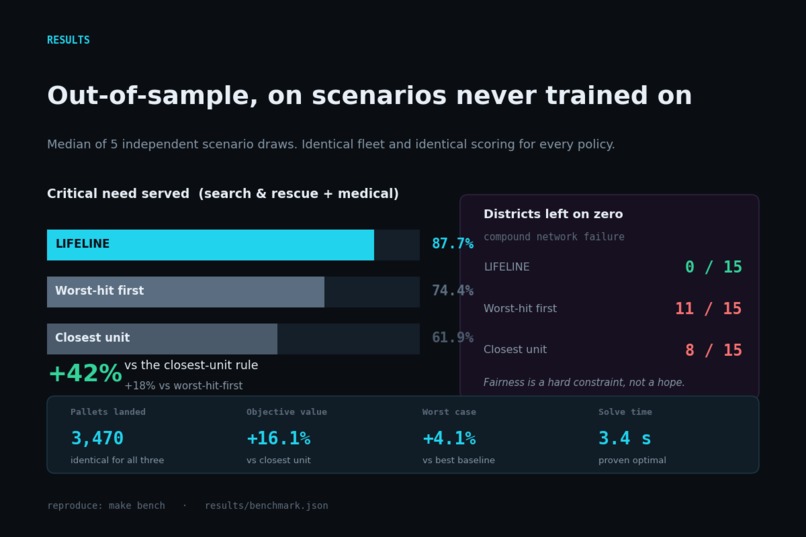
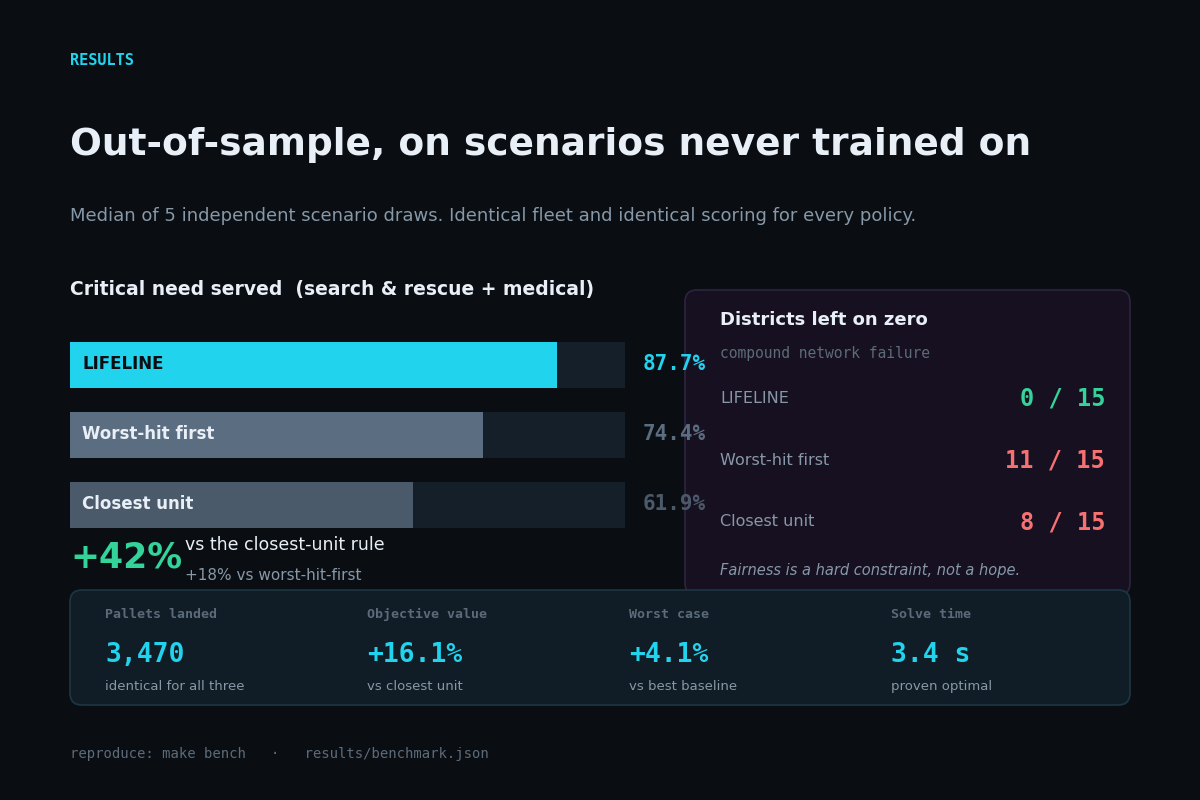
Out-of-sample results on held-out scenarios, median of 5 seeds. Identical fleet and scoring for all three policies.
-
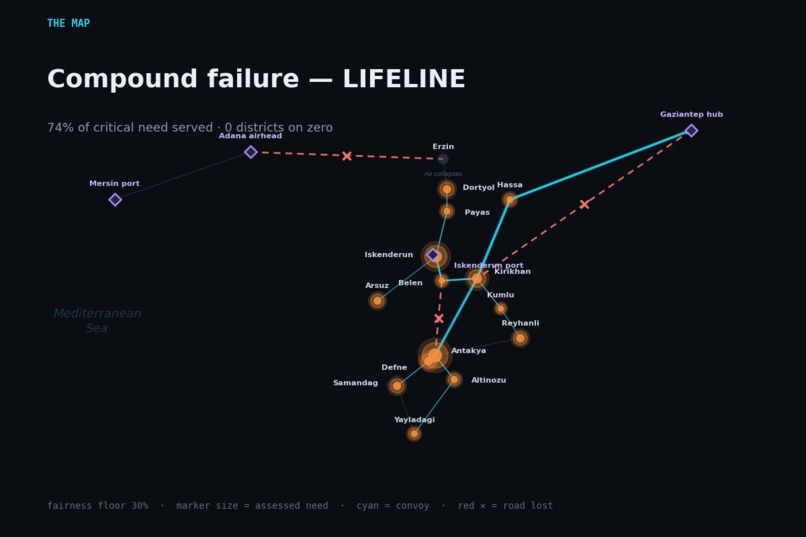
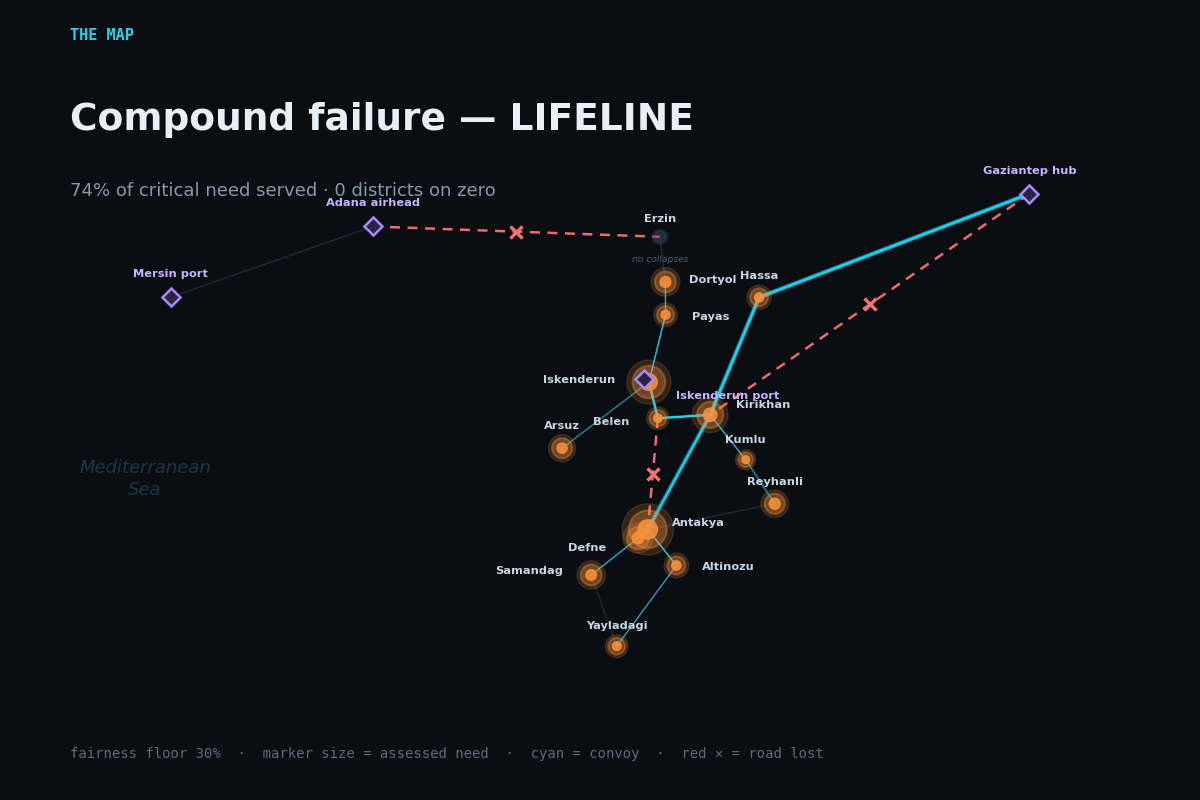
Compound network failure under LIFELINE: every one of the 15 districts is reached.
-
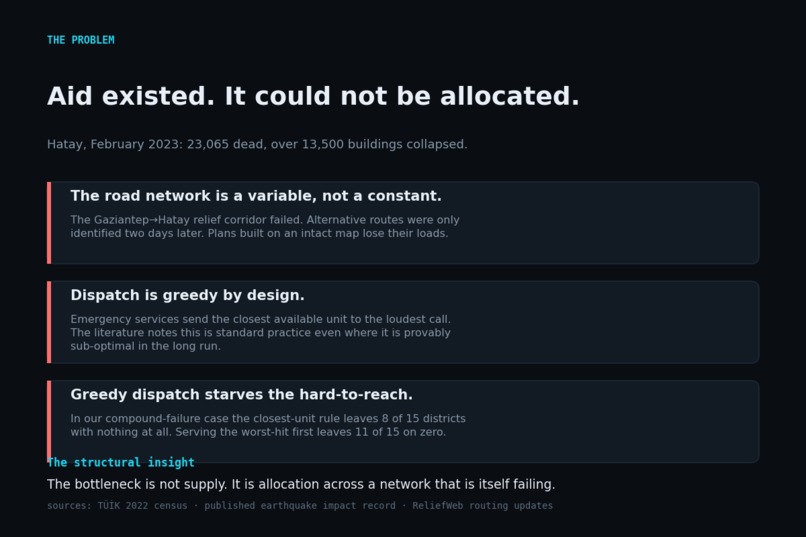
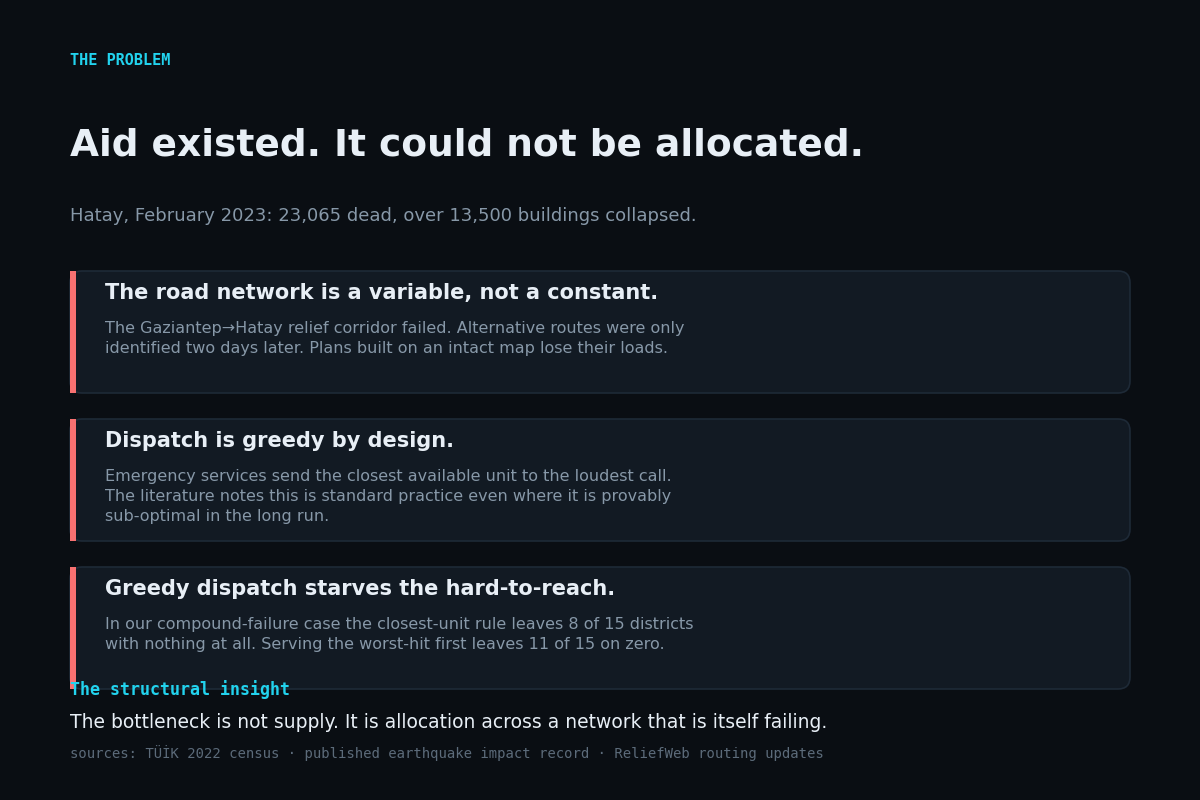
Hatay, February 2023. Aid existed; it could not be allocated across a network that was itself destroyed.
-
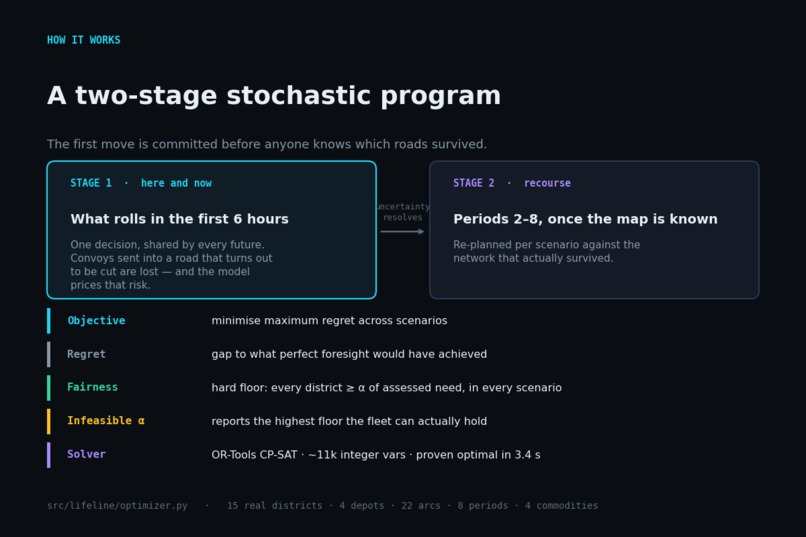
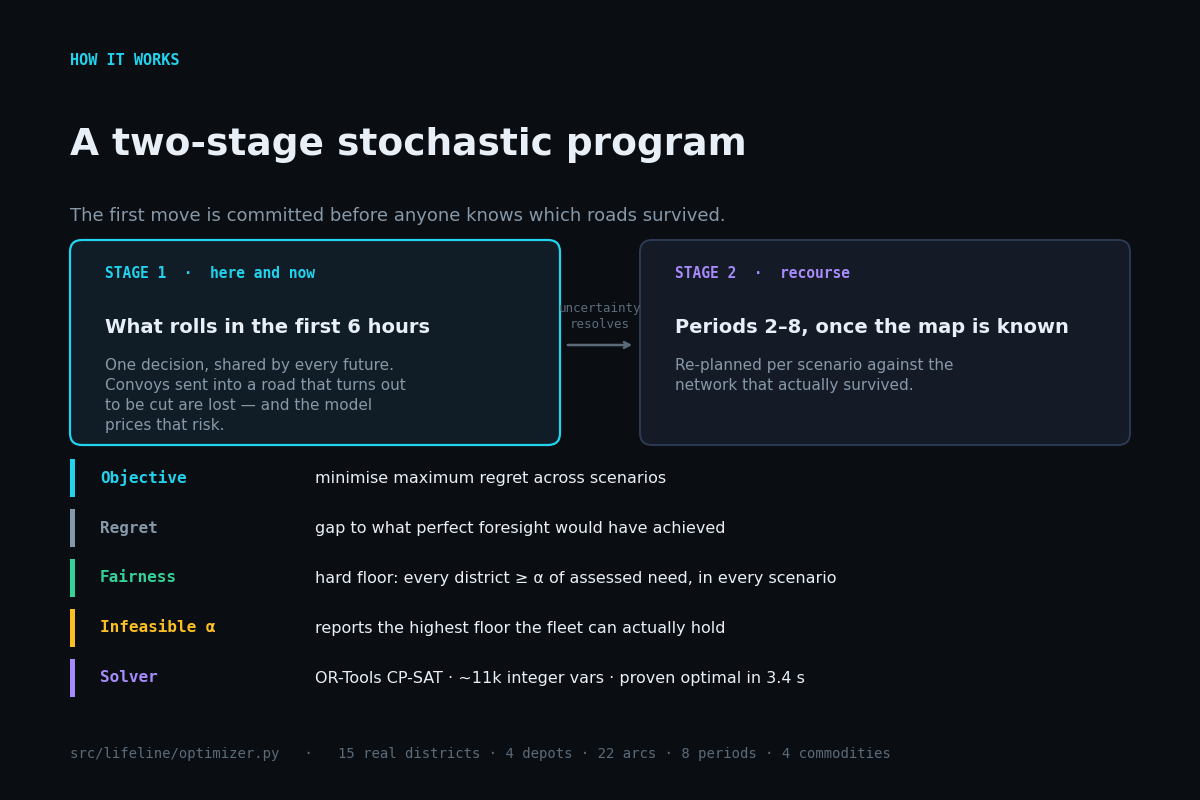
A two-stage stochastic program. The first move is committed before anyone knows which roads survived.
-
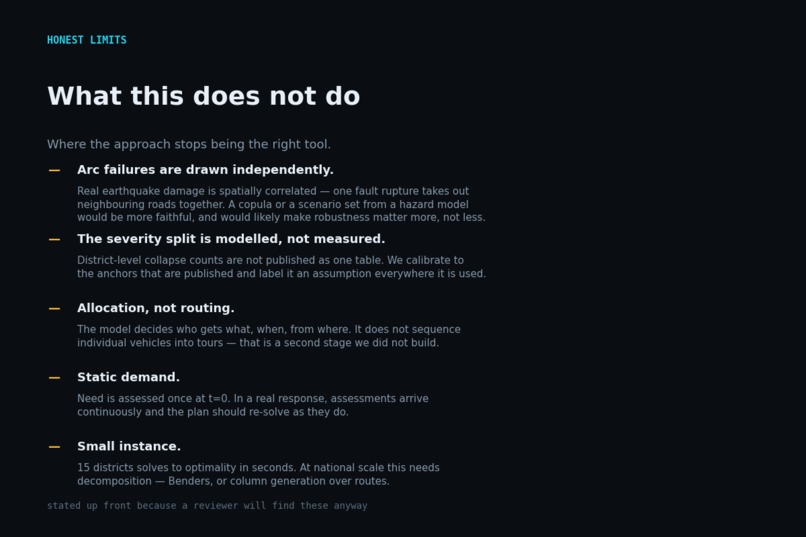
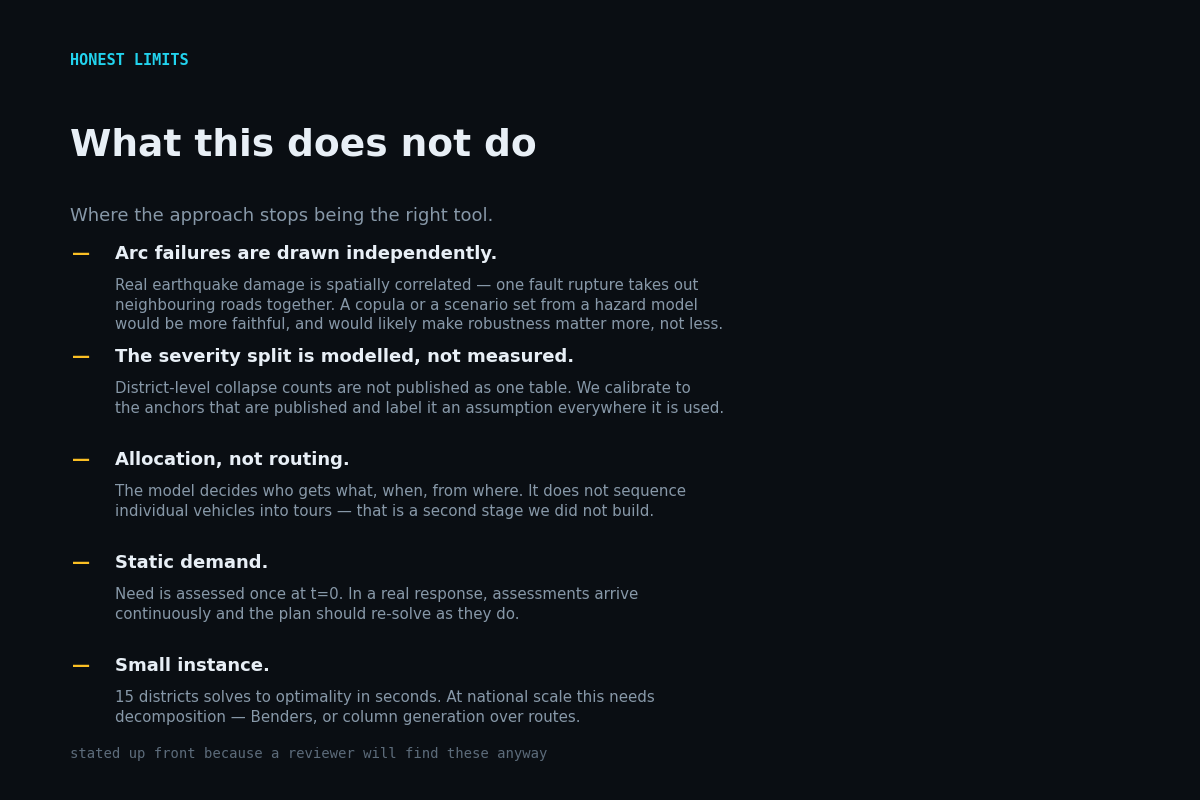
What this does not do, and where the approach stops winning. Stated up front.
-
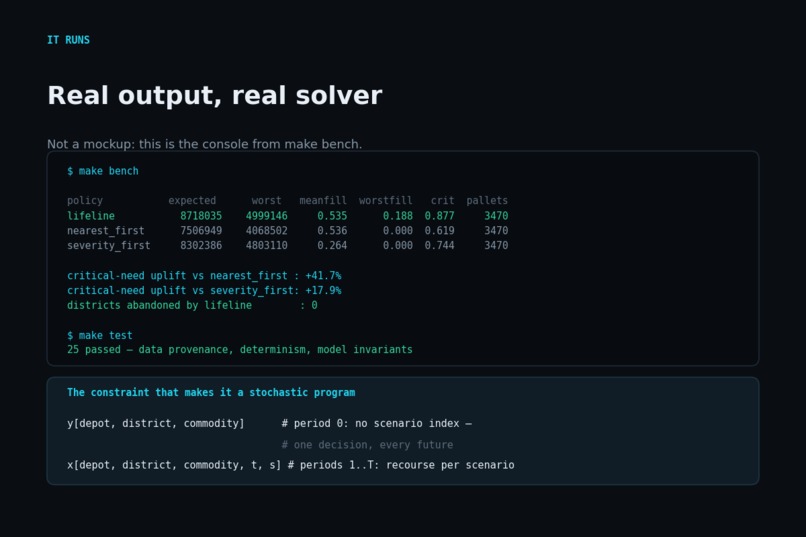
Real console output from make bench and make test. Not a mockup.
Inspiration
In February 2023, two earthquakes hit southern Türkiye. Hatay province alone recorded 23,065 deaths and more than 13,500 collapsed buildings.
What stayed with me was a line from a social worker in the response: there was abundant aid, and it could not be distributed. The bottleneck was never supply. The road network the aid had to cross had itself been destroyed — the Gaziantep to Hatay corridor was impaired, and alternative routes were not identified until 8 February, two days into the window where people under rubble are still alive.
Meanwhile dispatch ran the way dispatch always runs: send the closest available unit to the loudest call. That is not incompetence — survey work on emergency response notes that ethical and legal norms actively push responders toward closest-unit dispatch, even where it is provably sub-optimal across a whole response. It is the rule, and the rule quietly starves whoever is hard to reach.
I wanted to know how much that costs, and whether optimisation could buy it back without a single extra truck.
What it does
LIFELINE plans relief dispatch across Hatay's 15 real districts from four real staging hubs, over a 48-hour horizon, on a road network that is actively failing.
It is a two-stage stochastic program. Stage one decides what rolls in the first six hours — committed before anyone knows which roads survived. Stage two re-plans once the map is revealed. The objective minimises maximum regret: for every scenario we first compute what a planner with perfect foresight would have achieved, then minimise the worst gap to that ideal. In a disaster the tail is the part that kills people, so optimising the average is the wrong instinct.
Fairness is a hard constraint rather than a hoped-for side effect. A floor requires every district to receive at least that share of its assessed need, in every scenario. And when the fleet cannot hold the floor you asked for, LIFELINE does not return "infeasible" — it computes the highest floor that is attainable and solves at that, because telling a coordinator "you can guarantee 26%, not 30%" is a usable answer and an error message is not.
The result, measured out-of-sample on scenarios the optimiser never trained on, median of five independent seeds: 87.7% of critical (search-and-rescue and medical) need served, against 61.9% for closest-unit dispatch and 74.4% for serving the worst-hit first. A 42% improvement, with an identical fleet delivering an identical 3,470 pallets.
And the part I did not expect: under compound network failure, closest-unit dispatch leaves 8 of 15 districts with nothing at all, and worst-hit-first — the obvious smart heuristic — leaves 11 of 15. LIFELINE leaves none.
How I built it
Python and OR-Tools CP-SAT. Around 11,000 integer variables; solves to proven optimality in about three seconds.
The instance is built on real data. All 15 Hatay districts carry Turkish Statistical Institute populations as at 31 December 2022, and they sum to exactly the published provincial total of 1,686,043 — there is a test that enforces it. The four depots mirror the corridors documented in the actual response. Erzin, recorded as the one district with no building collapses, is pinned to zero severity and receives no allocation; a test enforces that too.
Where I had to model rather than measure — district-level collapse counts are not published as a single table — the assumption is tagged as an assumption in a provenance ledger that the web UI displays. I would rather a judge see "this is calibrated, not observed" than find it themselves.
Two deliberate choices about rigour. First, there are two baselines, not one: the naive closest-unit rule and a competent severity-first heuristic. Beating only the naive policy would prove very little. Second, everything is scored out-of-sample by a single shared function, with all three policies committing period zero blind and adapting from period one — identical information, identical scoring, identical fleet.
The interactive map is hand-drawn SVG with no tile server, no CDN and no API key, so it cannot fail while a judge is looking at it. The whole demo also ships as one self-contained HTML file you can double-click.
Challenges I ran into
Two bugs changed the answer, and both were caught by distrusting a result rather than a line of code.
The baselines were cheating. My first harness let the greedy policies see the true network from period 0 while LIFELINE had to commit blind — perfect foresight, handed to the control group. Severity-first duly "beat" the optimiser. The tell was that it should have been impossible: an optimal solver cannot lose to a heuristic on its own objective under the same constraints. Fixing the information sets fixed the ranking.
My non-anticipativity constraint was accidentally a timidity constraint. I enforced "the first move must be one plan across all futures" by forcing any route that fails in any scenario to zero. That is not what commitment under uncertainty means. It cut the first wave from 570 pallets to 170 and hobbled the plan. The right semantics is that you dispatch blind and lose the load if that road turns out to be gone — the capacity is spent either way, and the objective should price exactly that risk. Rewriting stage one around scenario-independent dispatch variables with scenario-dependent arrival was the single biggest improvement in the project.
A smaller one: my first "critical arc" analysis confidently reported that the most important road in Hatay was the spur into Arsuz. It was right and useless — cutting any leaf node's only road is trivially catastrophic. Separating "severing" arcs from "degrading" ones turned a tautology into an actual finding.
What I learned
That the interesting question in humanitarian logistics is not "what is the best plan" but "what is the best plan given that you must move before you know anything". The value of the model is concentrated almost entirely in the first six hours, which is exactly the period where a human planner has the least information and the least time.
Also, concretely: that fairness was nearly free here. Going from no fairness floor to a 15% guaranteed floor cost essentially nothing in total value. The trade-off everyone assumes exists was, on this instance, mostly not there — and you only find that out by making fairness an explicit constraint you can dial.
What's next
Spatially correlated arc failures from a real hazard model, rather than independent draws — earthquake damage clusters, and I suspect that makes robustness matter more, not less. Rolling re-assessment so demand updates as survey data arrives. And decomposition (Benders, or column generation over routes) to take it past a single province.
A note on tooling
Developed with AI pair-programming. All code was reviewed, executed and verified
by me; every number reported here comes from a run reproducible with make bench,
and make verify re-derives the artifacts and checks they still agree.
Built With
- constraint-programming
- cp-sat
- disaster-response
- humanitarian-logistics
- integer-programming
- javascript
- matplotlib
- operations-research
- or-tools
- python
- stochastic-optimization
- svg

Log in or sign up for Devpost to join the conversation.