Inspiration
I have always been curious about how wellbeing varies across countries and how factors like health, environment, education, and work shape people’s lives. When I discovered the OECD wellbeing dataset, I saw a chance to explore how quality of life can be measured beyond GDP.
This is also my very first hackathon. As a first-year B.E. IT student from India, I didn’t know much about hackathons before joining. I wanted to experience what a hackathon is, learn new skills, and begin my journey in tech. I also used AI for guidance, which made the process more structured and educational for me.
What it does
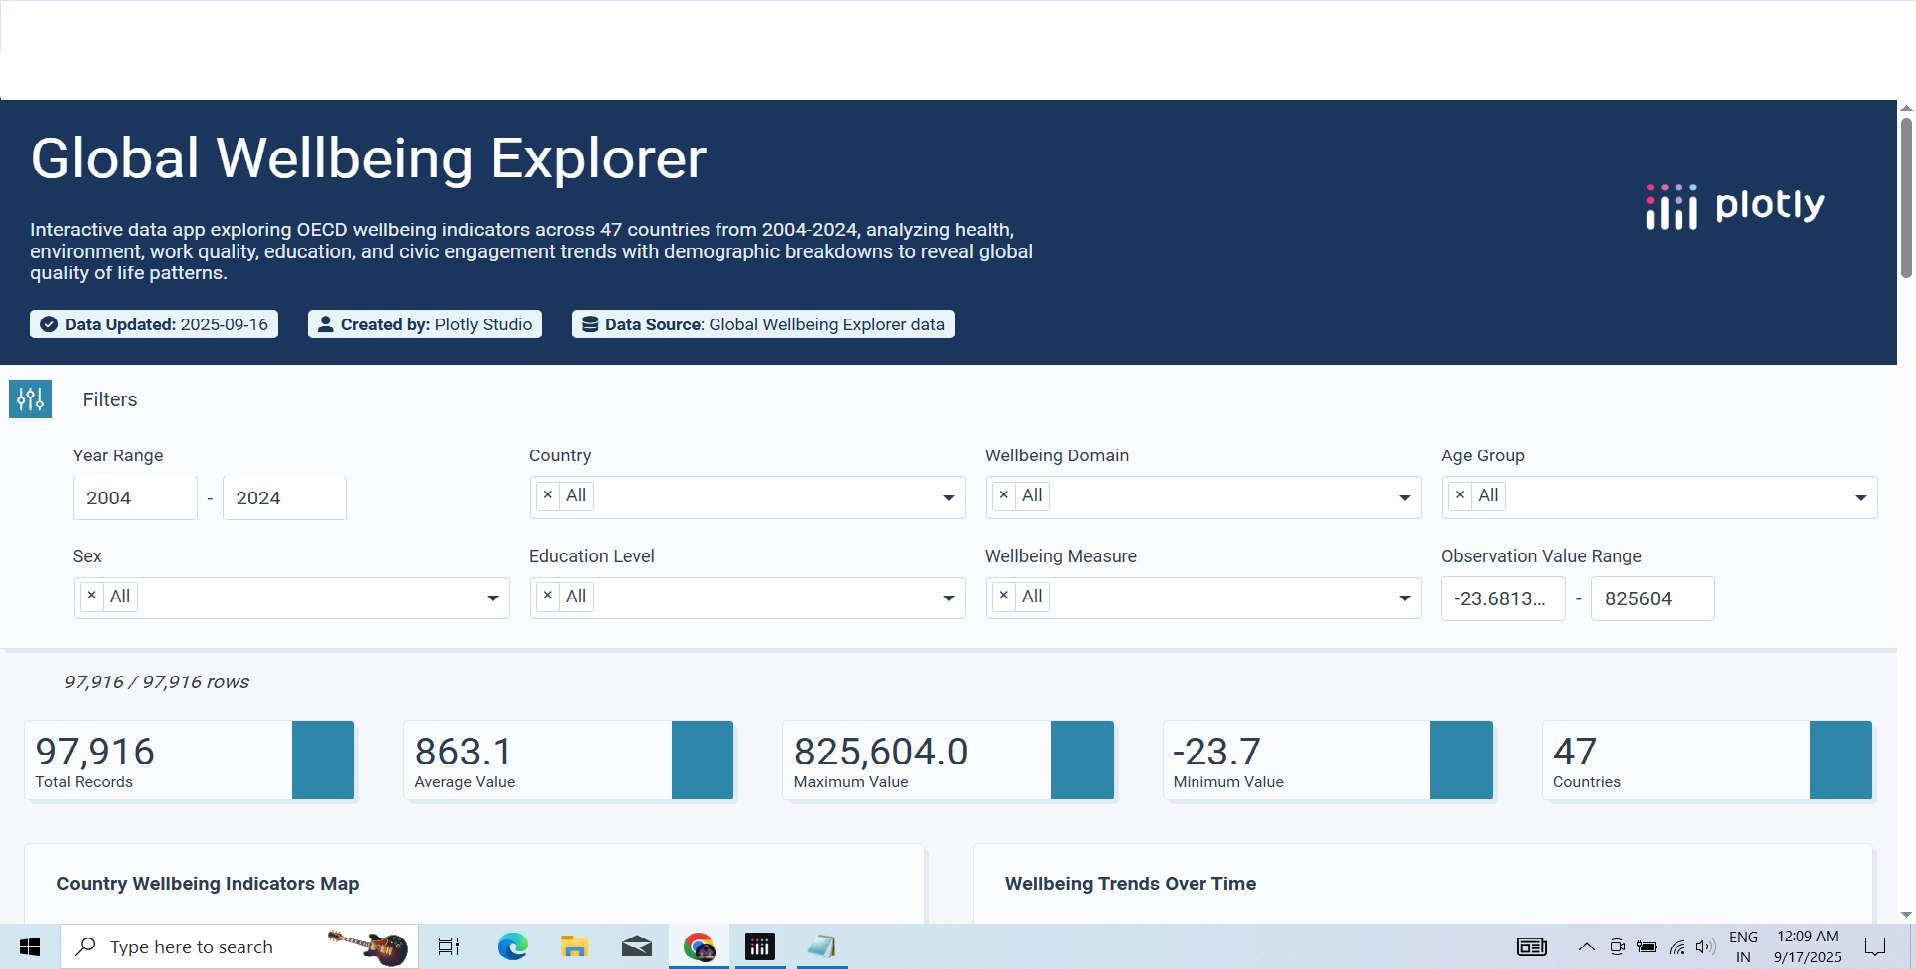
LifeLens: OECD Wellbeing Dashboard is an interactive data app that allows users to: -Compare wellbeing indicators across 47 countries. -Track trends from 2004–2024. -Explore domain strengths and weaknesses (health, environment, work, civic engagement, etc.). -Analyze inequalities across age, sex, and education. -Discover relationships between wellbeing factors (e.g., income vs life expectancy). The app turns raw data into a storytelling dashboard that highlights both global patterns and local inequalities.
How we built it
Challenges we ran into
Being new to hackathons, it was overwhelming to know where to begin. The dataset was large and complex, requiring careful filtering and structuring. I had to learn how to design not just charts, but data stories that make sense to the user. I balanced using AI support with my own creativity, learning how to apply guidance effectively.
Accomplishments that we're proud of
Built a fully working interactive dashboard in my very first hackathon. Learned how to transform a massive dataset into meaningful visual insights. Highlighted global inequalities and strengths in a way that is easy to explore. Took my first step as a BE IT student into real-world data visualization and hackathon culture.
What we learned
How to use Plotly Studio for data storytelling and interactivity. How to design visuals that explain, not just display. How wellbeing can be measured in multiple dimensions beyond economics. How AI can be a learning partner when guided correctly. Most importantly: what a hackathon experience feels like — from challenges to growth. Mathematically, I even thought about a simple Wellbeing Index formula This way, a country’s overall wellbeing score can be summarized and compared.
What's next for LifeLens: OECD Wellbeing Dashboard (creative + analytical)
Built With
- chatgpt
- python

Log in or sign up for Devpost to join the conversation.