-
-
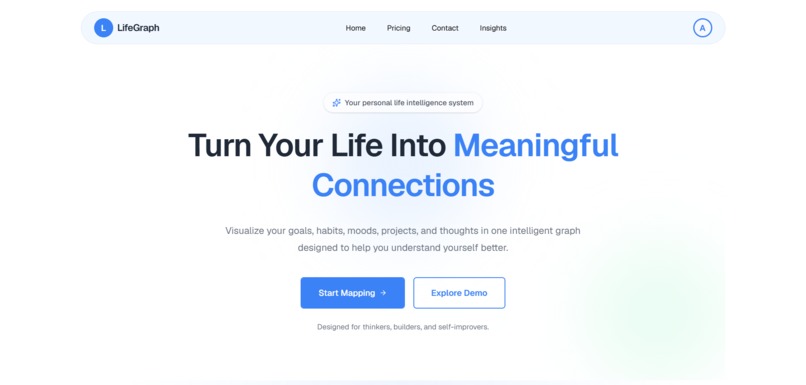
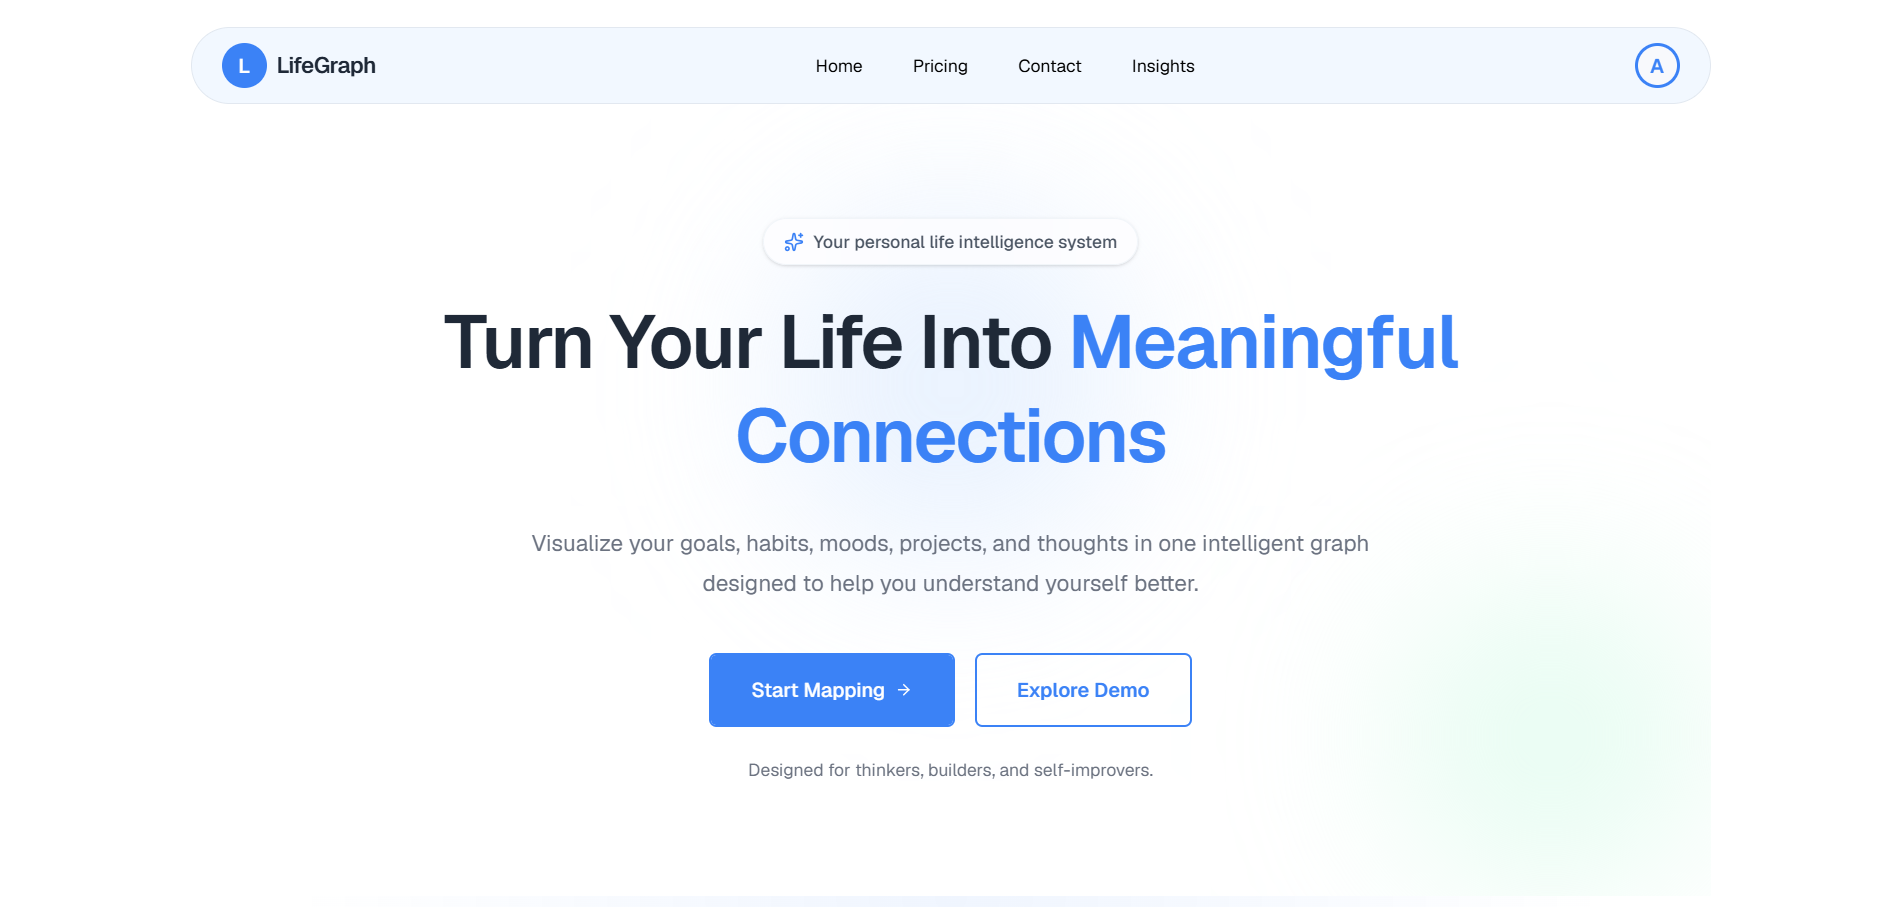
LifeGraph — A visual way to understand the connections between the different parts of your life.
-
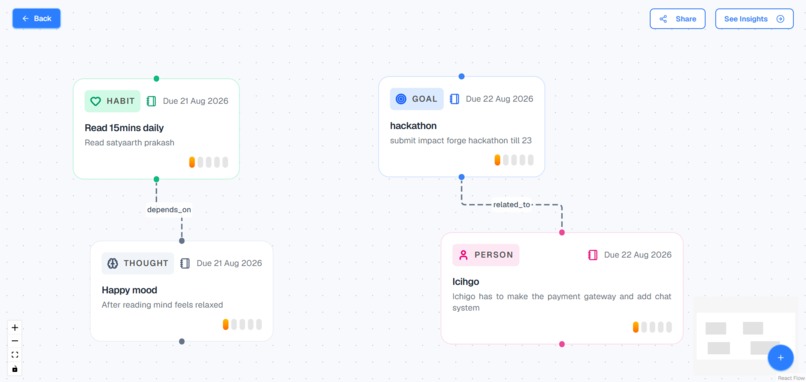
Build a personal graph by connecting habits, moods, goals, thoughts, and other parts of your life.
-
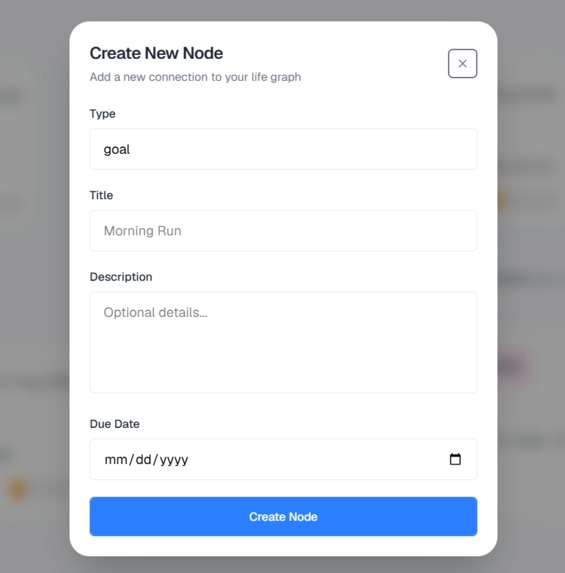
Create structured life entities with context, due dates, and priorities.
-
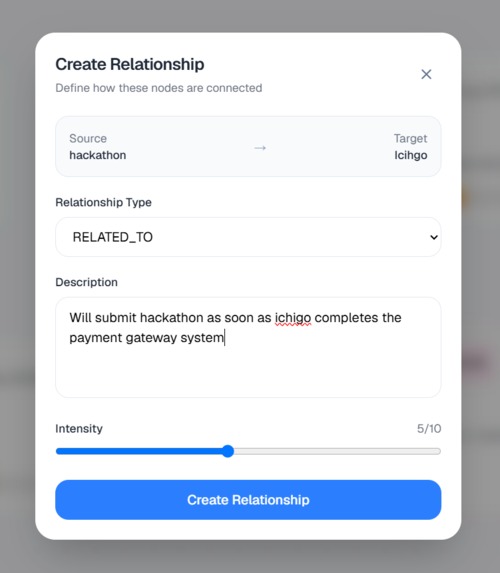
Define meaningful relationships between the things that shape your life.
-
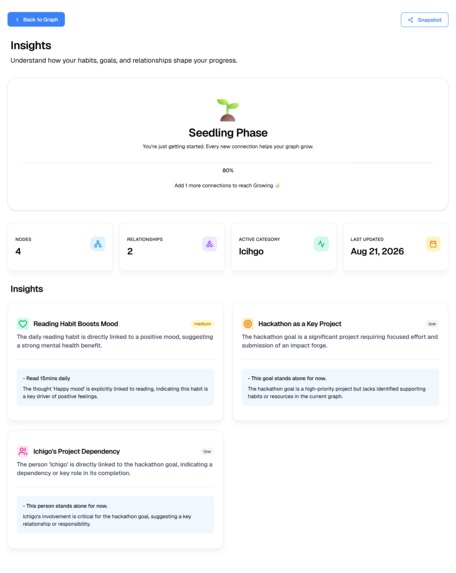
Turn connected life data into understandable insights and see the relationships behind them.
-
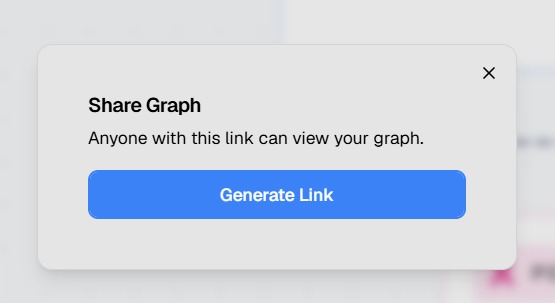
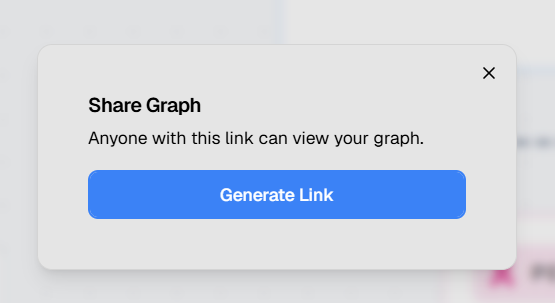
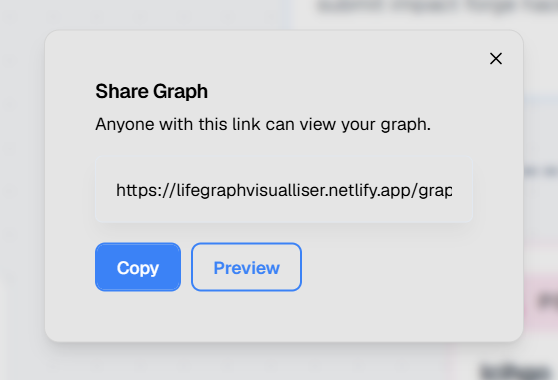
Share your LifeGraph through a simple link, making your connected life data easy to present and explore.
-
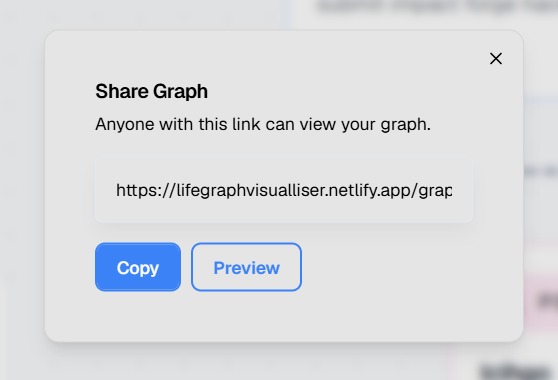
Turn your personal graph into a shareable experience with a view-only link.
Inspiration
We started with a simple observation: our lives don't happen in separate categories.
A goal can be affected by a habit.
A habit can affect our mood.
A project can change our priorities.
A person can influence a decision.
But most productivity and note-taking tools treat these things as separate lists, pages, or checkboxes.
We wanted to explore a different question:
What if we could actually see the connections between the different parts of our lives?
That idea became LifeGraph — a personal graph for representing the things that matter to us and the relationships between them.
We weren't trying to build another to-do list or another note-taking app. We wanted to build something that could eventually help people understand their own lives, not just record them.
What it does
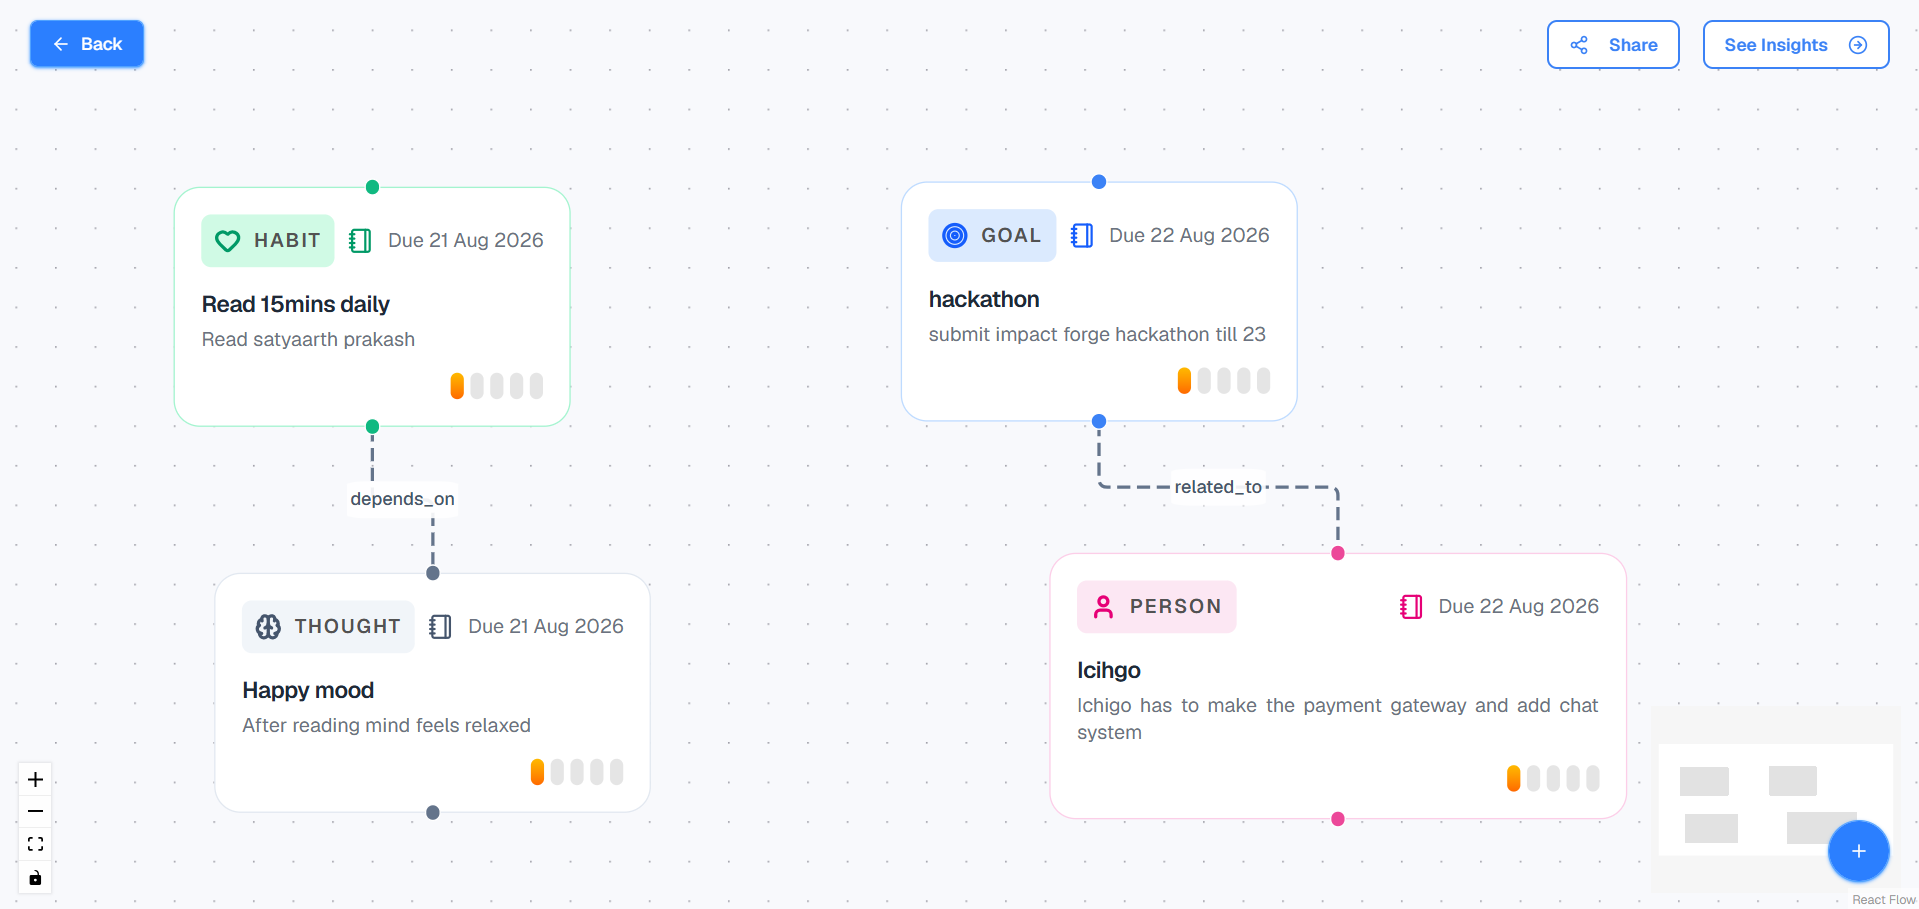
LifeGraph lets users build a visual representation of their life using different types of nodes such as goals, habits, moods, thoughts, people, projects, events, and resources.
Users can:
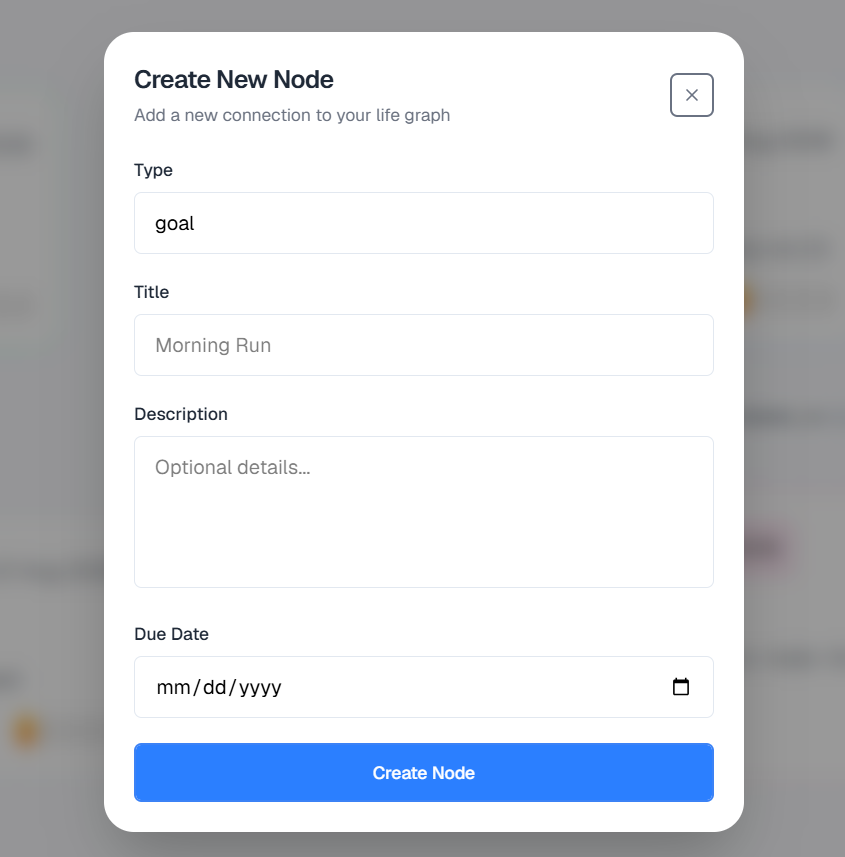
- Create structured nodes with descriptions, due dates, and priorities.
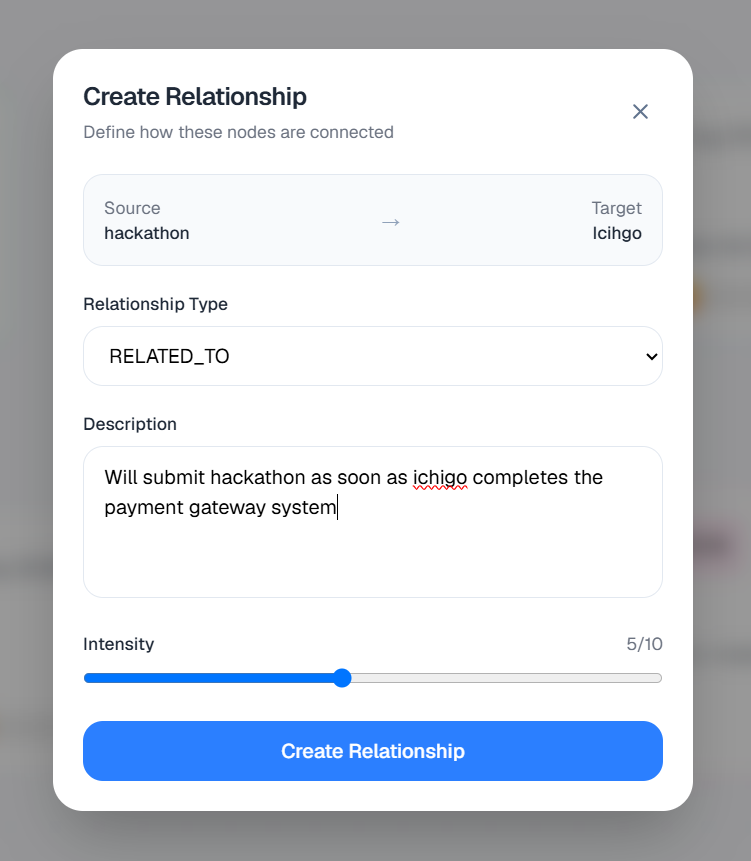
- Connect nodes using meaningful relationships such as
SUPPORTS,DEPENDS_ON,IMPROVES,CAUSES,TRIGGERS, andINFLUENCES. - Explore their information through an interactive visual graph.
- Open individual nodes to edit and manage their information.
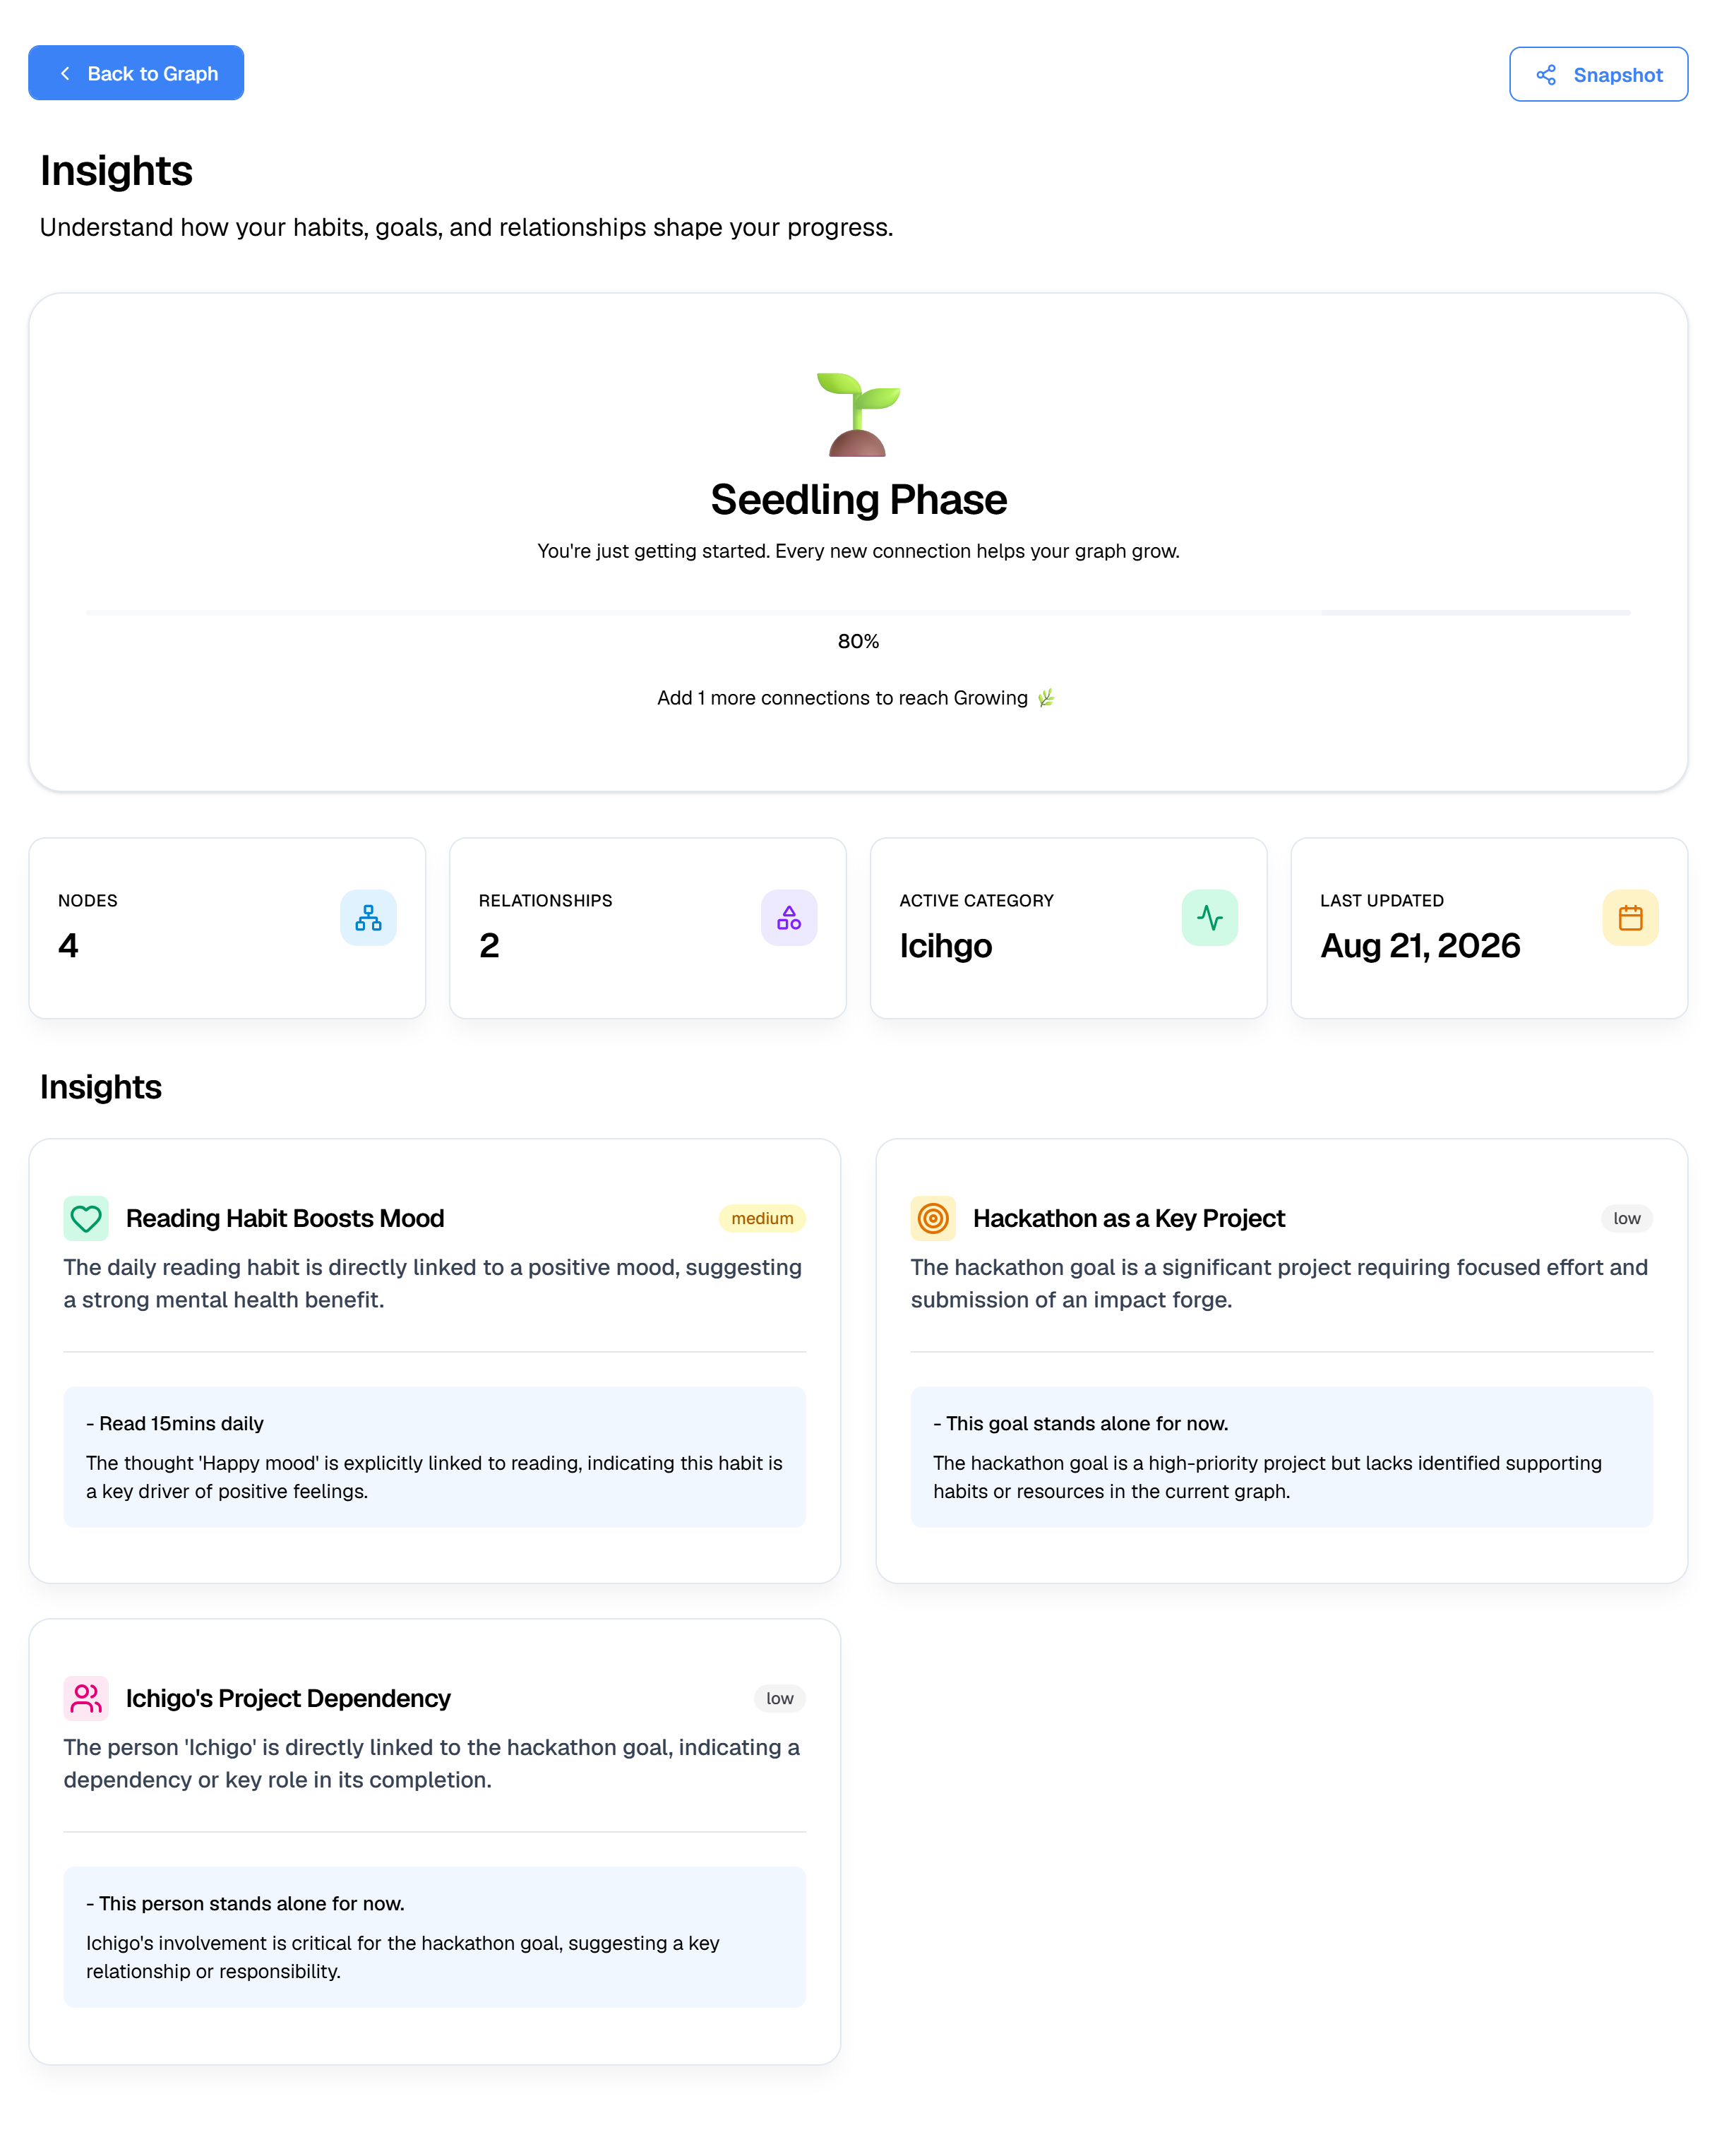
- View an Insights page that summarizes their graph and surfaces meaningful relationships.
For example, a user could connect:
Read 15 minutes daily → IMPROVES → Happy Mood
Instead of simply knowing that they read every day and feel better afterward, LifeGraph represents the relationship between those two pieces of information.
That is the foundation of what we want LifeGraph to become: a system that helps people understand the connections behind their lives.
How we built it
We designed LifeGraph around a graph-based architecture because relationships are at the heart of the product.
The frontend provides the interactive experience — from creating and editing nodes to visually exploring relationships on the graph and viewing insights.
We built the graph interface so that users can create nodes, connect them, move around the canvas, zoom into different areas, and inspect individual entities without losing the context of the overall graph.
On the backend, we structured the data around entities and relationships rather than treating everything as isolated records. This makes it possible to reason about connections between different parts of a user's graph.
We also built the Insights experience on top of those relationships so that the application can turn the raw graph structure into something more understandable for the user.
Our focus throughout development was to keep the experience simple for the user while allowing the underlying data model to represent much richer relationships.
Challenges we ran into
The hardest part wasn't creating a graph.
It was figuring out what the graph should actually mean.
There is a big difference between allowing users to draw lines between nodes and creating relationships that are actually useful.
We had to think carefully about:
- What types of nodes should exist?
- Which relationships make sense between them?
- How should relationships be represented visually?
- How do we keep a graph understandable as it grows?
- How do we turn relationships into useful insights rather than just displaying data?
- How do we make a technically complex system feel simple to someone using it for the first time?
We also had to deal with the usual challenges of building an interactive application — keeping graph state synchronized with the rest of the application, handling node and relationship updates, designing intuitive modals and panels, and making sure the Insights page actually reflects the underlying graph.
The biggest lesson was that building the technology is only half the problem. Designing the right mental model for the user is just as important.
Accomplishments that we're proud of
We're proud that we turned the initial idea of a "personal life graph" into a working product rather than just a concept.
Today, a user can start with an empty graph, create different types of life entities, connect them with meaningful relationships, edit those entities, and explore the resulting graph visually.
We are especially proud of the transition from:
individual pieces of information → relationships → insights
because that represents the core idea behind LifeGraph.
We also built the product around a foundation that can grow. The current version is intentionally simple, but the underlying concept allows us to eventually build much more intelligent experiences on top of the user's graph.
What we learned
One of the biggest things we learned is that people don't naturally think about their lives as databases.
They think in stories and connections.
"I started exercising, and I started sleeping better."
"I started reading, and I felt less stressed."
"This project depends on this skill."
"This person helped me make this decision."
These are relationships.
Building LifeGraph made us realize that capturing those relationships may be more valuable than simply capturing the individual pieces of information.
We also learned that a good product isn't necessarily the one with the most features. It is the one that makes a complicated idea feel simple.
That became an important principle for us:
The graph can be complex underneath. The experience should not be.
What's next for LifeGraph
The current version is the foundation. Our next goal is to make LifeGraph much more intelligent without turning it into another complicated productivity tool.
Some of the features we plan to build include:
- AI-powered natural language capture — users could describe something that happened in their life normally, and LifeGraph could turn it into structured nodes and relationships.
- Ask LifeGraph — users could ask questions about their own graph in natural language.
- AI relationship discovery — identify potential connections that users may not have manually added.
- Evidence-backed insights — generate insights while showing the graph connections that support them.
- Goal intelligence — identify habits that support goals and potential blockers.
- Life experiments — help users test whether a habit appears to influence an outcome.
- Weekly life reviews — summarize meaningful changes, patterns, and progress.
- Focus Mode — allow users to zoom into one goal, project, habit, or person and explore everything connected to it.
Our long-term vision is simple:
LifeGraph should become a personal intelligence layer — something that doesn't just remember what happened in your life, but helps you understand why the pieces might be connected.
We don't want LifeGraph to tell people how to live.
We want to give them a better way to see their own lives.
Built With
- flow
- framer
- golang
- neo4j
- netlify
- next.js
- postgresql
- railway
- react
- shadcn
- tailwind
- zustand

Log in or sign up for Devpost to join the conversation.