-
-
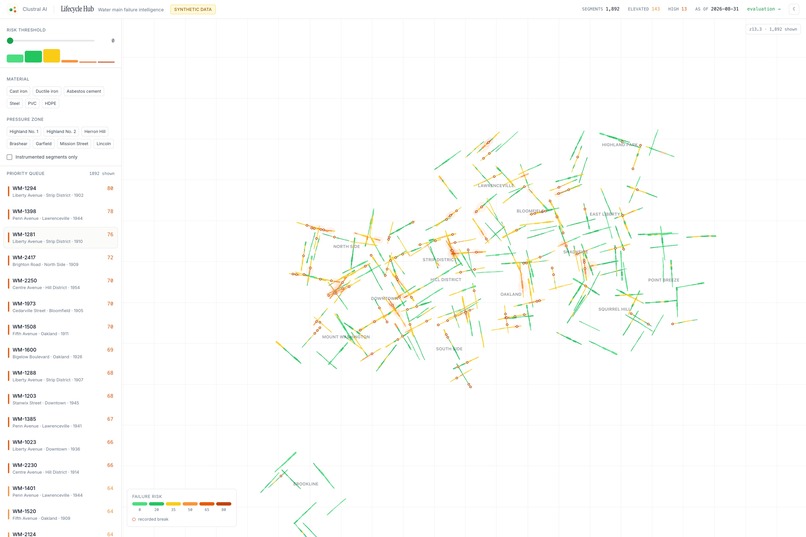
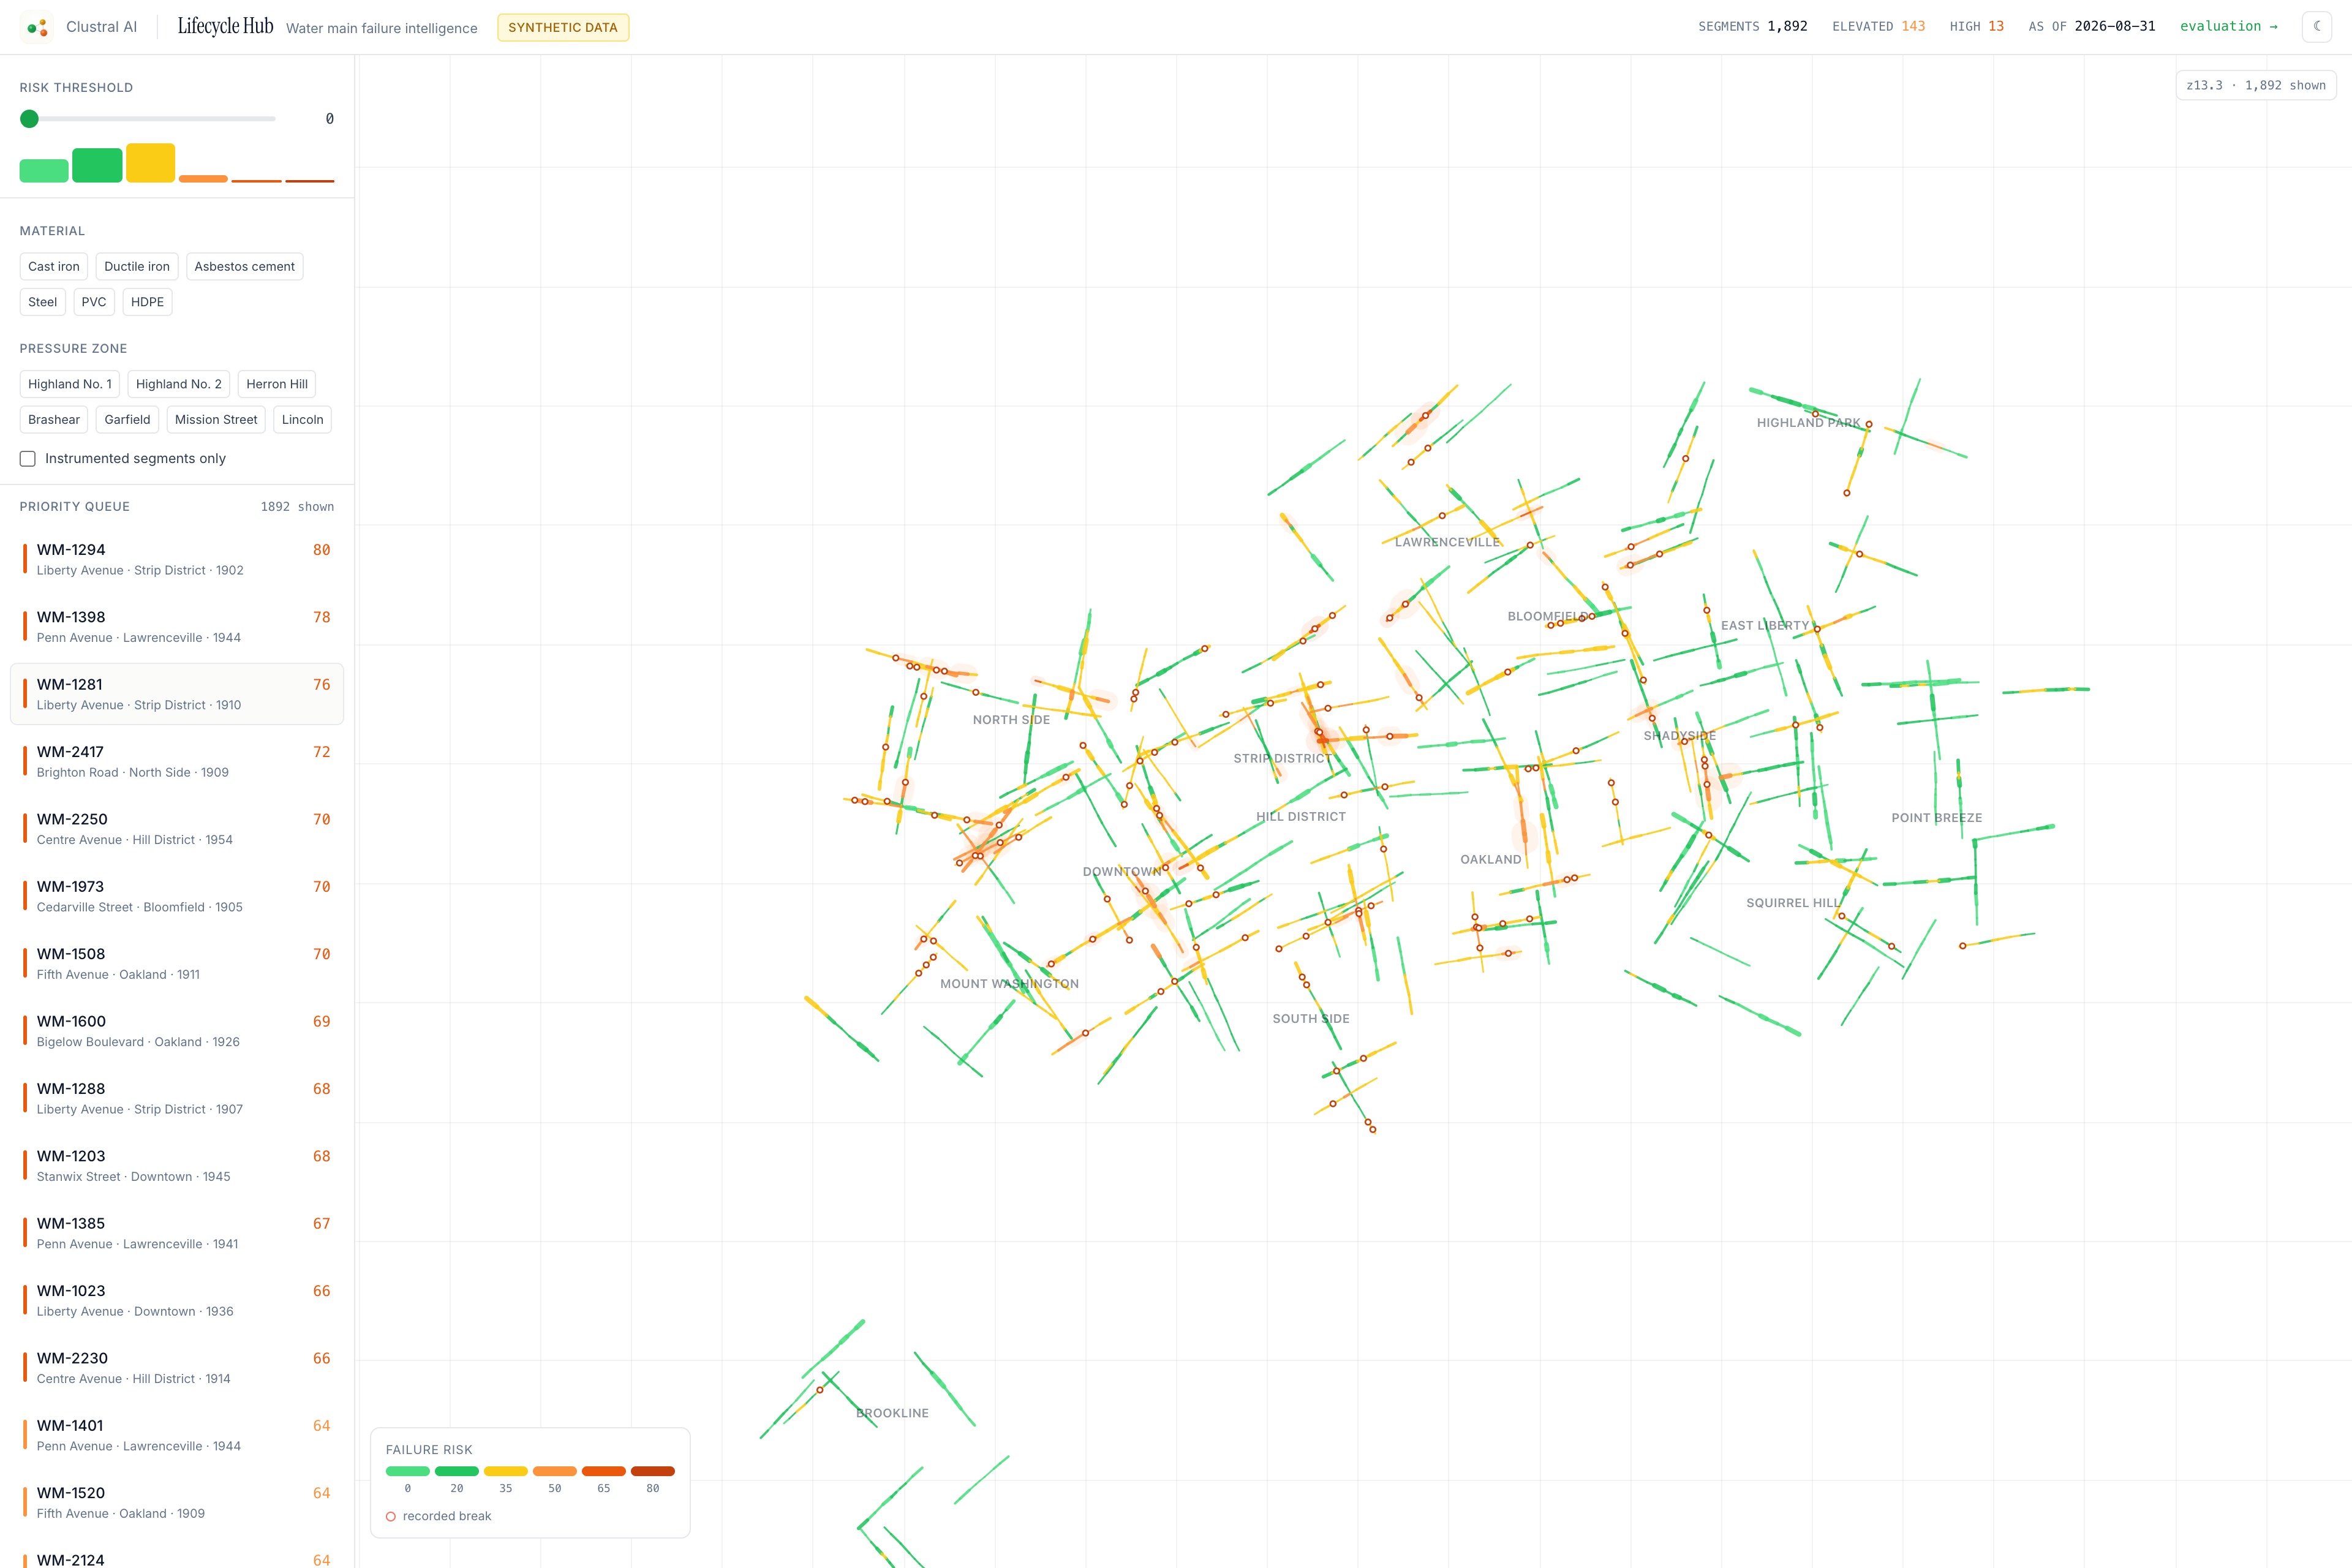
1,892 segments across Pittsburgh, scored and ranked. 143 elevated, 13 high.
-
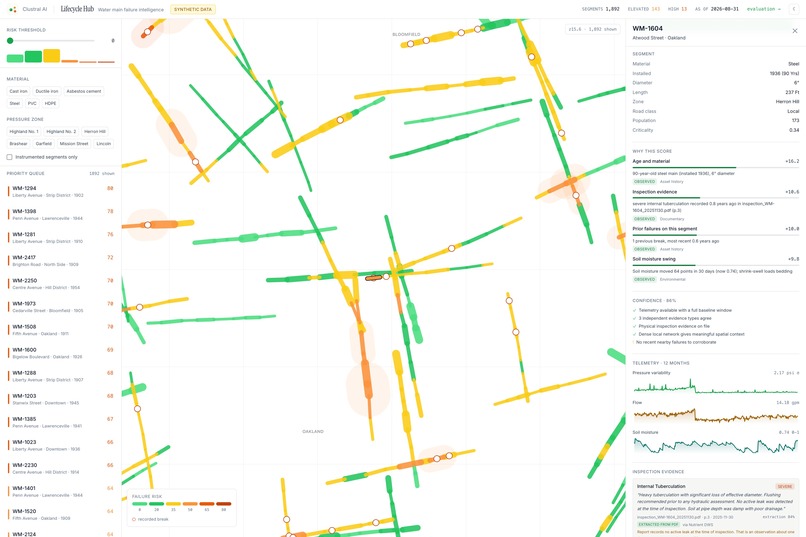
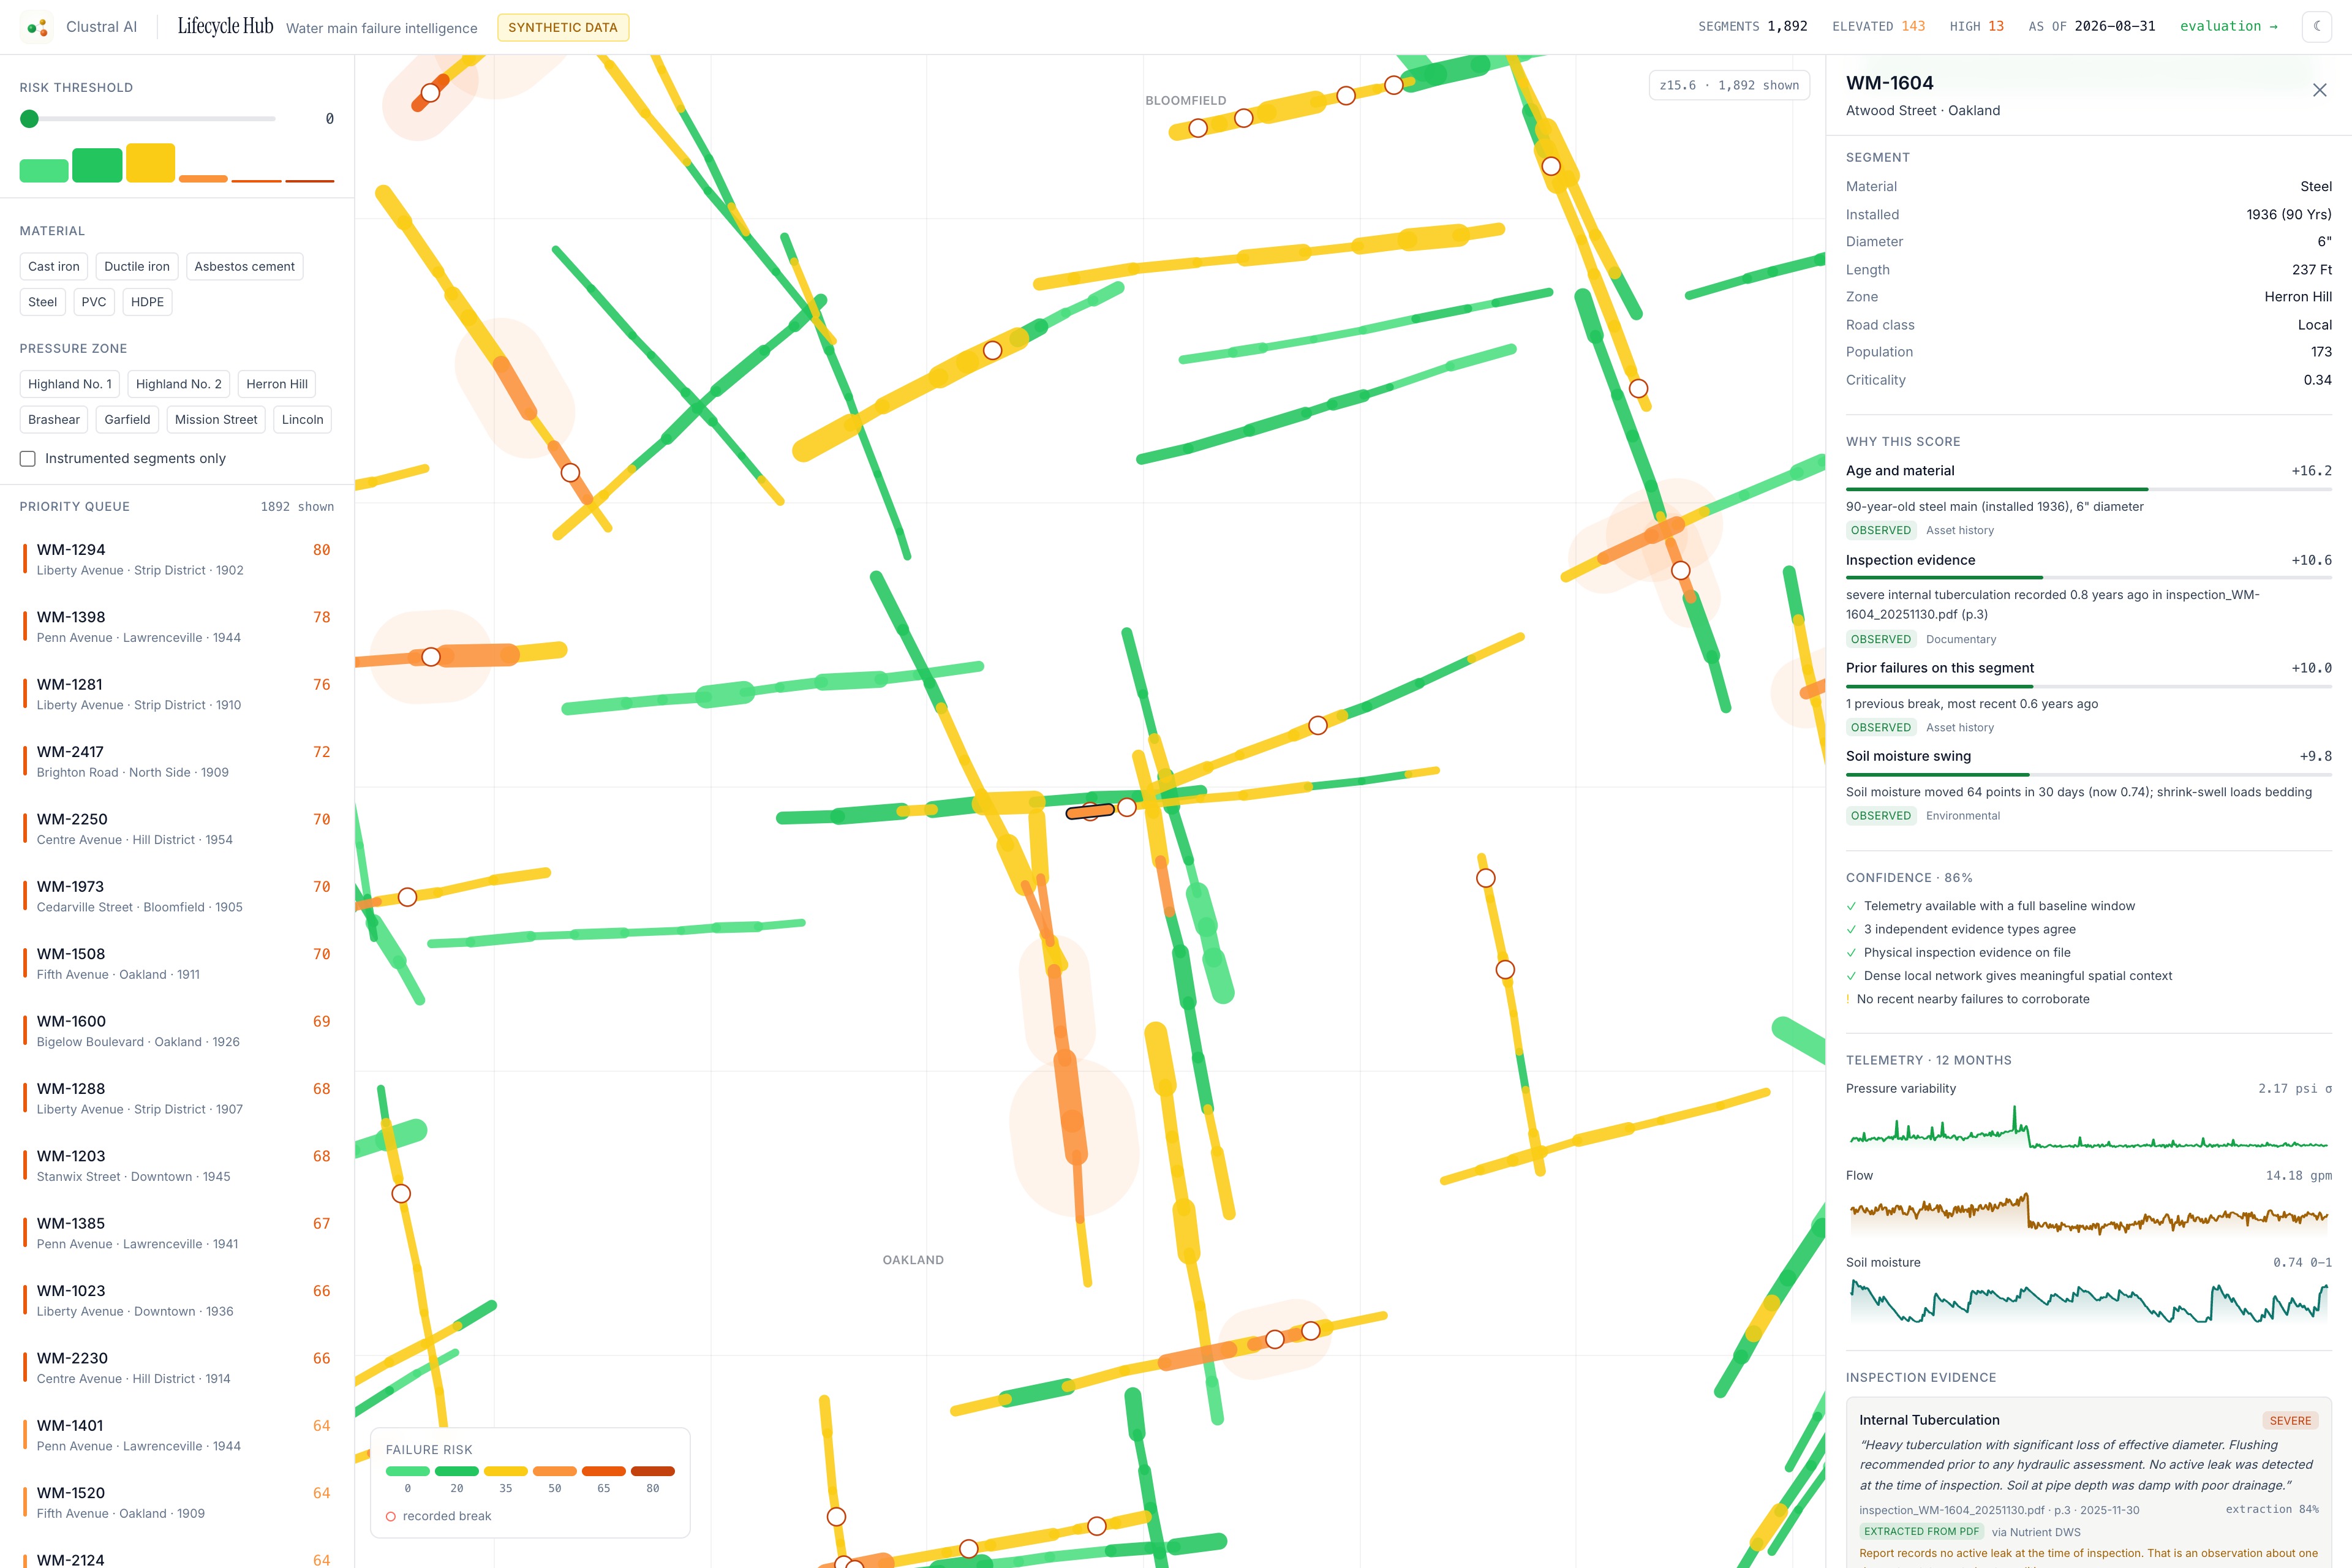
Every point of the score attributed to a named factor, tagged with its provenance. No black-box number
-
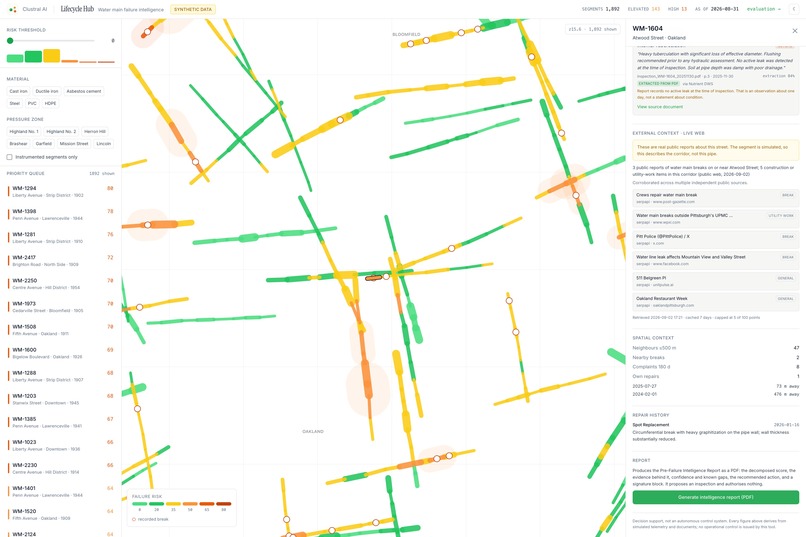
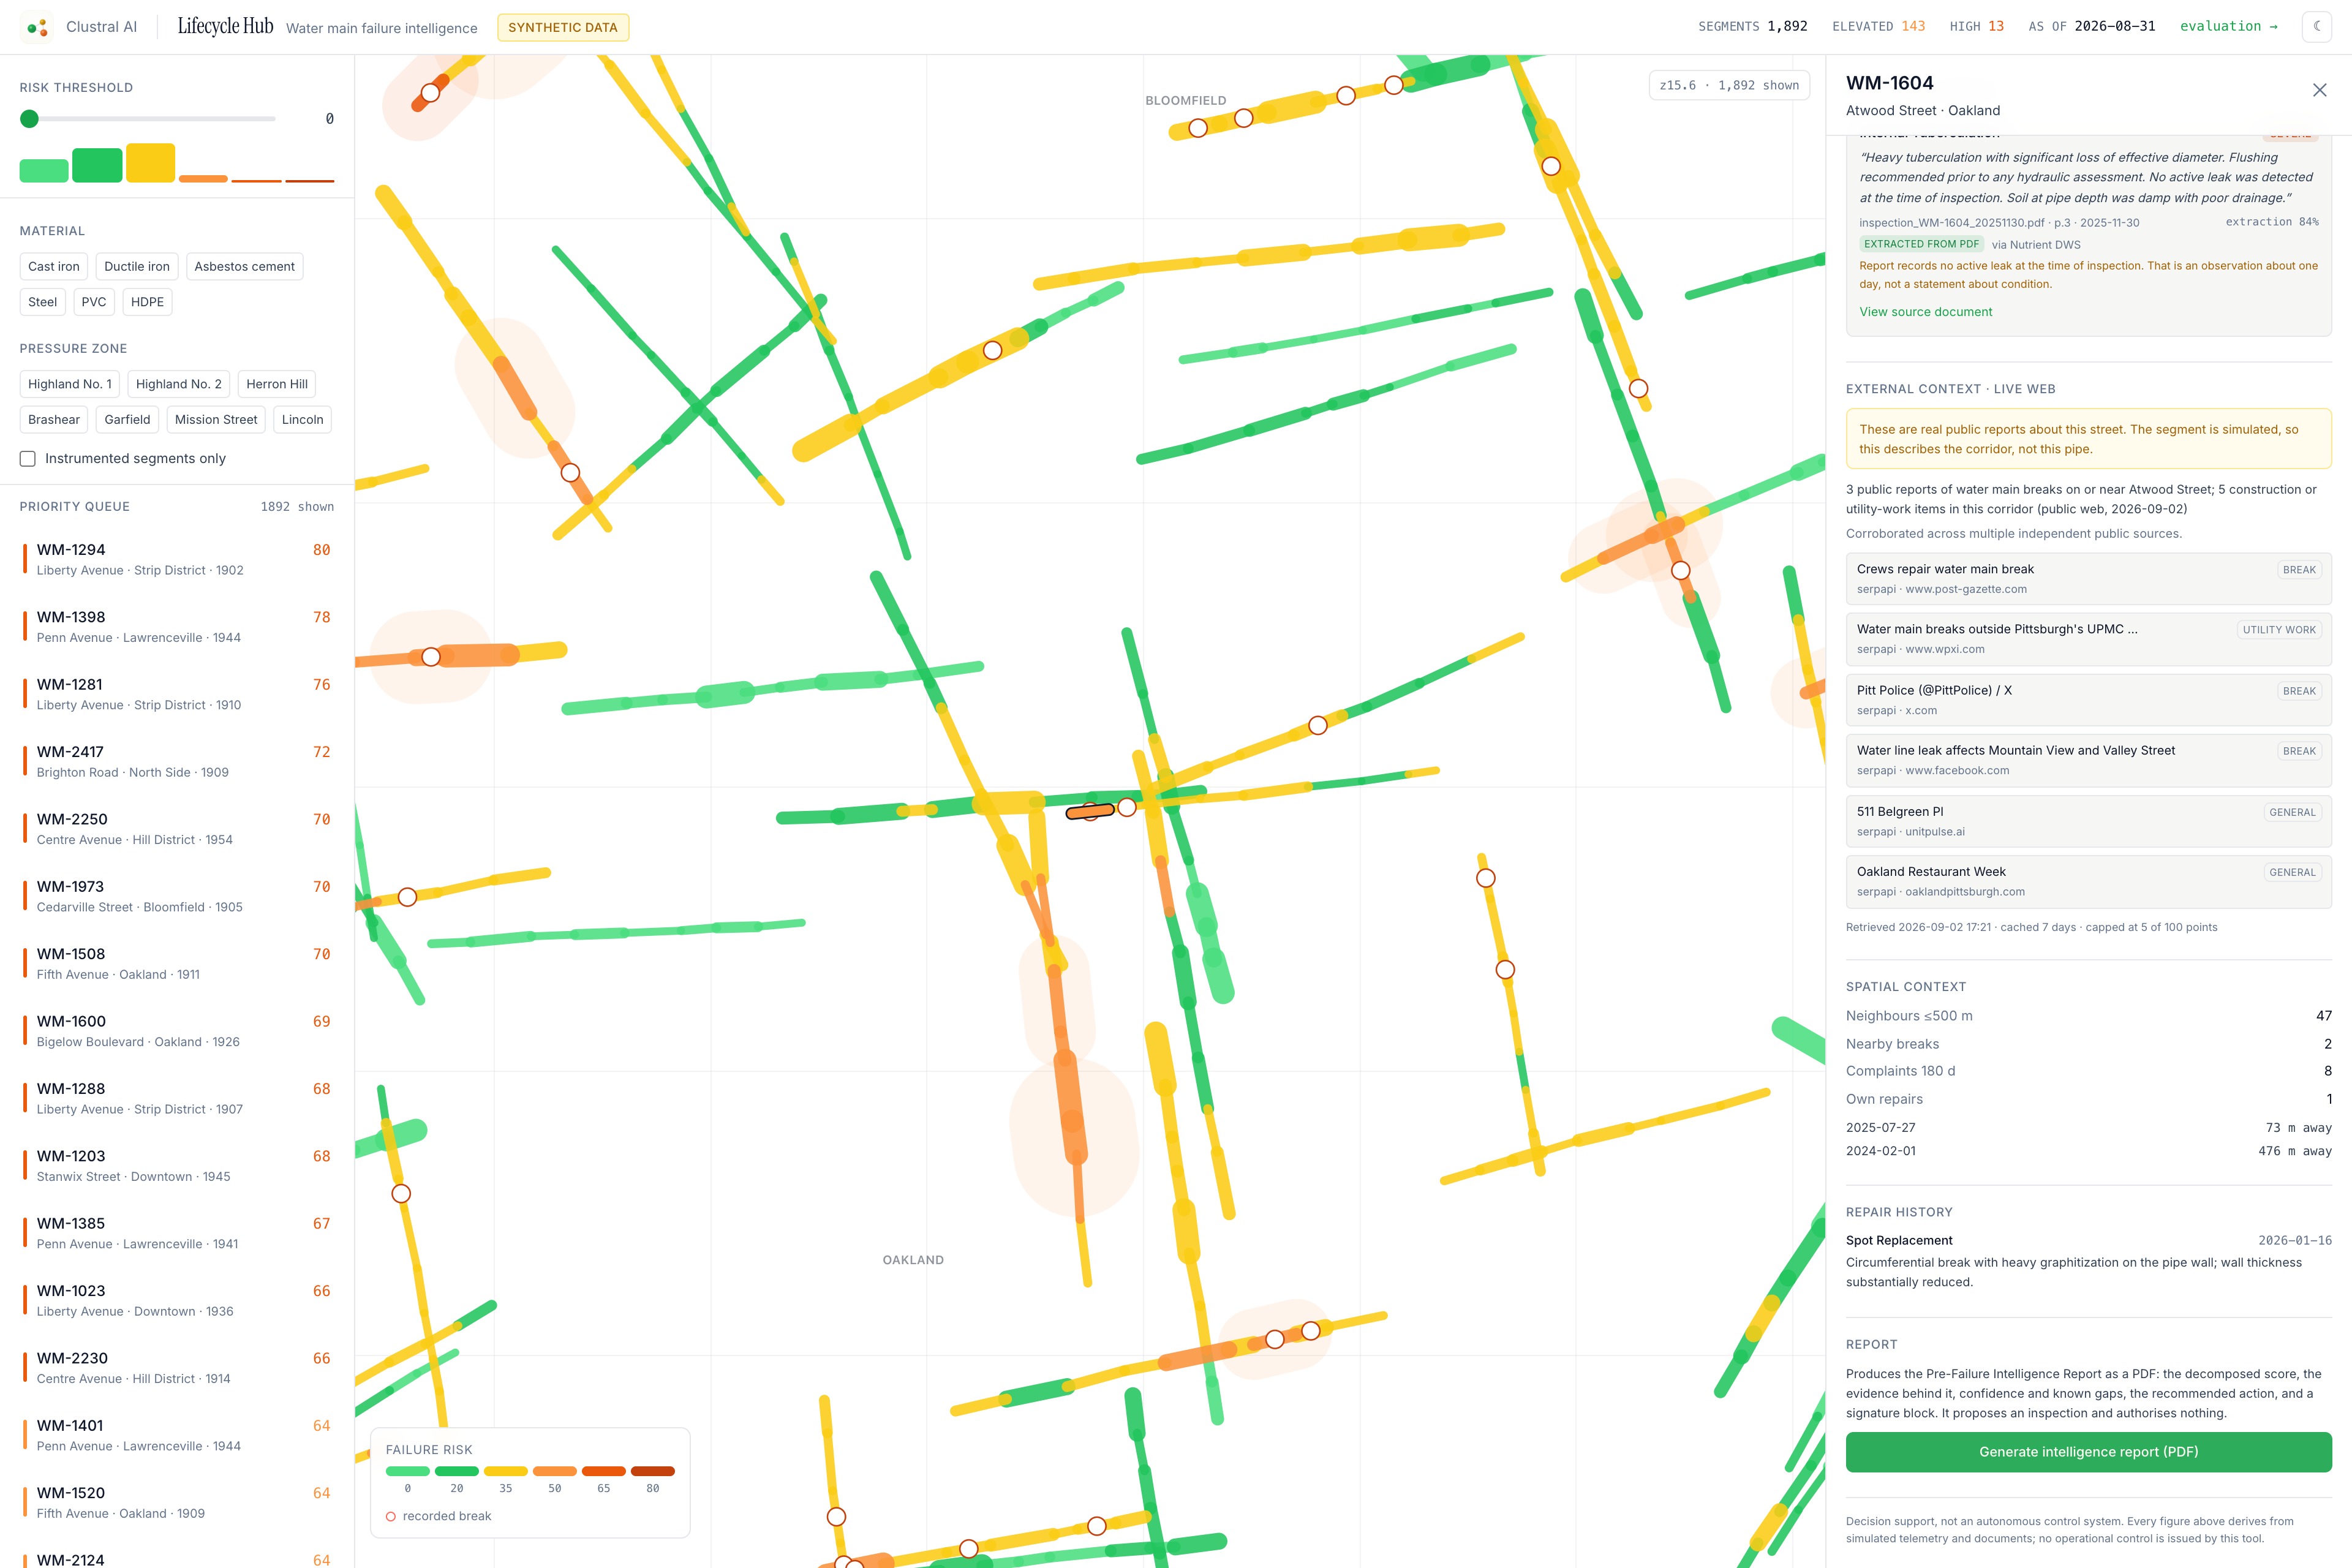
Inspection findings extracted from the PDF by Nutrient DWS, plus live web context from SerpApi.
-
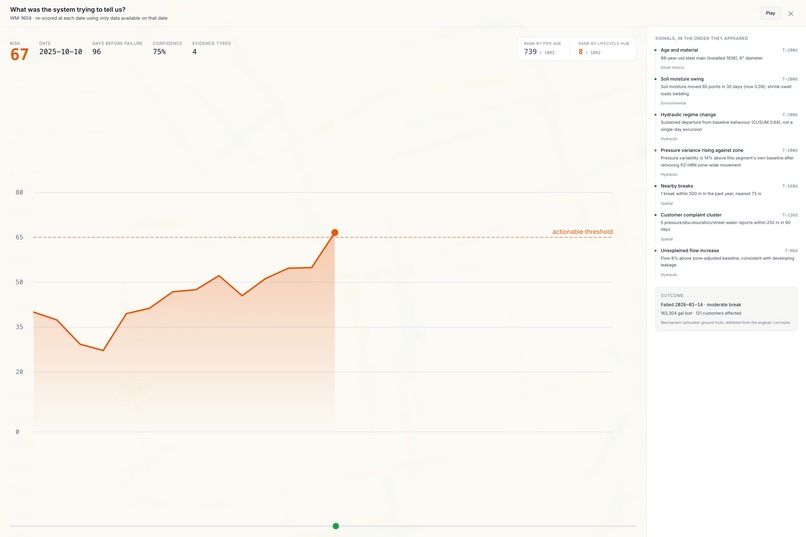
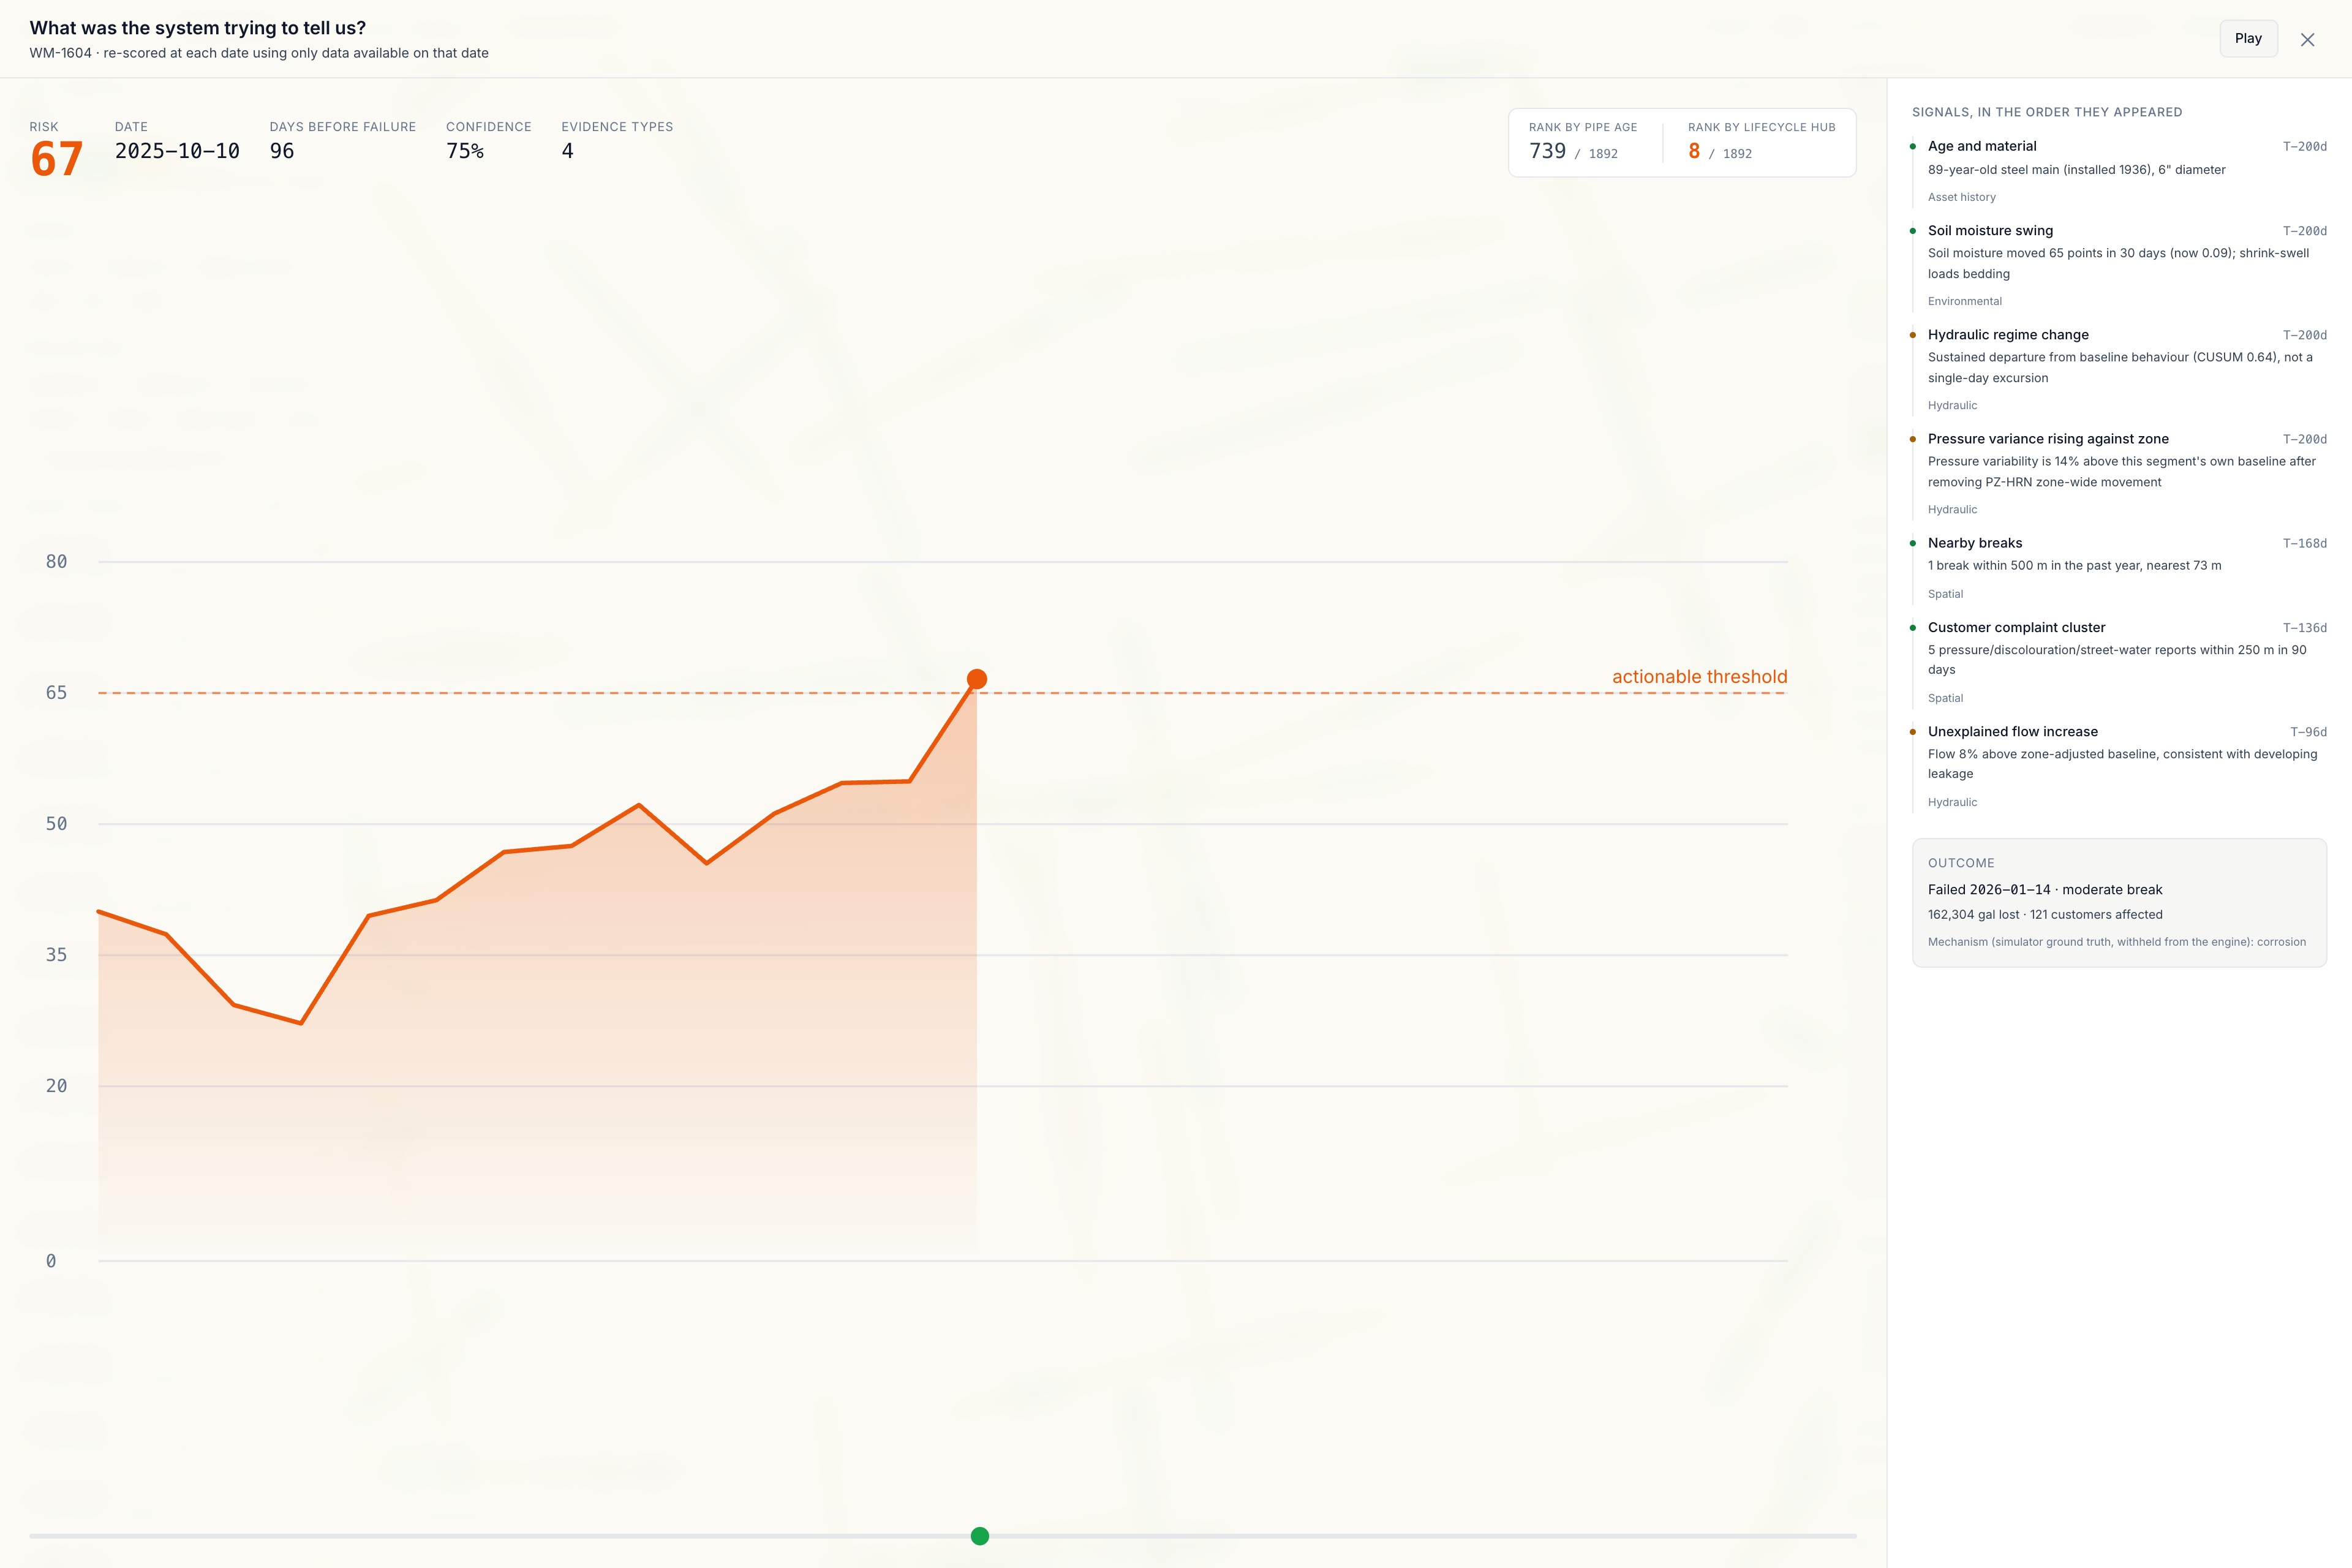
96 days before it broke: pipe age ranked it 739th of 1,892. Lifecycle Hub ranked it 8th.
-
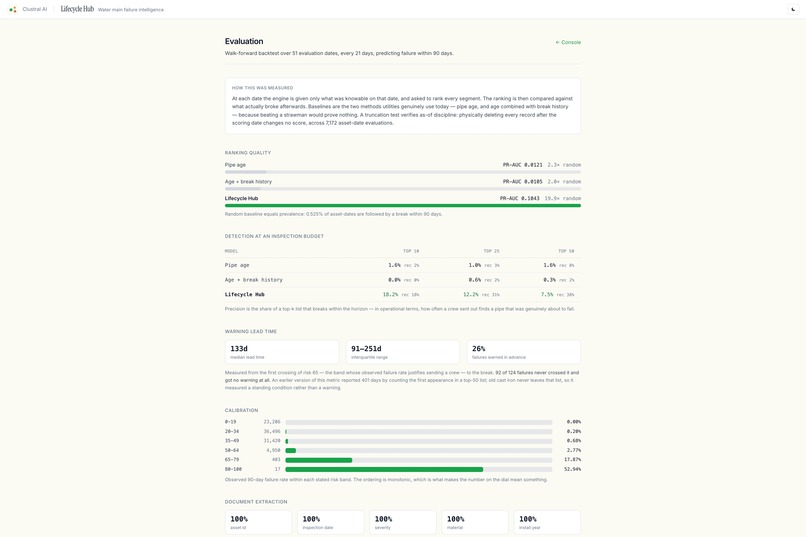
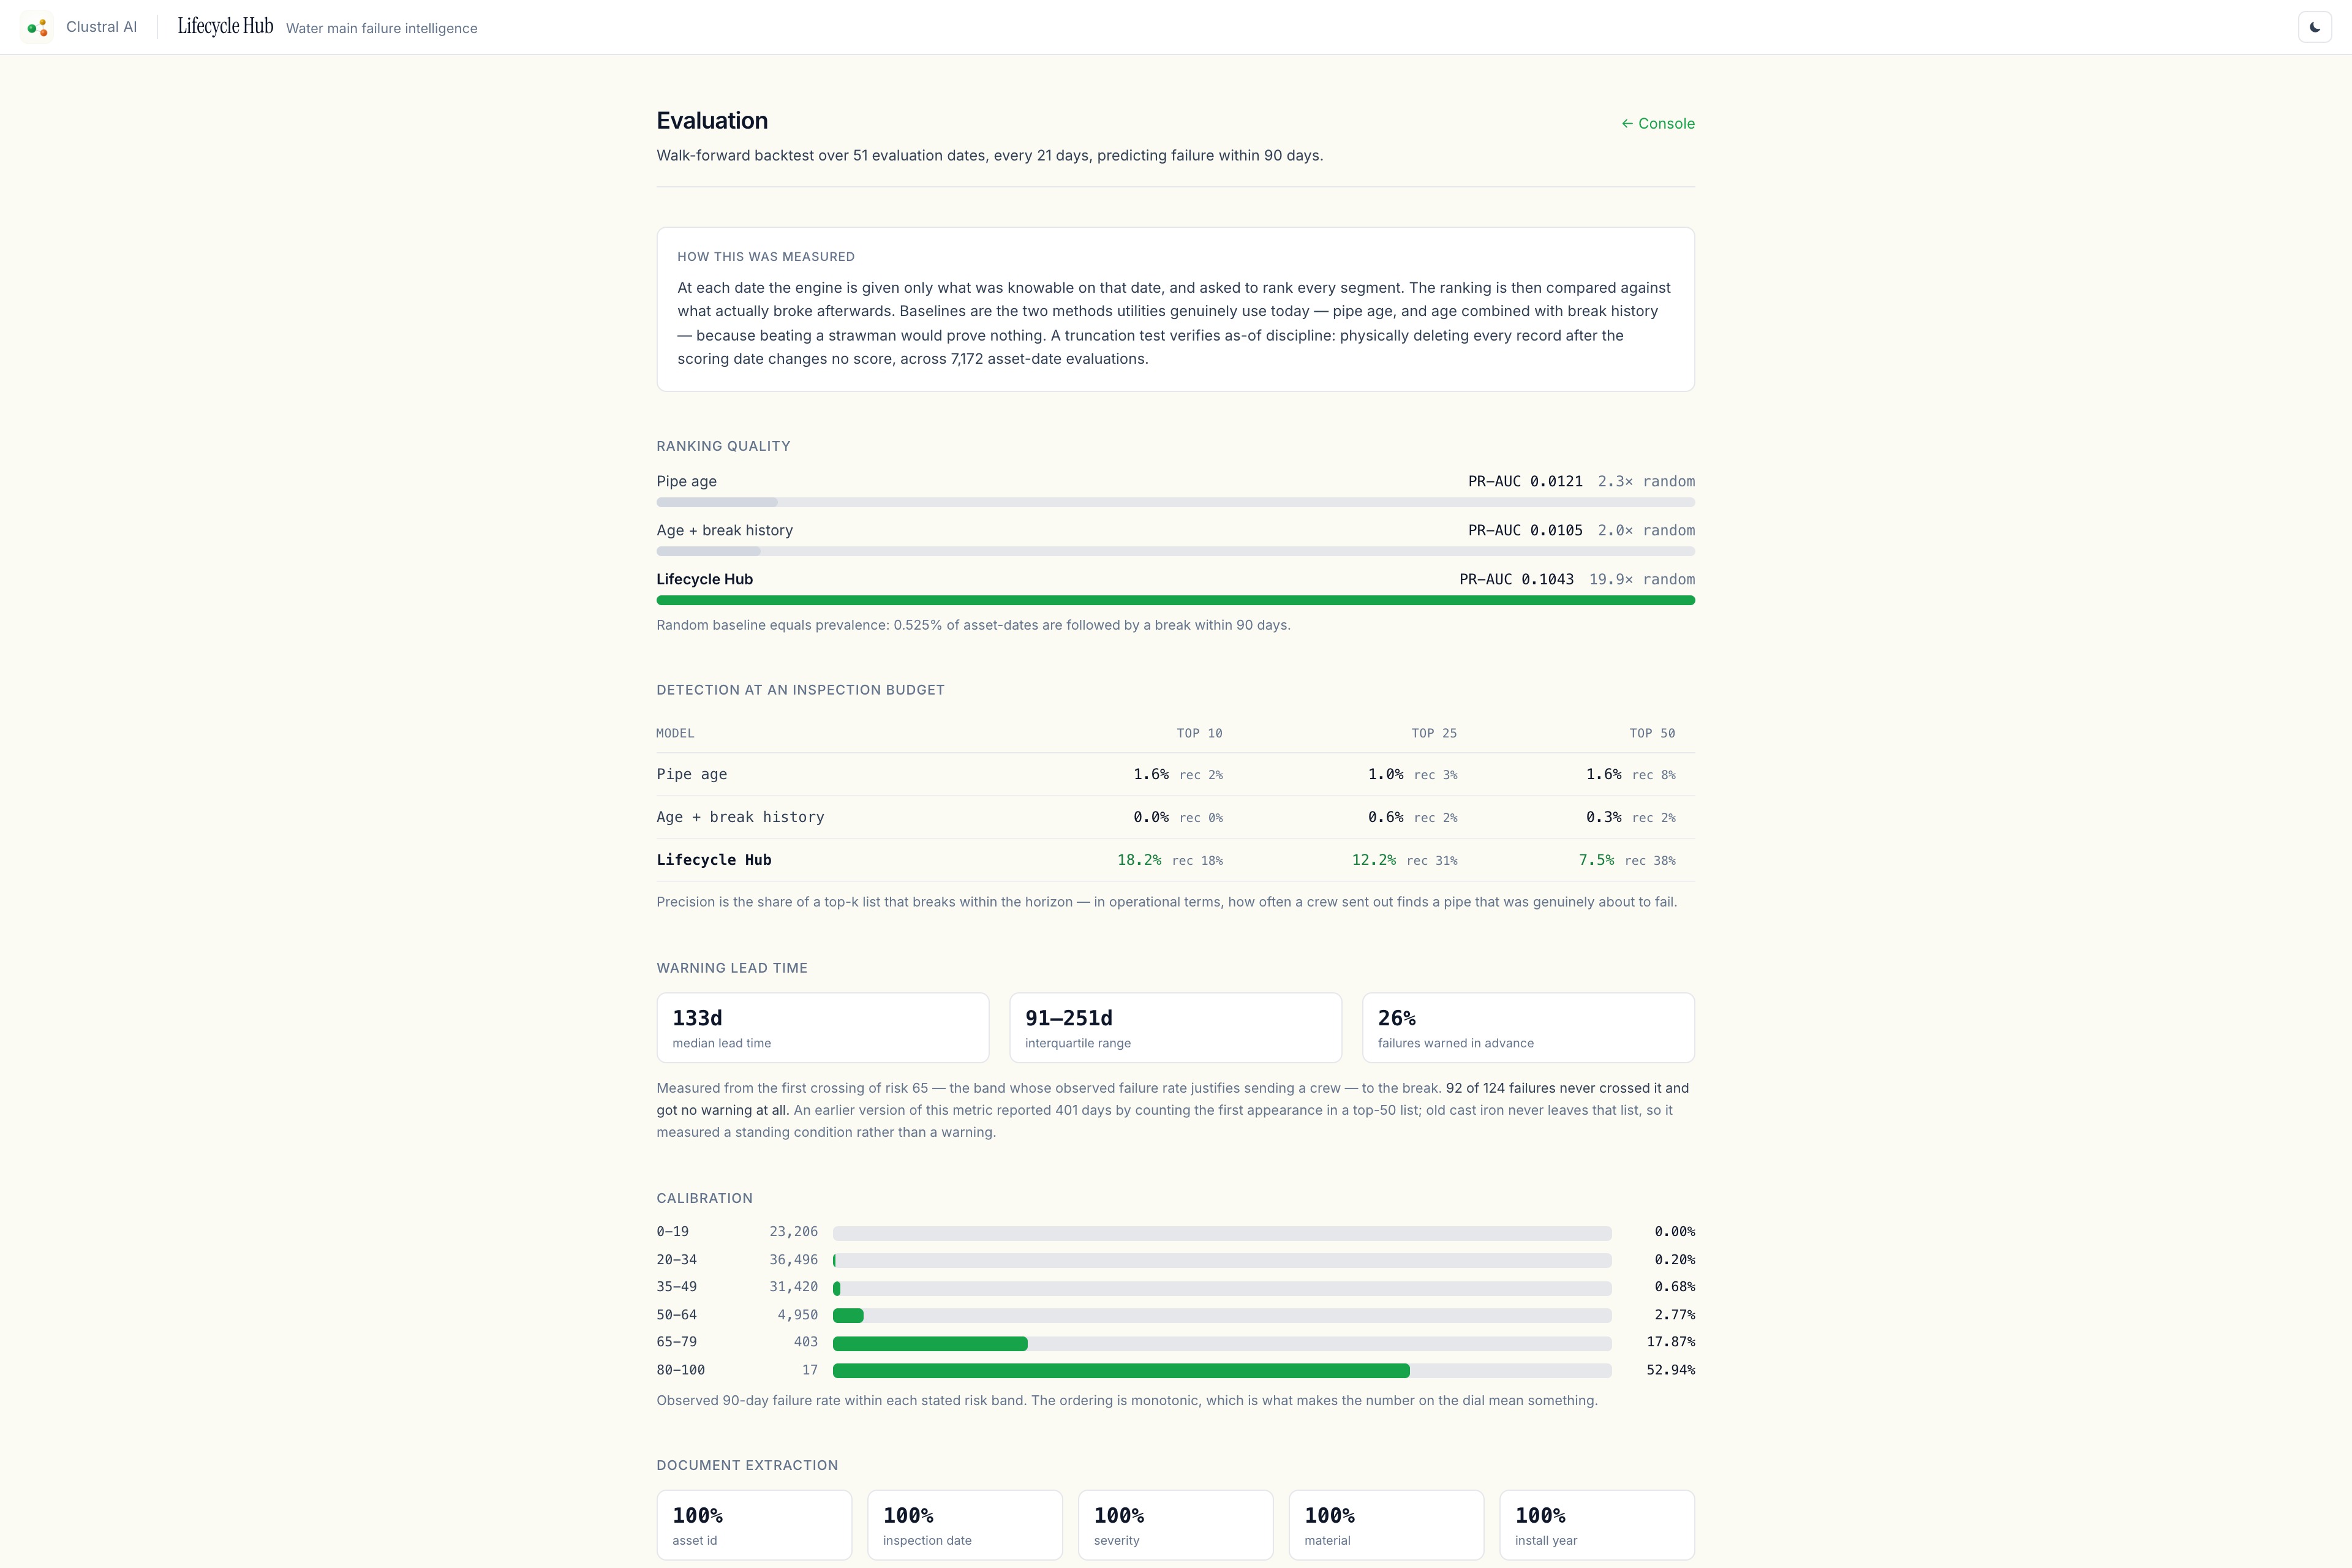
Walk-forward backtest: 19.9× better ranking than chance vs 2.3× for pipe age — and 92/124 failures it never caught, stated on the same page.
Lifecycle Hub
Inspiration
Water infrastructure doesn't usually fail without warning — the warning is just scattered. A pipe's pressure sensor knows one thing, a weather station knows another, a complaint log knows a third, and an inspection report sits in a PDF nobody reopens after it's filed. Utilities still prioritize mostly by pipe age, which misses the actual failure story: age predicts risk, it doesn't determine it. We wanted to know whether reconstructing that scattered evidence — as-of any given day, with nothing borrowed from the future — could catch a failure that age-based triage would walk right past.
What it does
Lifecycle Hub scores every segment of a water distribution network on failure risk, and shows exactly why: age and material, hydraulic behavior relative to its own pressure zone, nearby breaks and complaints, environmental stress, and findings extracted from real inspection PDFs. Every point of the score is attributed to a named factor with a stated confidence — nothing is a black-box number.
The signature feature is failure reconstruction: pick a pipe that broke, and watch the engine re-score it day by day, using only data that existed on that day. On segment WM-1604 — a 6" steel main serving 173 people — pipe-age ranking placed it 739th of 1,892 segments right up until the day it failed. Lifecycle Hub crossed the actionable threshold 96 days before the break, ranking it 8th.
Backtested across four years of walk-forward evaluation: 19.9× better ranking than chance, versus 2.3× for pipe age alone. Median warning lead time of 133 days. It also states its limits plainly — it warns on only 32 of 124 failures in advance, and says so on the same page as the wins.
How we built it
- Synthetic network, deliberately: 1,892 segments over real Pittsburgh streets, so live web search returns genuine municipal context. Physics-based degradation model with a latent condition the risk engine never sees — telemetry is only a noisy, partial observation of it — validated against 19 independent NOAA/AWWA benchmarks (break rate, seasonality, precursor detectability).
- Nutrient DWS renders inspection reports to real PDFs and extracts them back — 100% field accuracy across asset ID, date, severity, material, and install year on 14 real documents.
- SerpApi + Querit pull live external context — real reported breaks and construction on the actual street, clearly labeled as real reporting about a simulated pipe, never blurred together.
- Xano as the operator-facing system of record — scored snapshots, decomposed evidence, recommendations, and an append-only audit trail.
- Azure — App Service for the app, Data Explorer and Digital Twins provisioned for the analytics layer, Azure OpenAI for narrative synthesis.
- A walk-forward backtest with a leakage test: the same scoring run against a physically truncated dataset produces byte-identical output across 7,172 asset-date evaluations, proving no feature ever reads a future day.
Challenges we ran into
The first version of the physics model produced no detectable precursor at all — pre-failure pressure variance was statistically indistinguishable from a random control. The fix was making degradation a genuine runaway process rather than linear decay, which is also physically true: corrosion pitting concentrates stress, which grows the defect faster. Getting a demo video's narration to match the screen exactly was its own discipline — one script line claimed a rank comparison that didn't exist in the UI yet, so we built it into the product rather than softening the line.
What's next
A pilot with real utility telemetry and CMMS integration; extending the failure-archetype model beyond the five mechanisms currently simulated; wiring Digital Twins into the network graph for propagation reasoning across connected infrastructure.
Built With
- azure-app-service
- azure-data-explorer
- azure-digital-twins
- azure-openai
- maplibre-gl
- nextjs
- node.js
- nutrient-dws
- querit
- react
- serpapi
- tailwindcss
- typescript
- xano

Log in or sign up for Devpost to join the conversation.