-
-

Home Page
-

Page 2
-

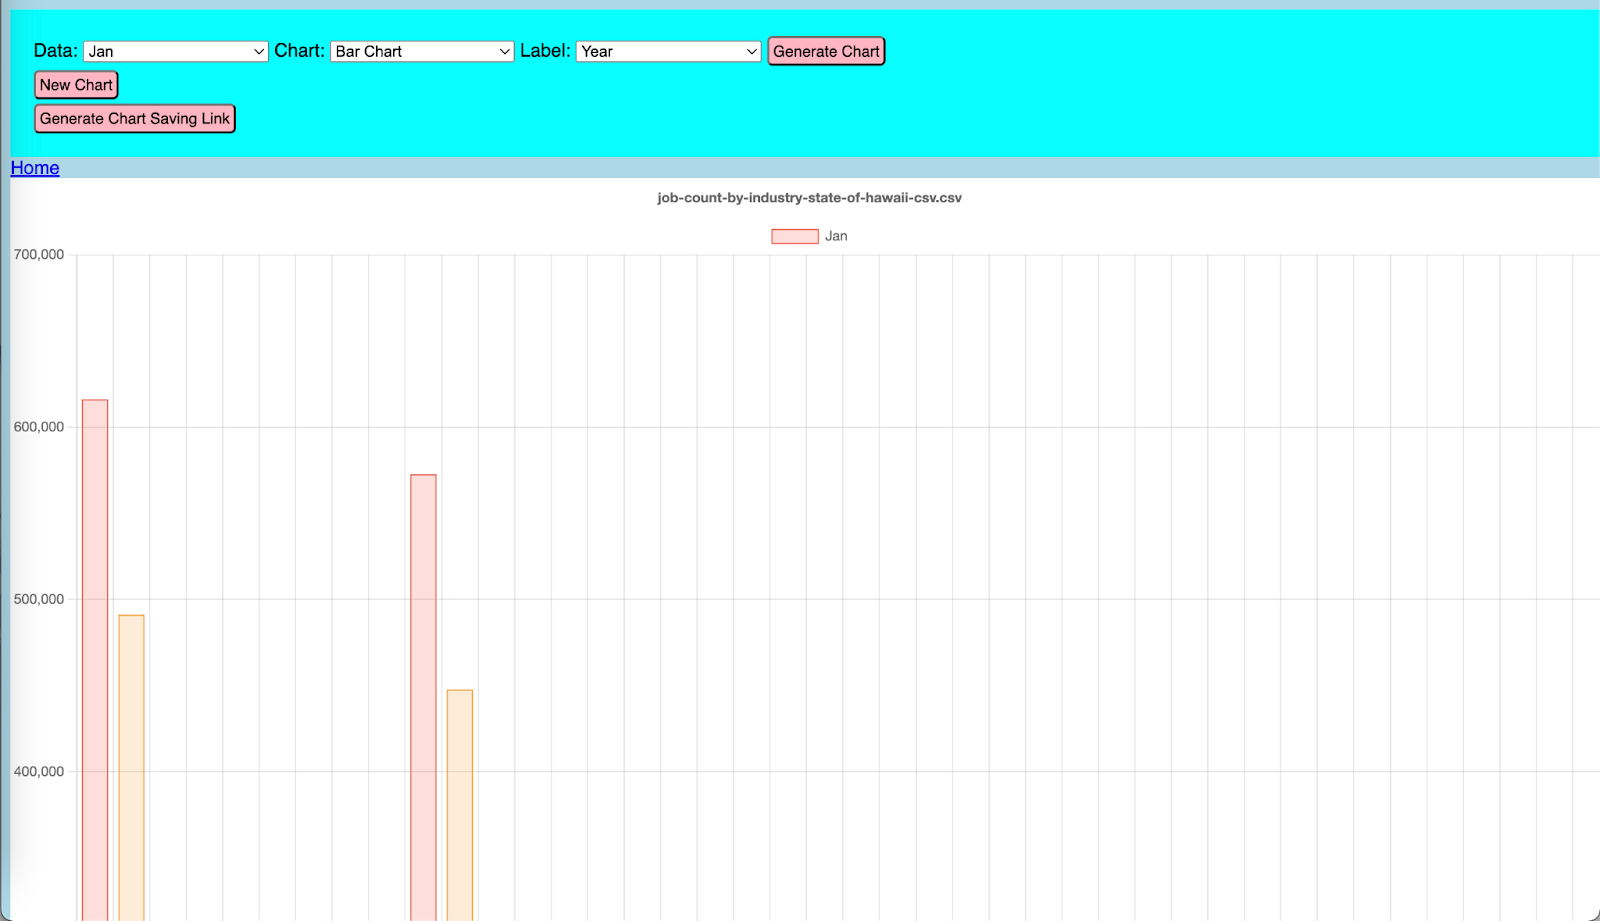
Page 2 with Chart
-

Bar Chart
-

Line Chart
-

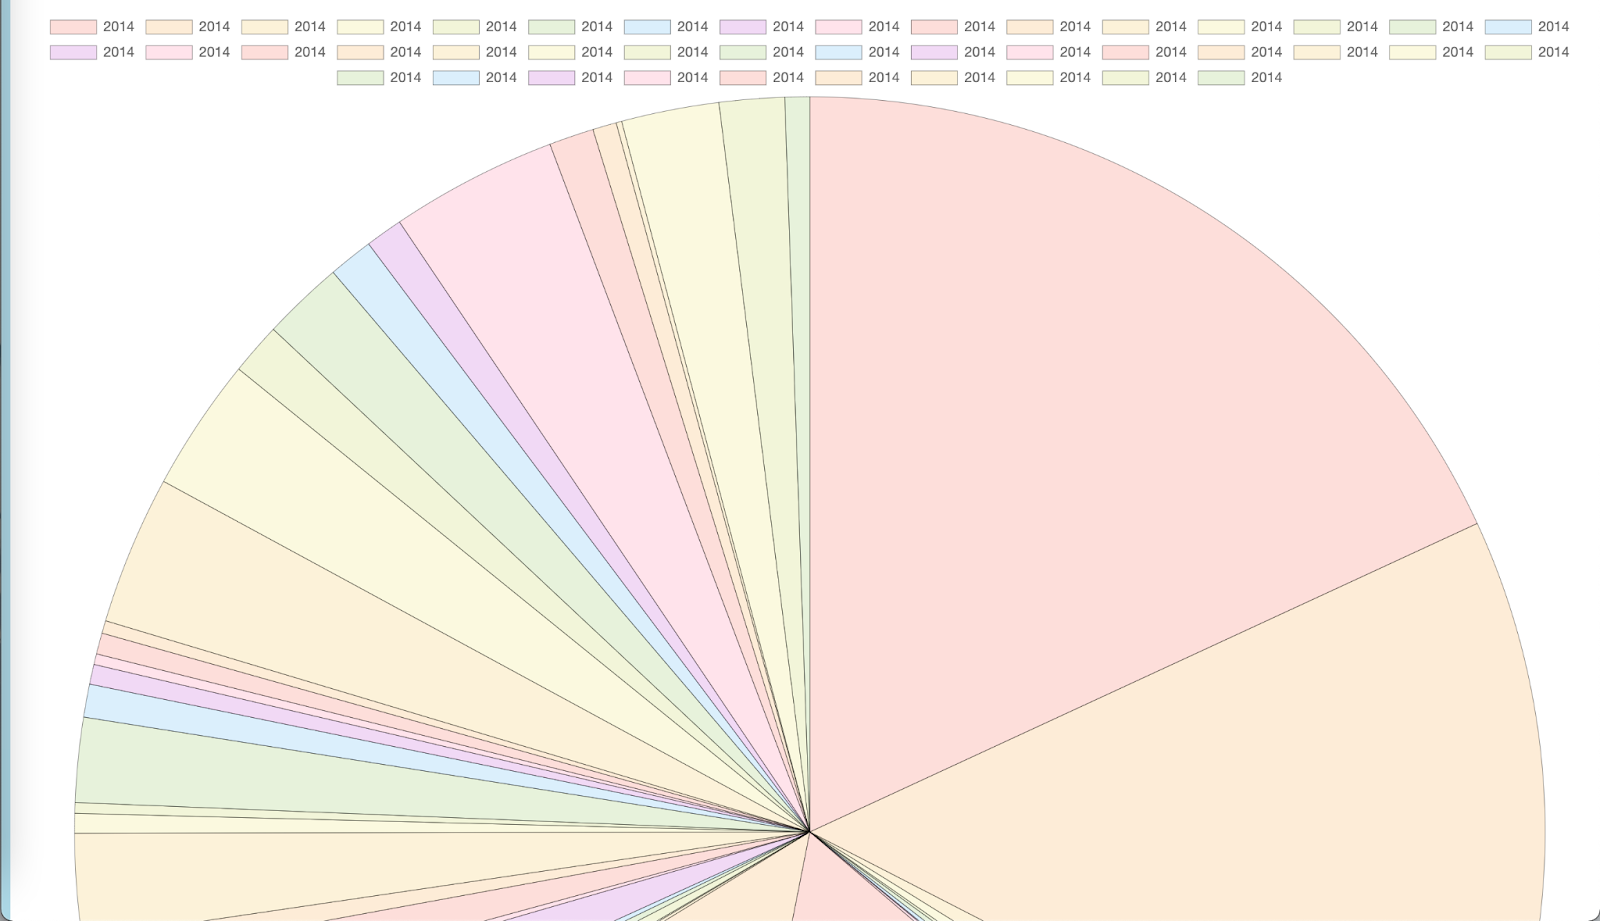
Pie Chart
-

Radar Chart
-

Polar Area Chart


Inspiration
The inspiration for doing this project and competition was that the members of our team would be able to learn and grow from this experience, not only in our coding skills but our teamwork skills as well. The challenge also seemed tough so it required us to put in a lot of time and effort. In addition, the challenge included a creative aspect and always had room for improvement in every element of the project, allowing us to continue to improve our project.
What it does
The project is a data visualization website that allows users to convert a CSV file into a visual. The user will first import a CSV file into the website and submit the file. Once submitted, the user will be able to select which data to display, the visual type, and the labels. The different visual type options provided to the user include; bar, line, pie, radar, and polar area charts.
How we built it
The project was built using Replit and Visual Studio Code, as well as the Chart.js javascript library.
Challenges we ran into
A challenge that we ran into was taking the array from the CSV file and putting it into a visual. Since the functionality for taking the CSV file and putting it into a 2D array was in javascript and the code for the visual was in an HTML file, we struggled to take the array and take parts of it to implement it into the visual.
Accomplishments that we're proud of
The biggest accomplishment that we’re proud of is being able to create the project in such a short amount of time. As high school students without extensive coding experience, being able to create a project this scale in a week is something to be proud of. Another accomplishment that we’re proud of is the visual aspect and being able to provide the user with various options for data visualization. We believe that giving the users options to suit their preferences and needs is a valuable aspect of our program and something we are proud of.
What we learned
One of the things our team learned through the project was how to use the Javascript library, Chart.js. We learned how to import the library into our project and use it to implement the visualization aspect of our project. Another thing that our team learned was how to collaborate with one another on a multi-scale project. We learned that assigning each team member a part was the most efficient way to carry out the project, rather than working on each element as a team.
What's next for LETSSviz
The next steps for LETSSviz would be to implement an aspect where the user can link data from link instead of uploading their own CSV file. Another thing that could be added is giving the user more options for customization, which can include; color, design elements, etc. It could also give the user a simple analysis of the data which can include; trends, key points, comparisons, etc. Another step for LETSSviz would be to add an option where the user can publish the visualization and create a unique URL for the visual.


Log in or sign up for Devpost to join the conversation.