-
-
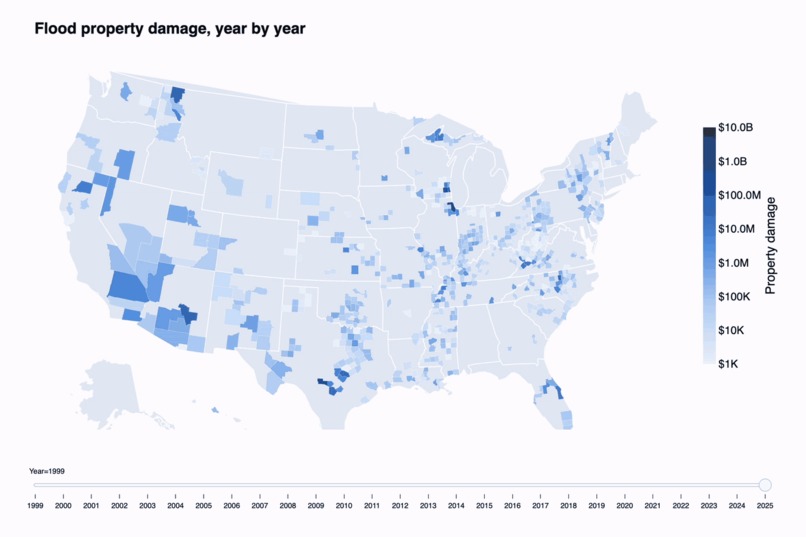 GIF
GIF
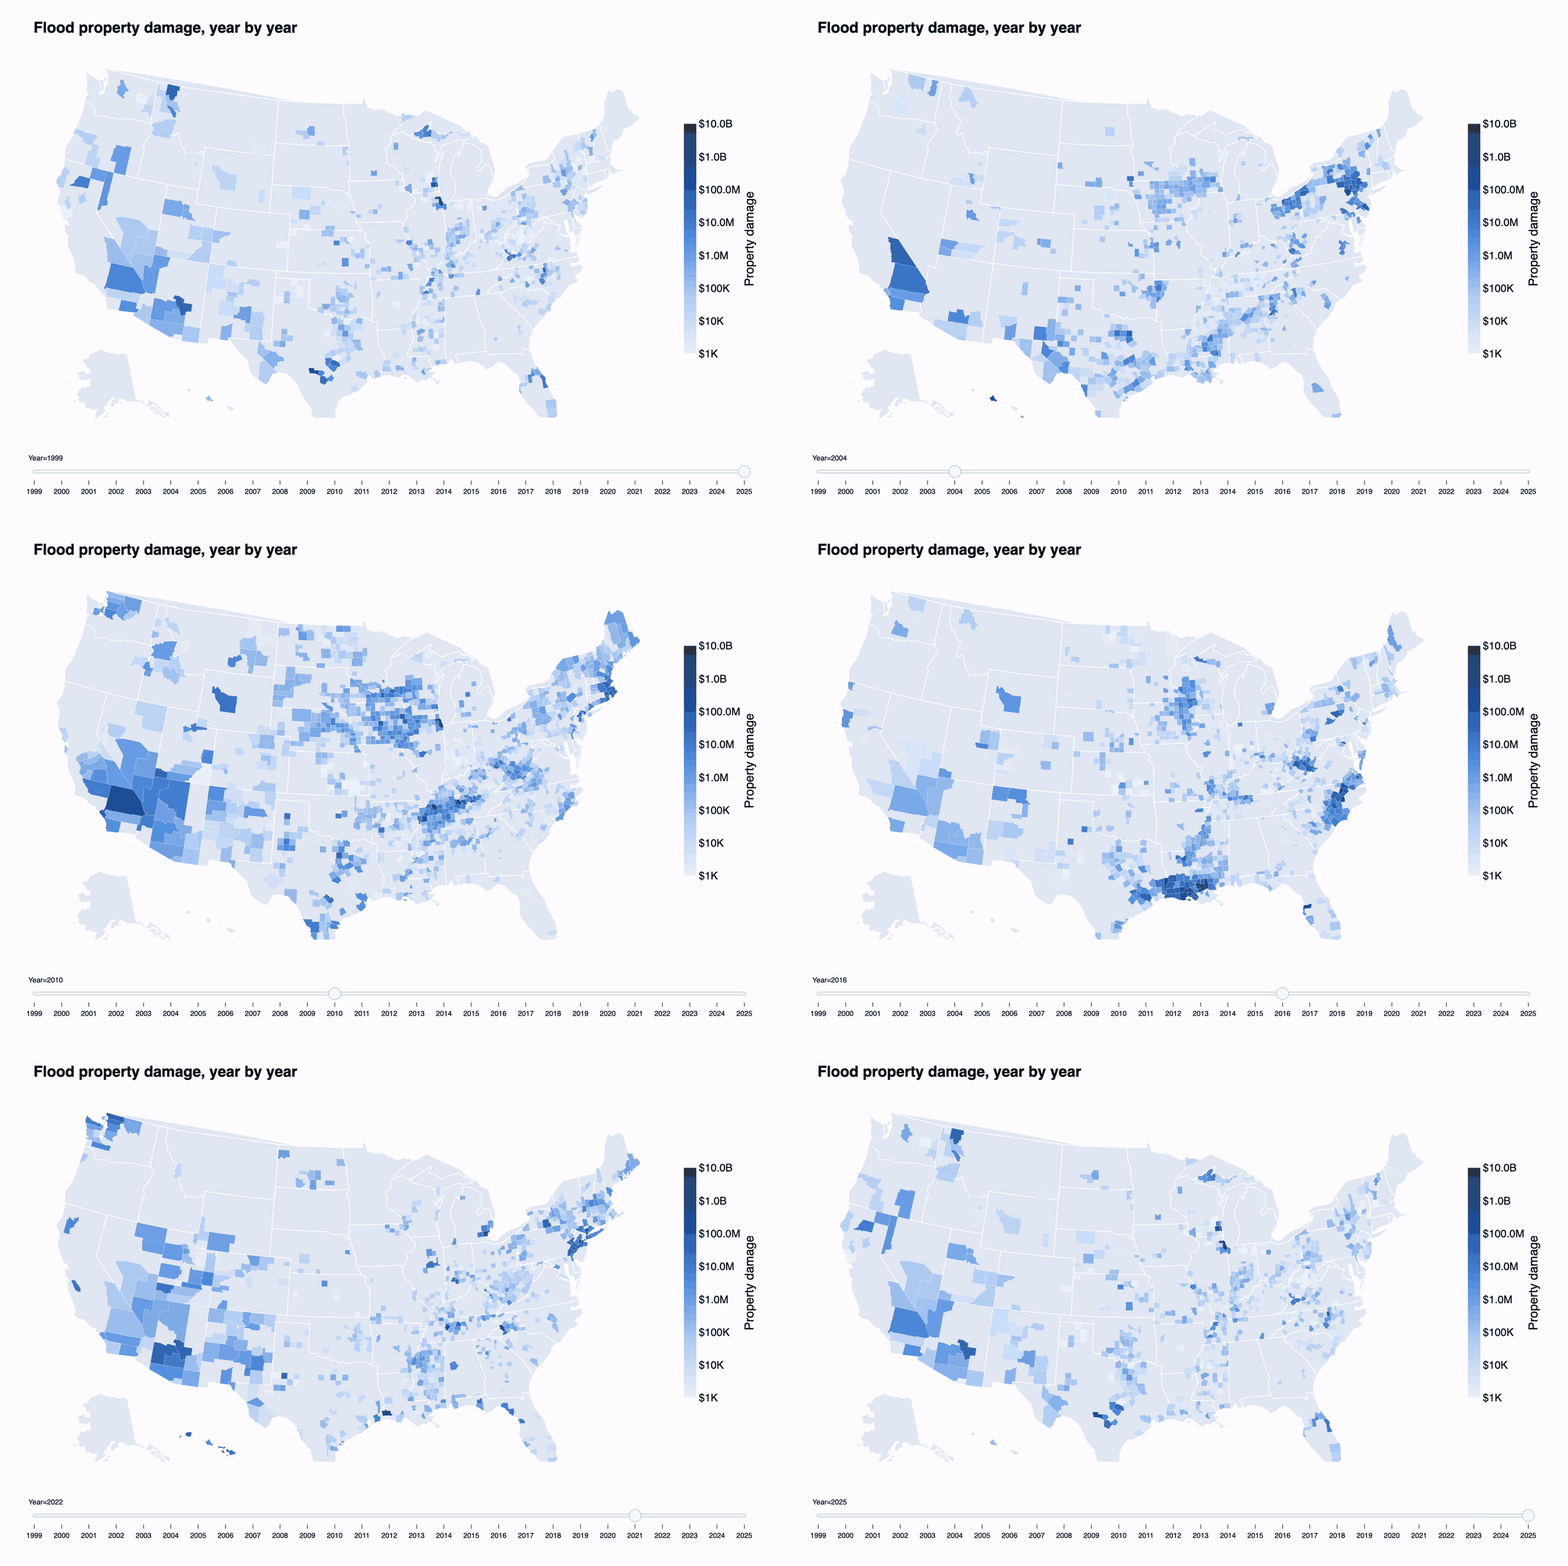
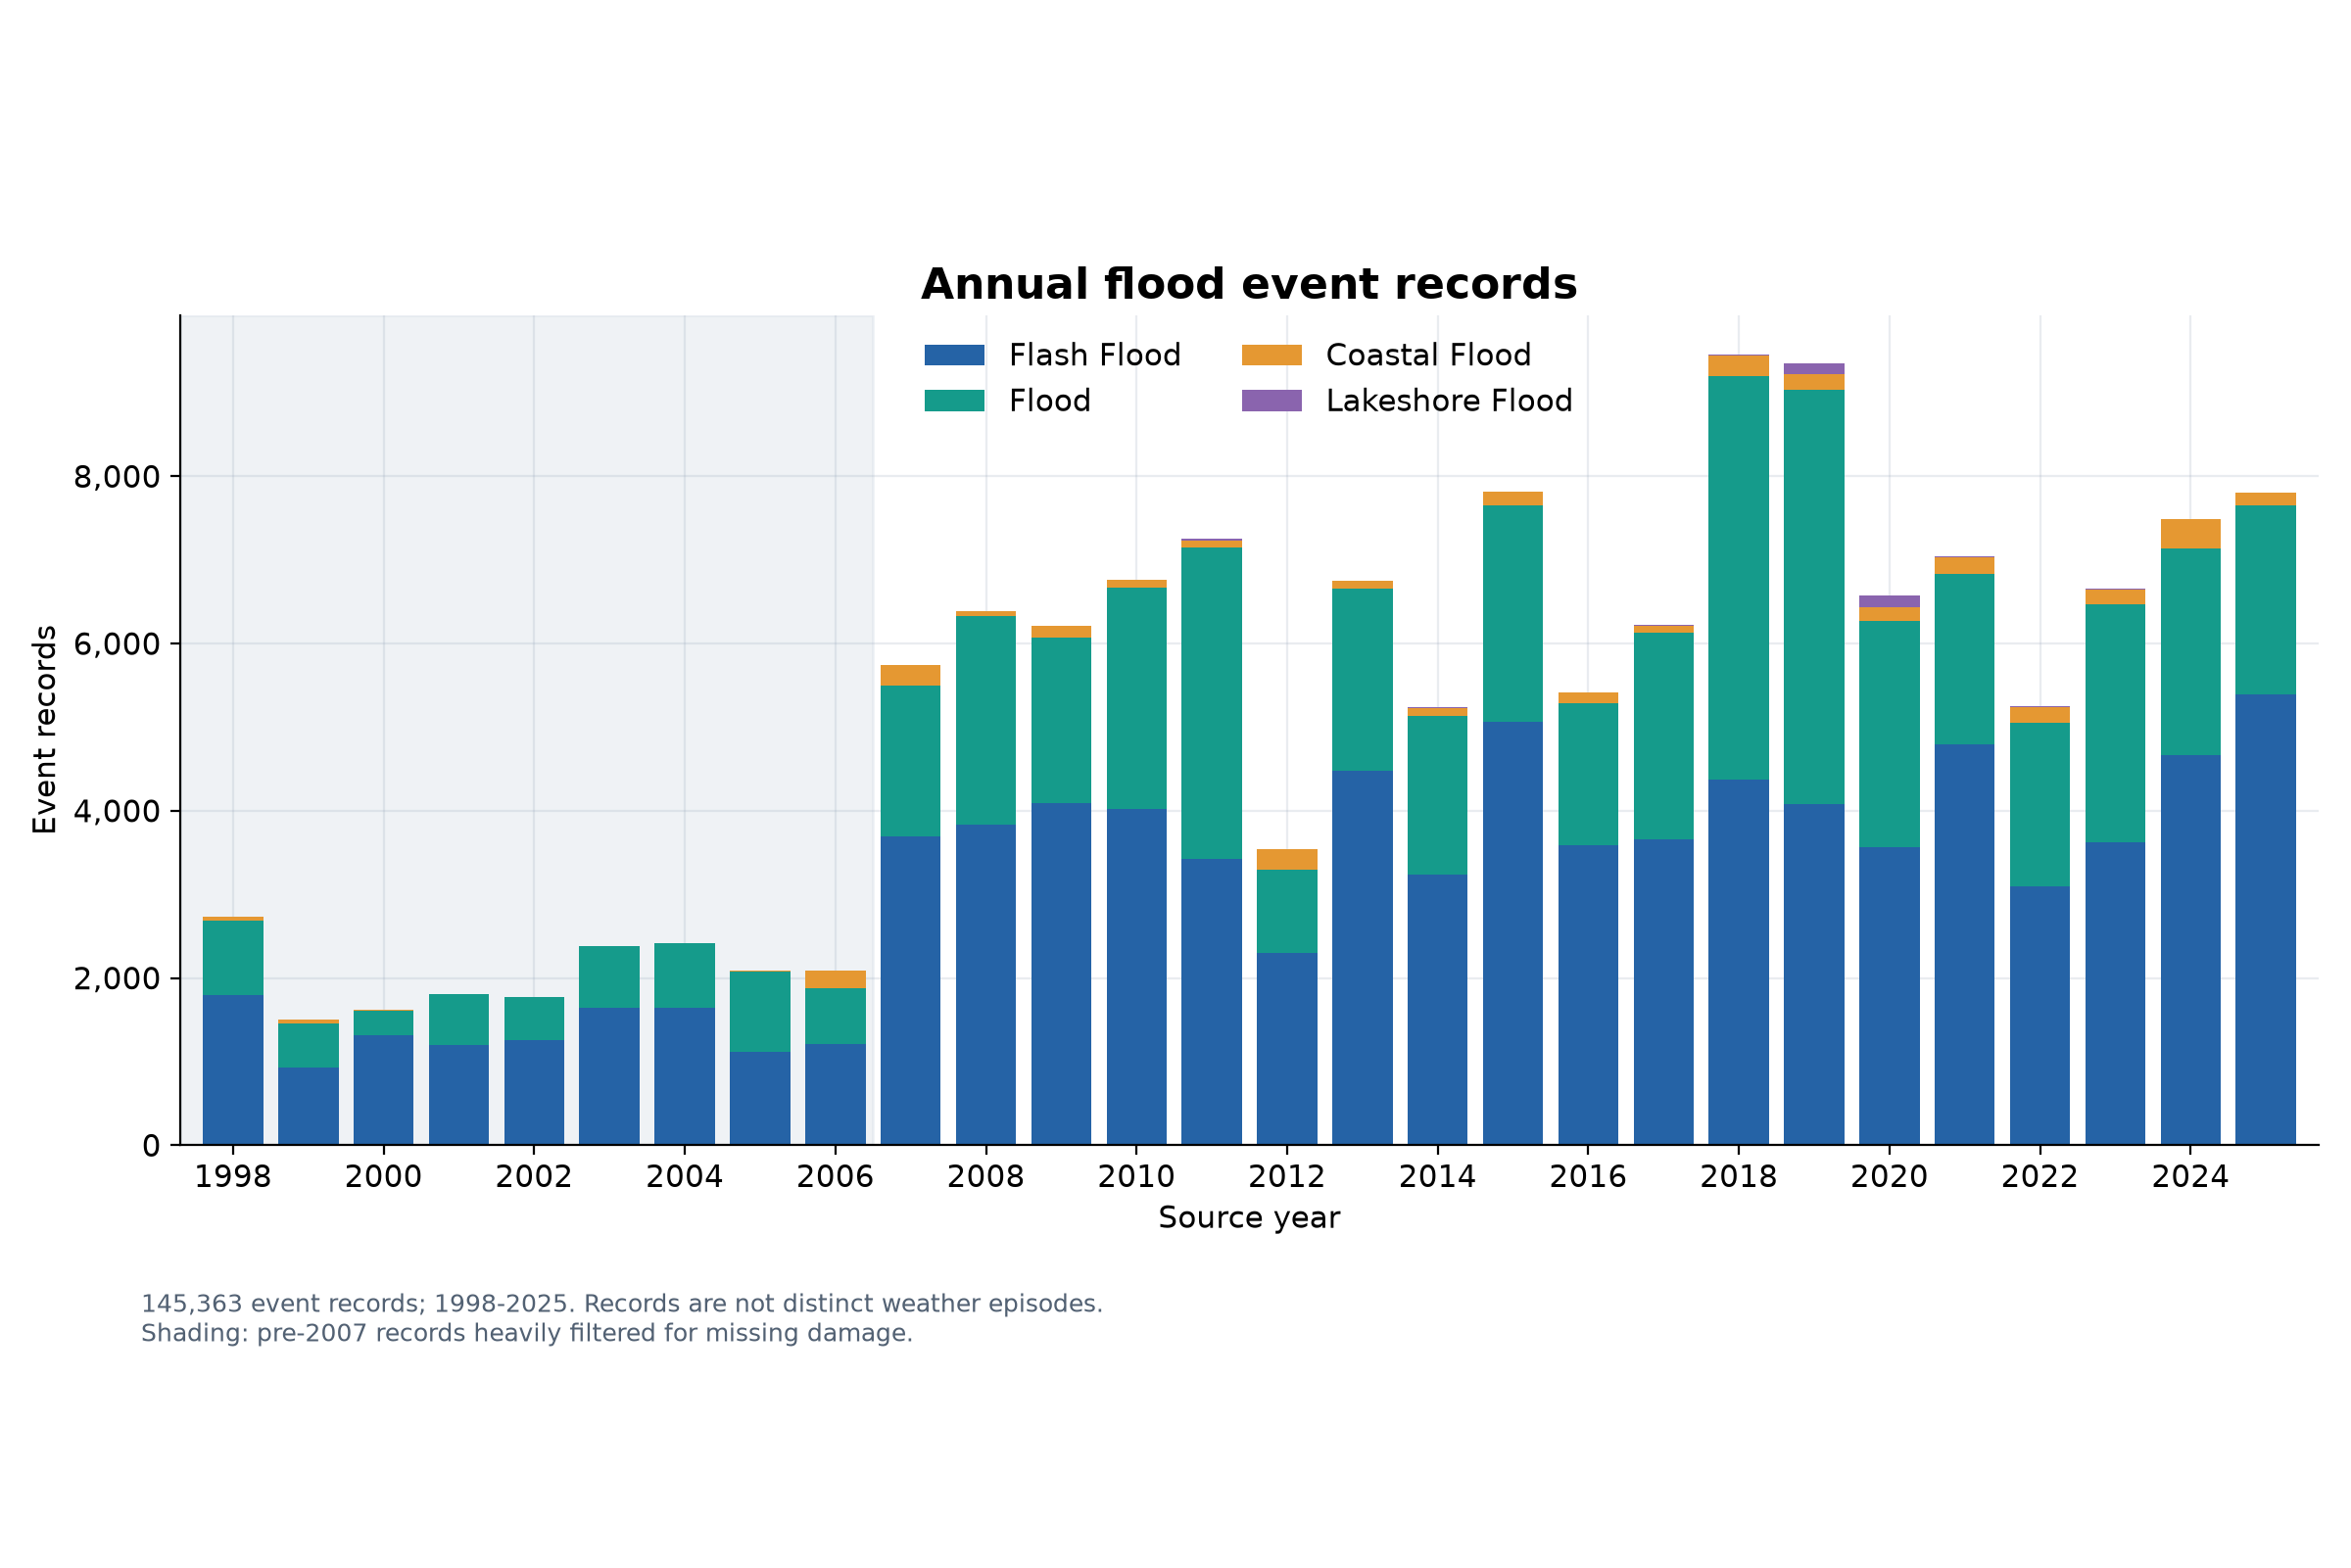
Flood damage by year
-
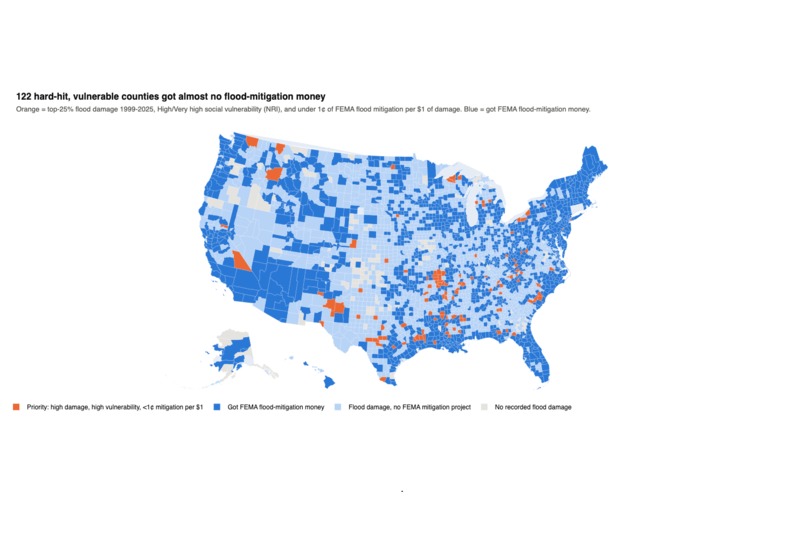
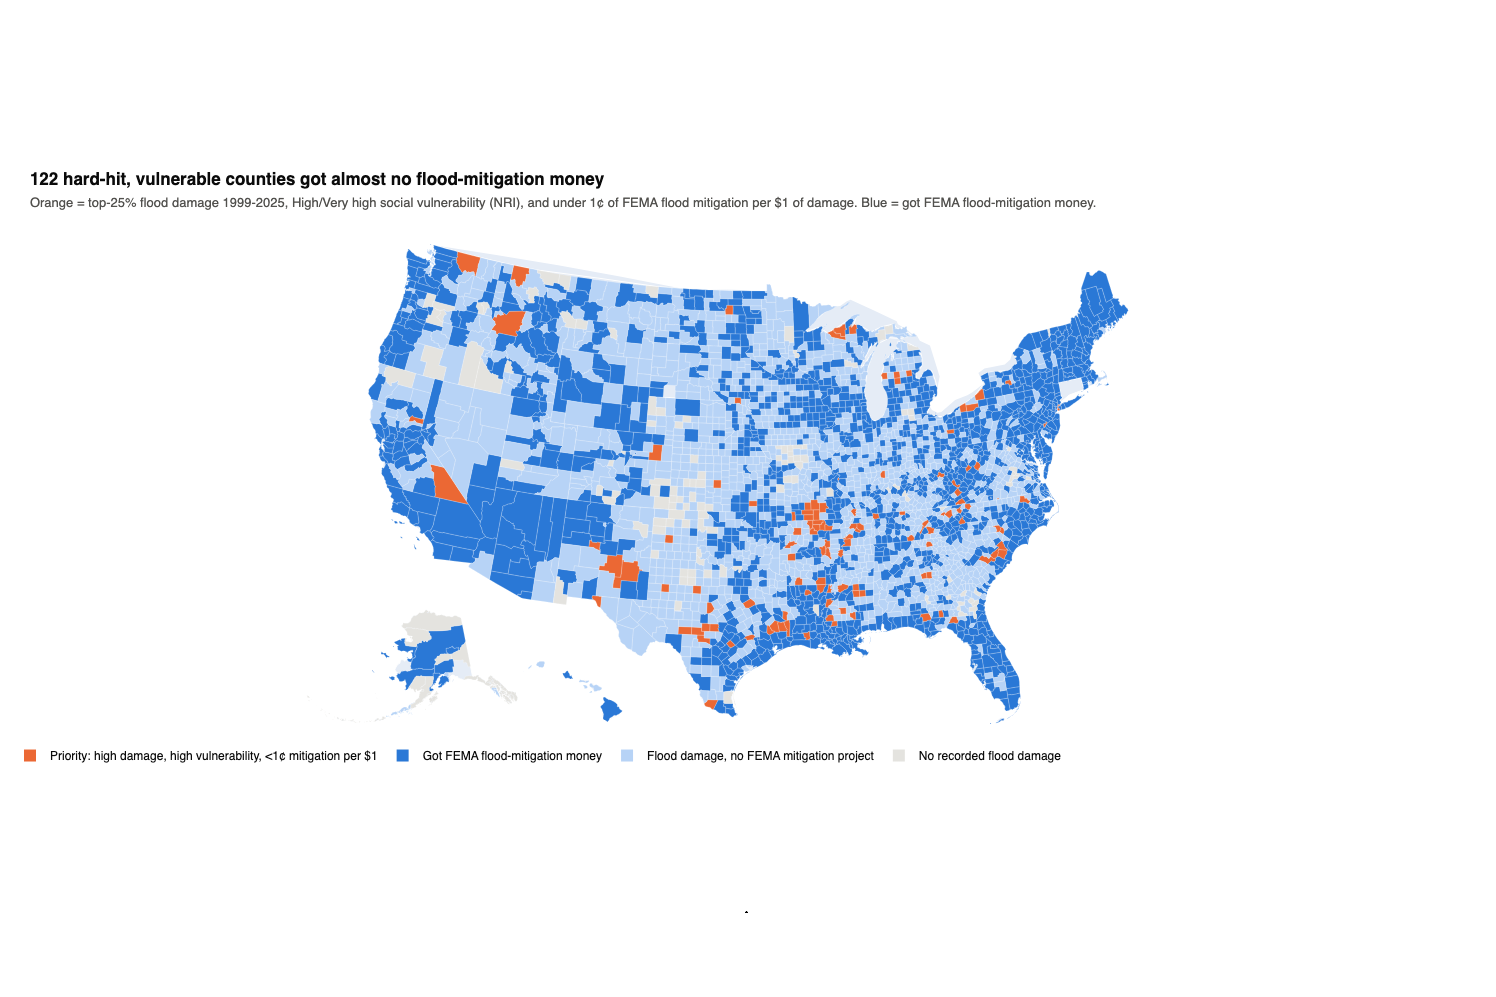
122 hard-hit, vulnerable counties got almost no flood-mitigation money
-
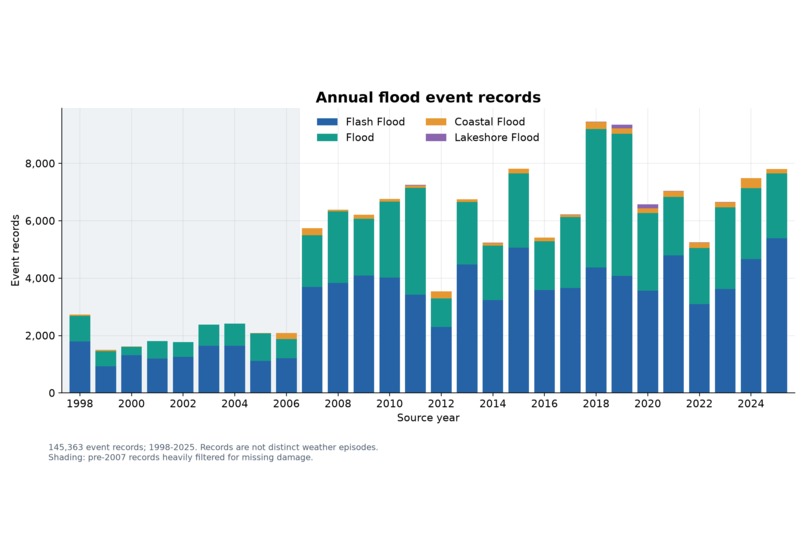
Annual Flood Event Records: Shows the number of records each year and their breakdown by the four flood types.
-
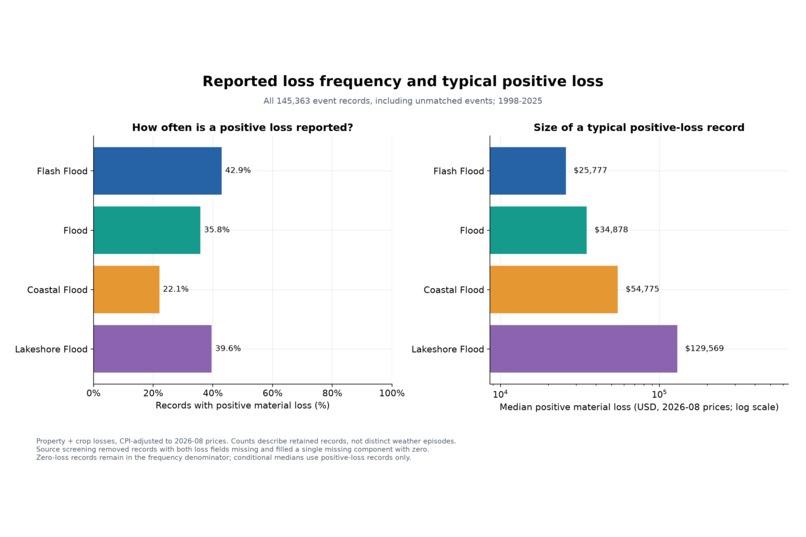
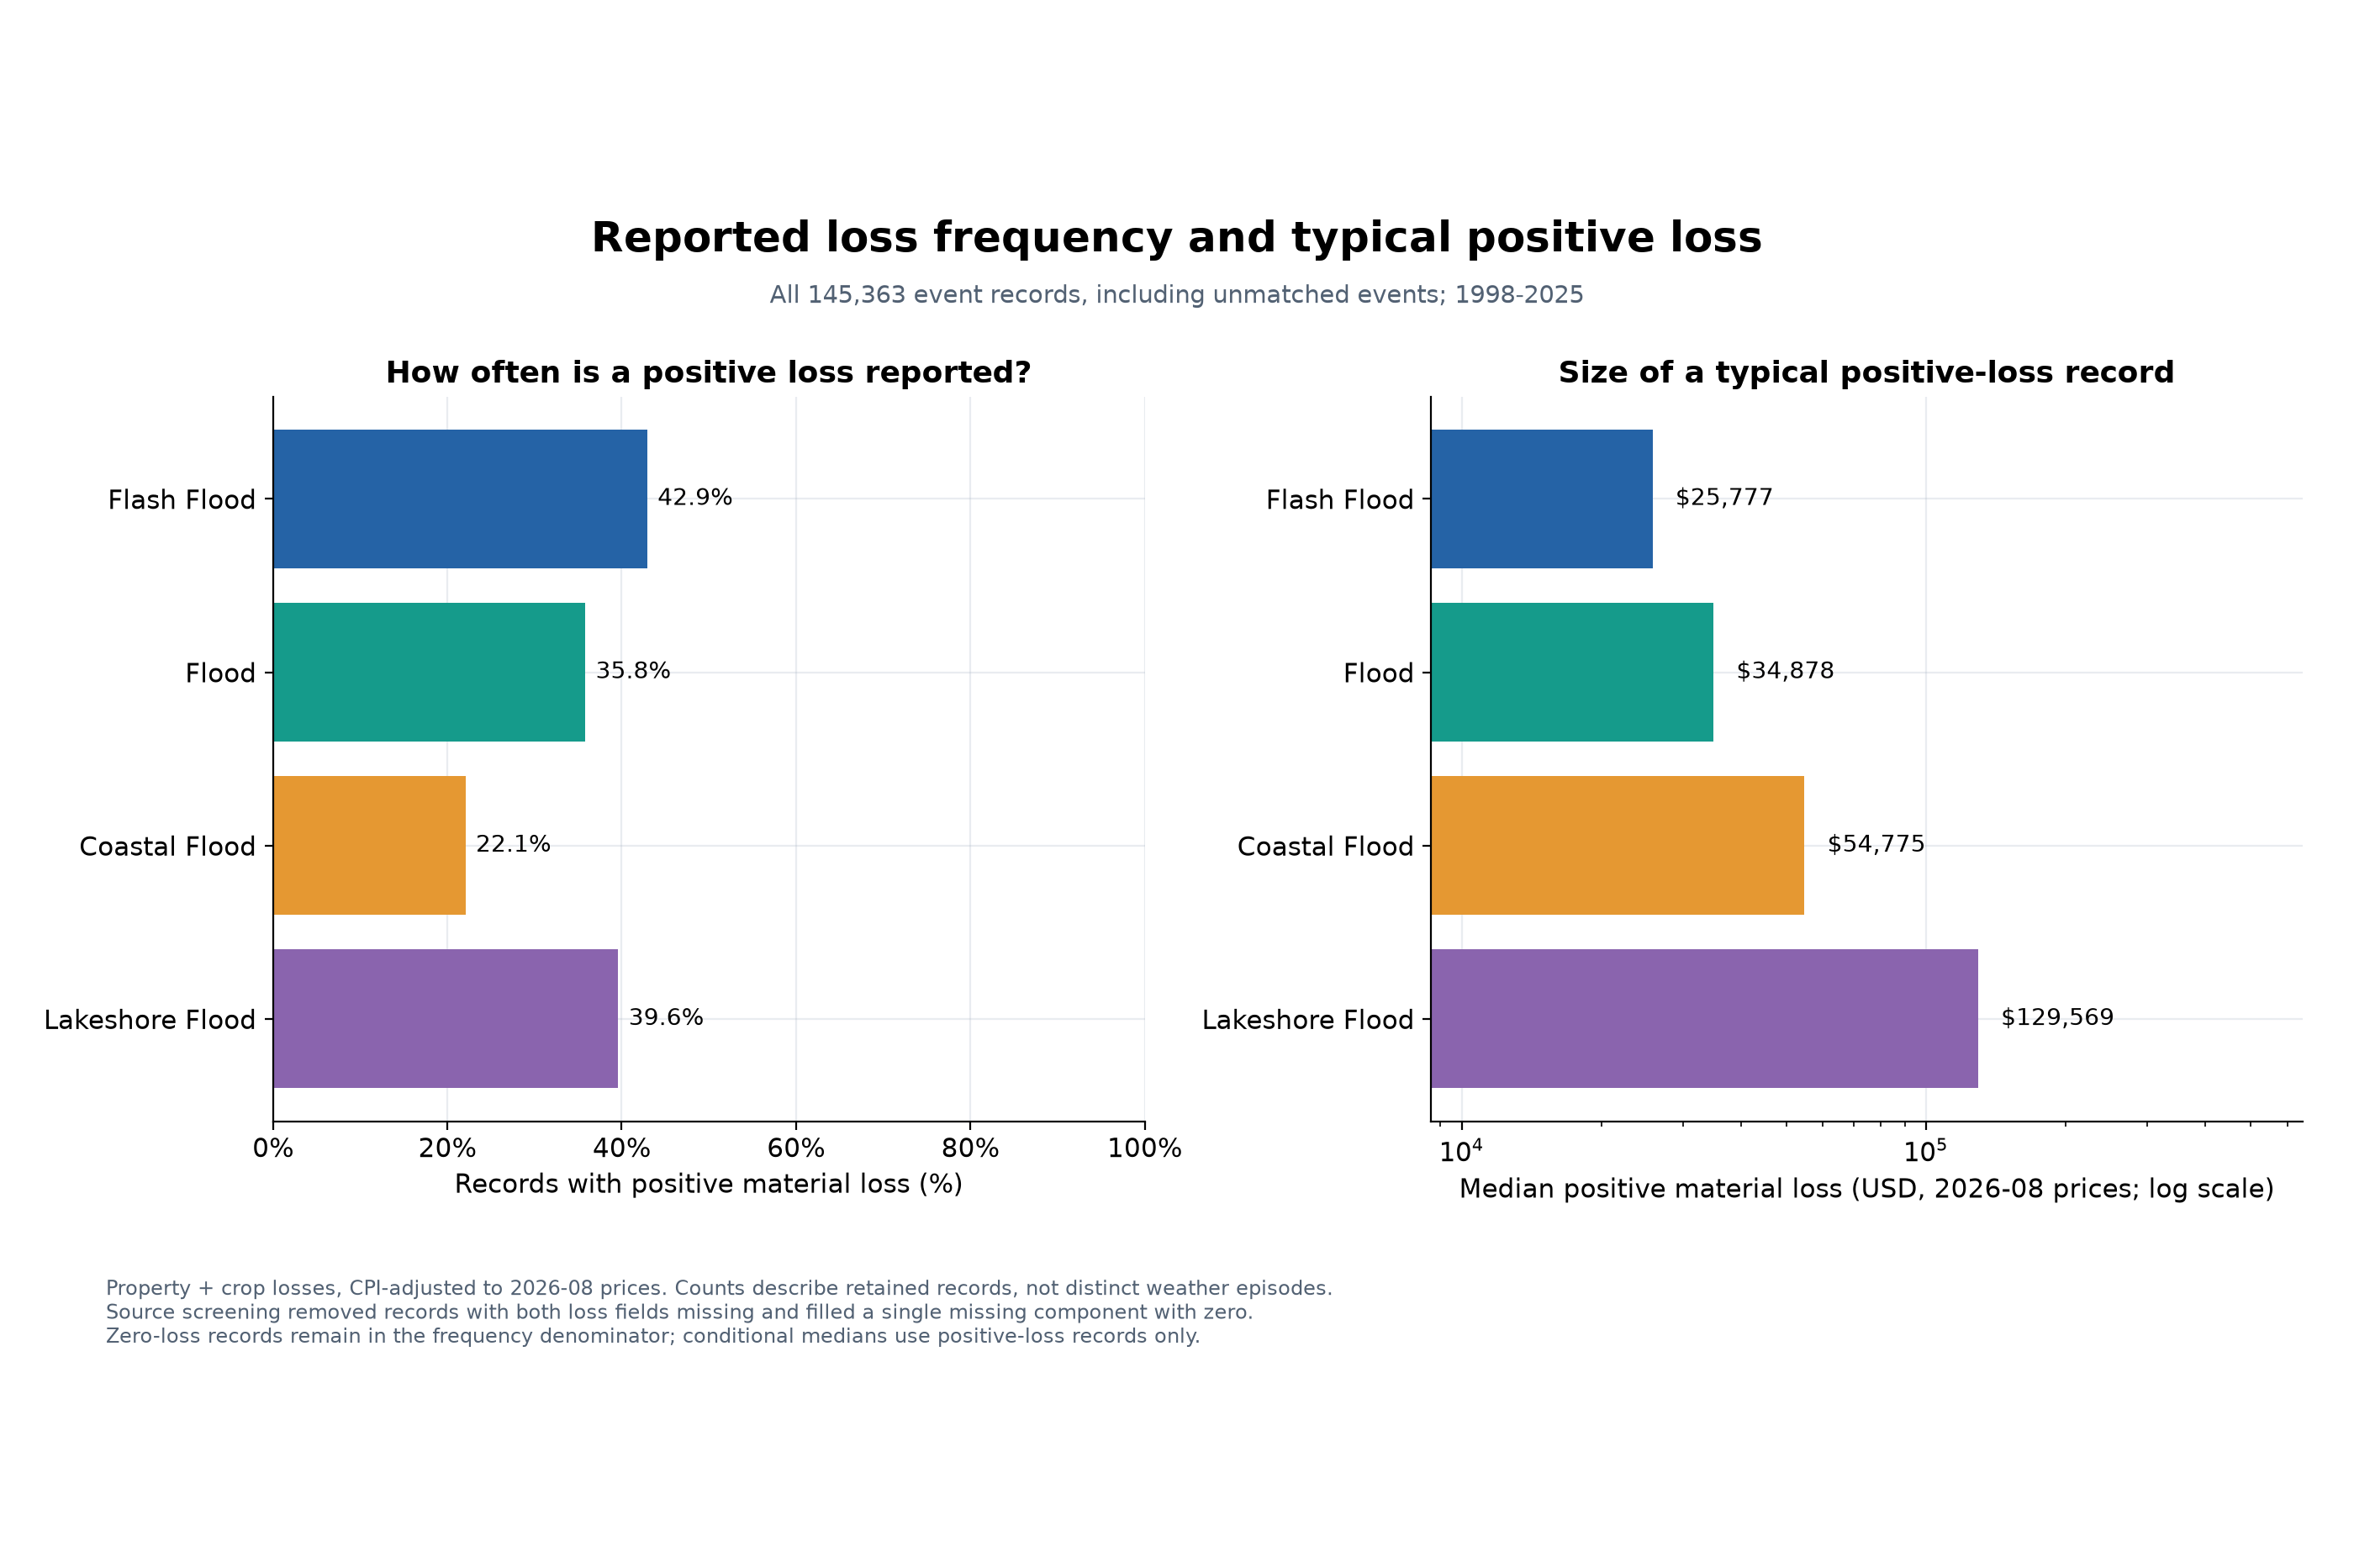
Positive-Loss Frequency and Typical Loss Size: Compares the percentage of records reporting positive losses and the median loss amount.
-
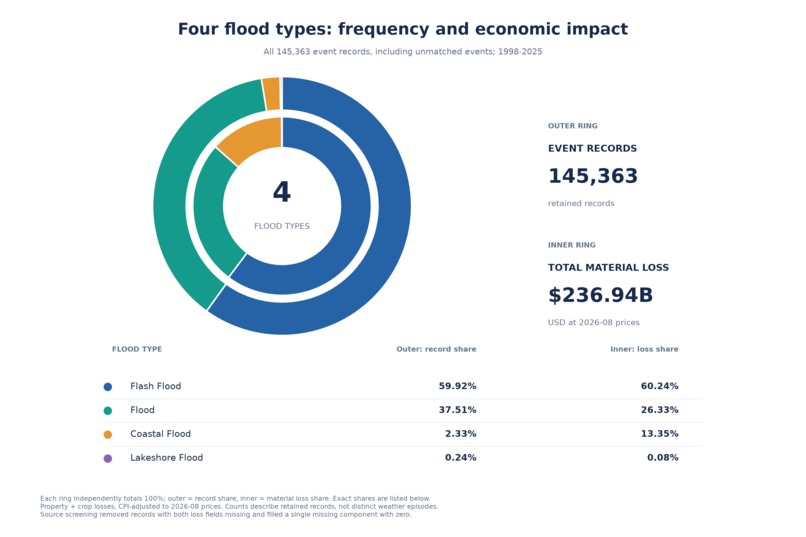
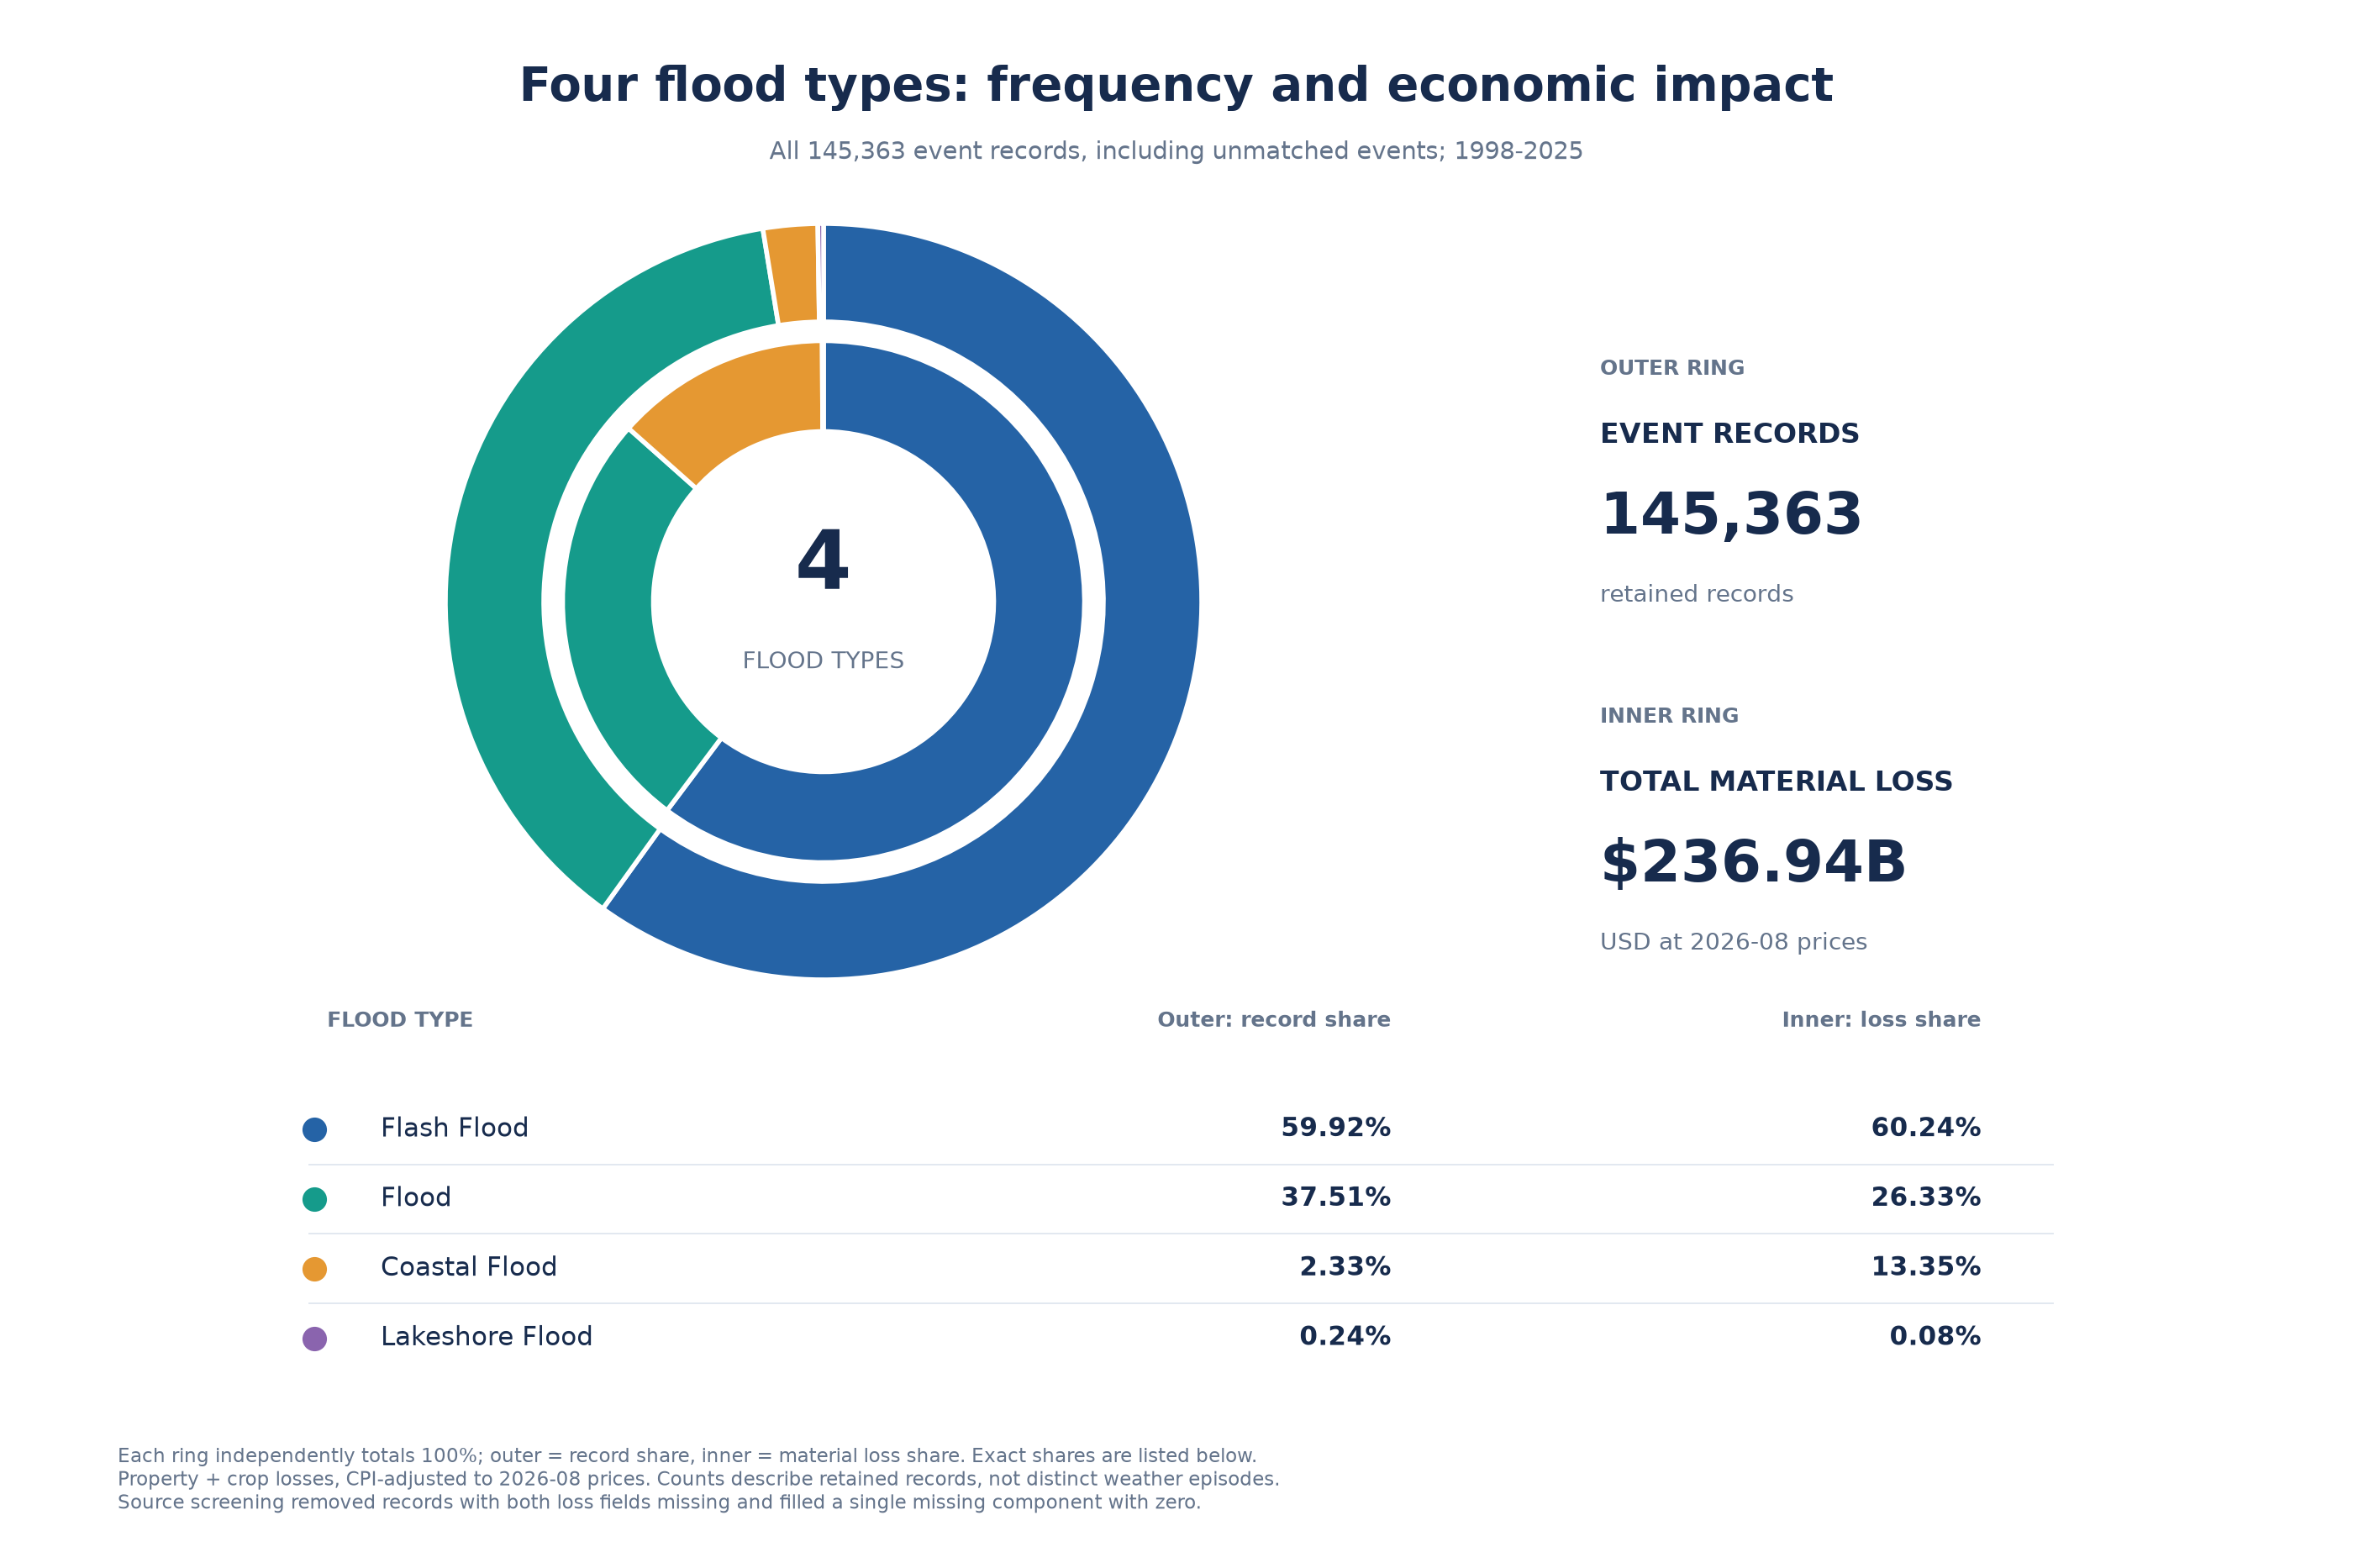
Record Share versus Loss Share: outer: each flood type’s share of records, inner: shows its share of total losses.
-
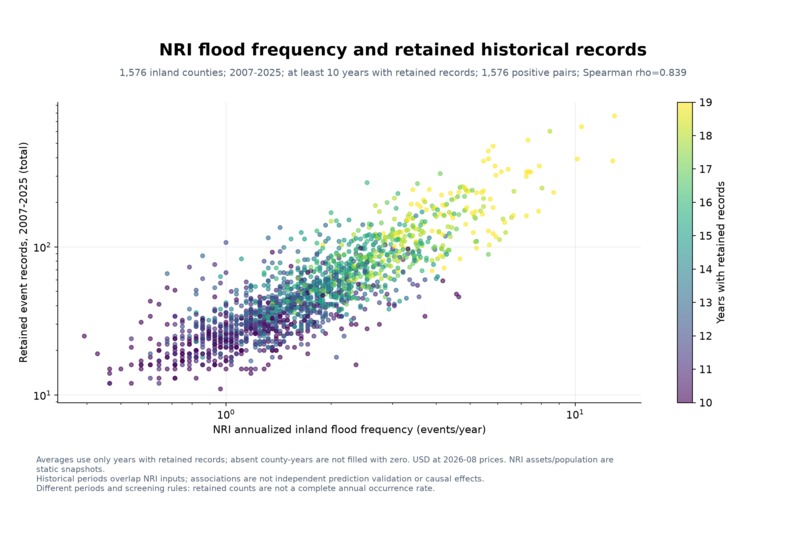
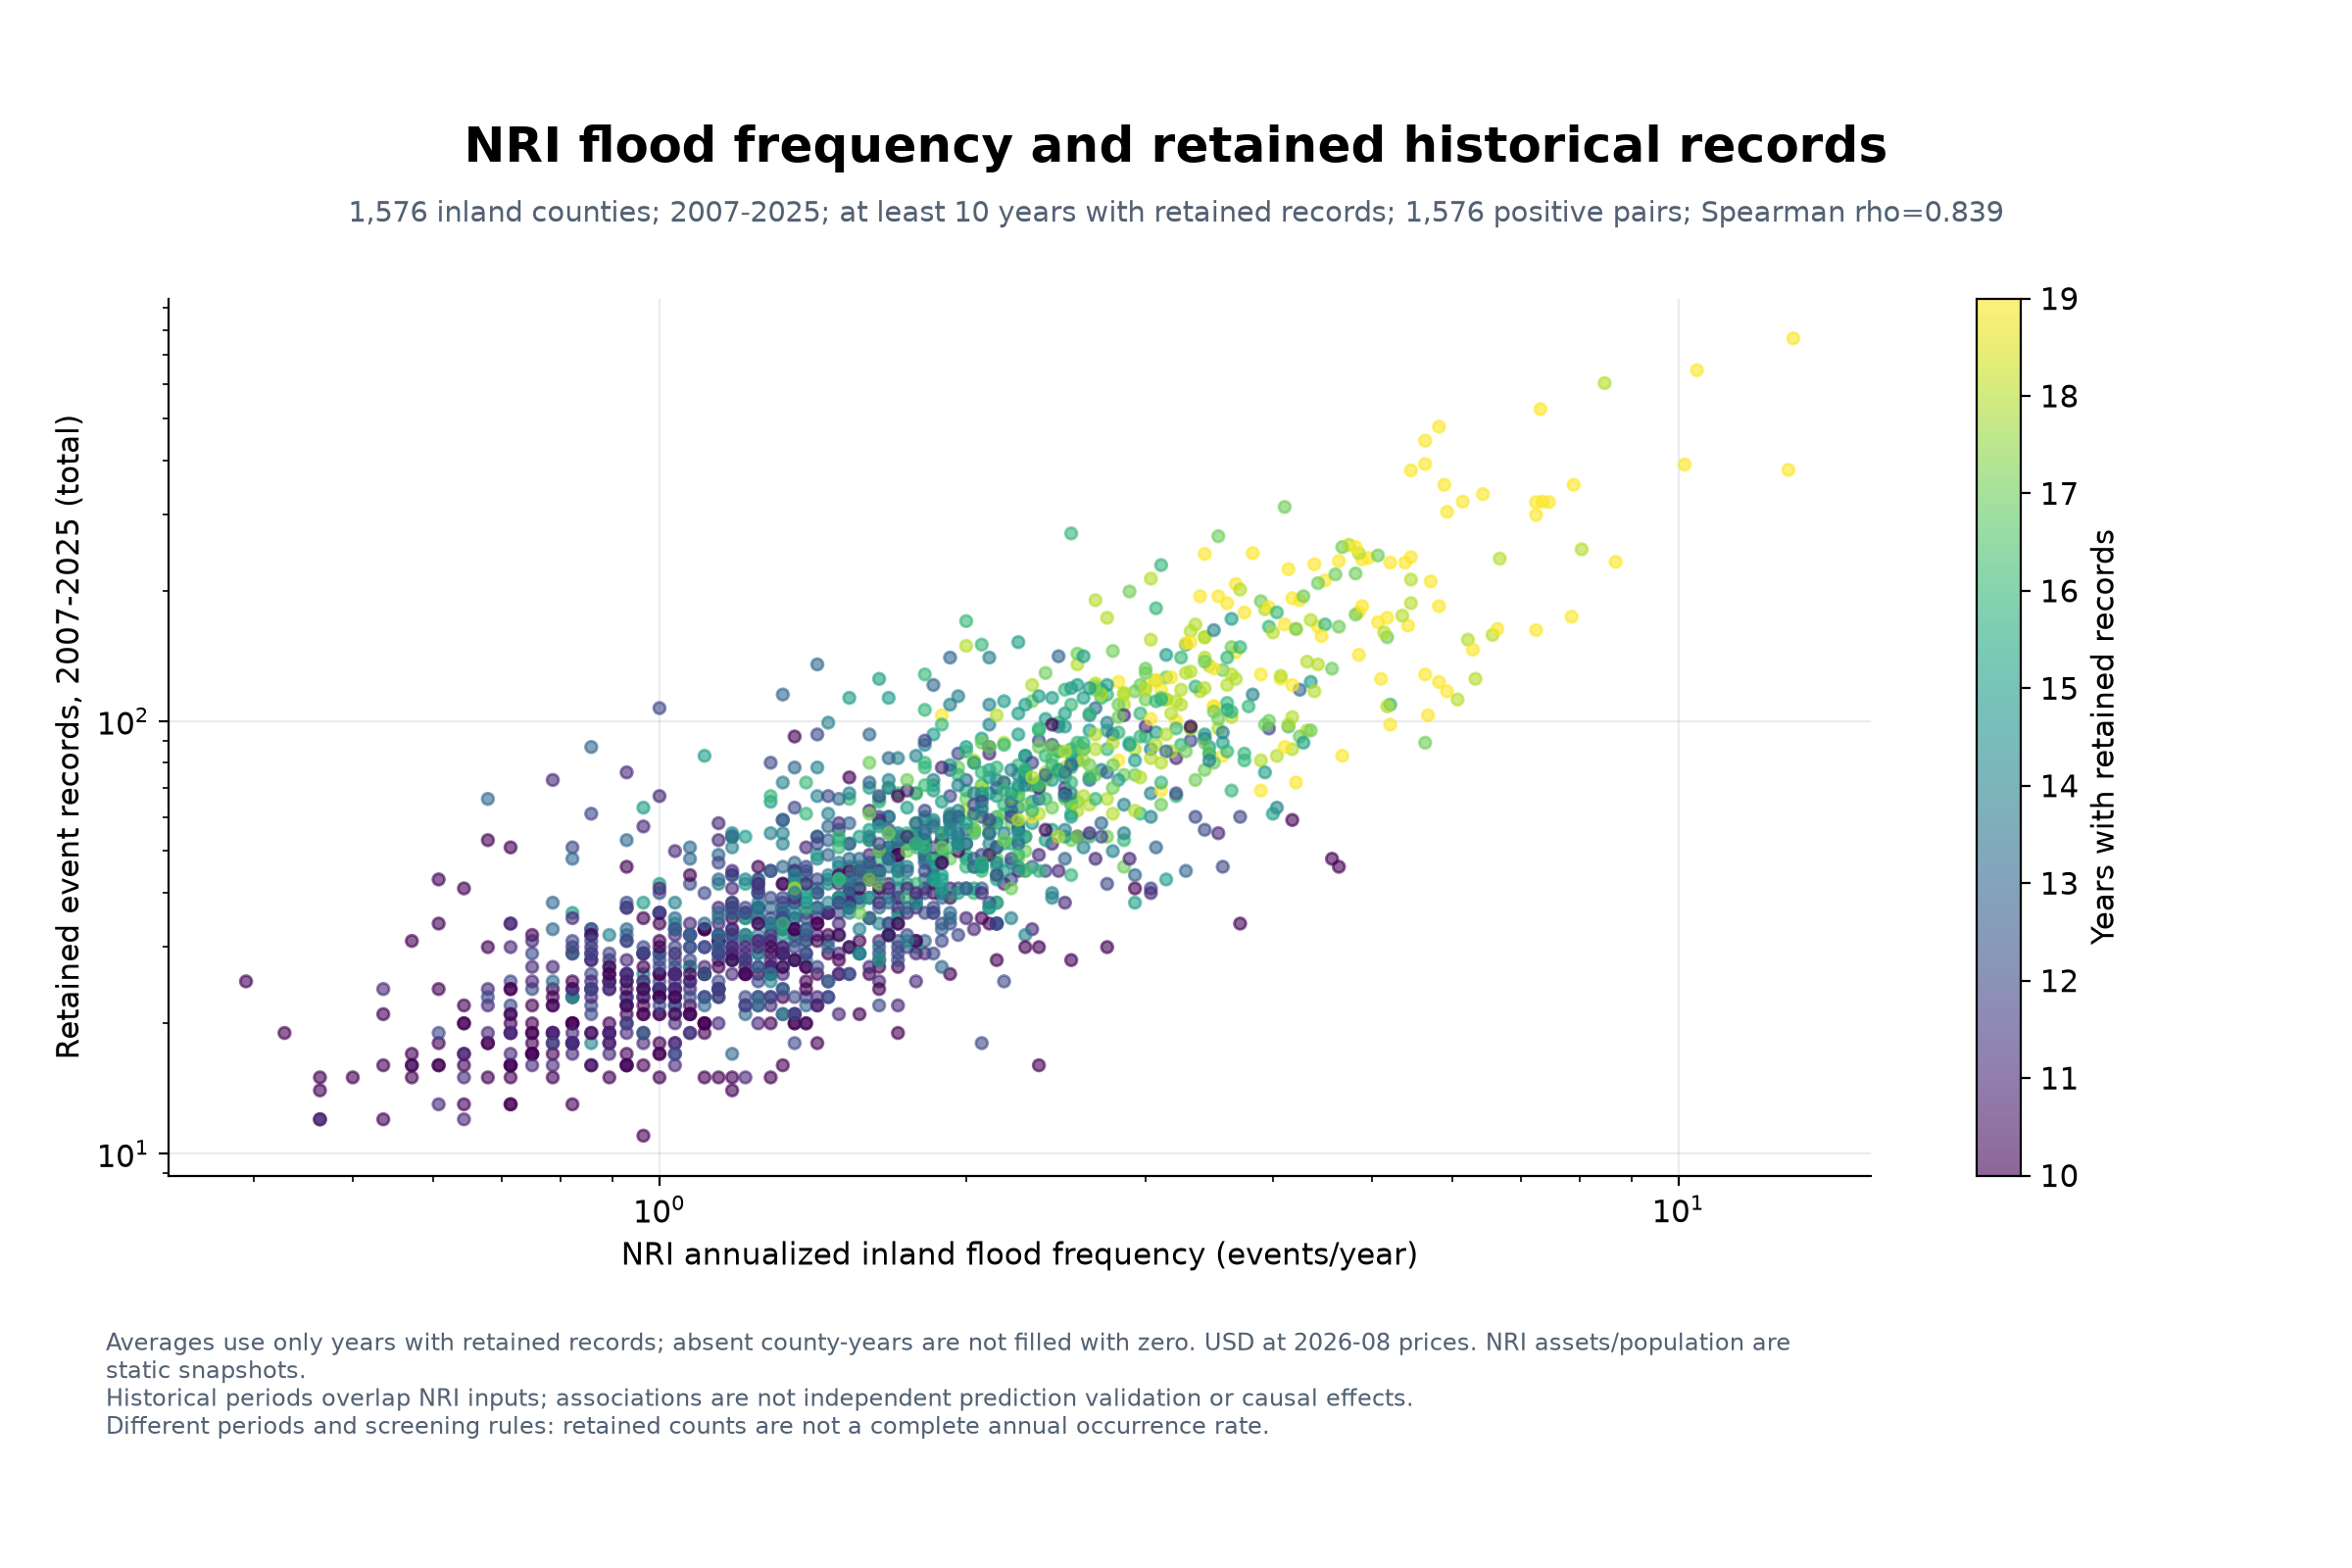
NRI Frequency and Historical Record Counts: Examines the association between NRI annualized flood frequency and retained historical records.
-
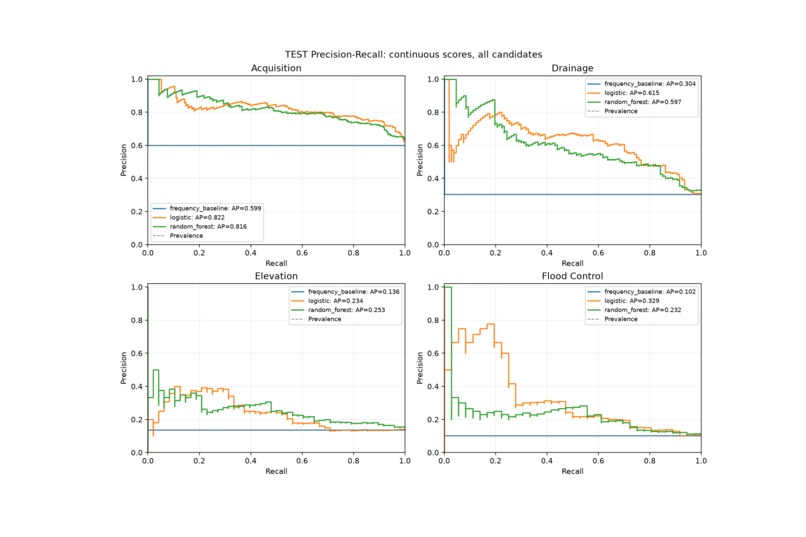
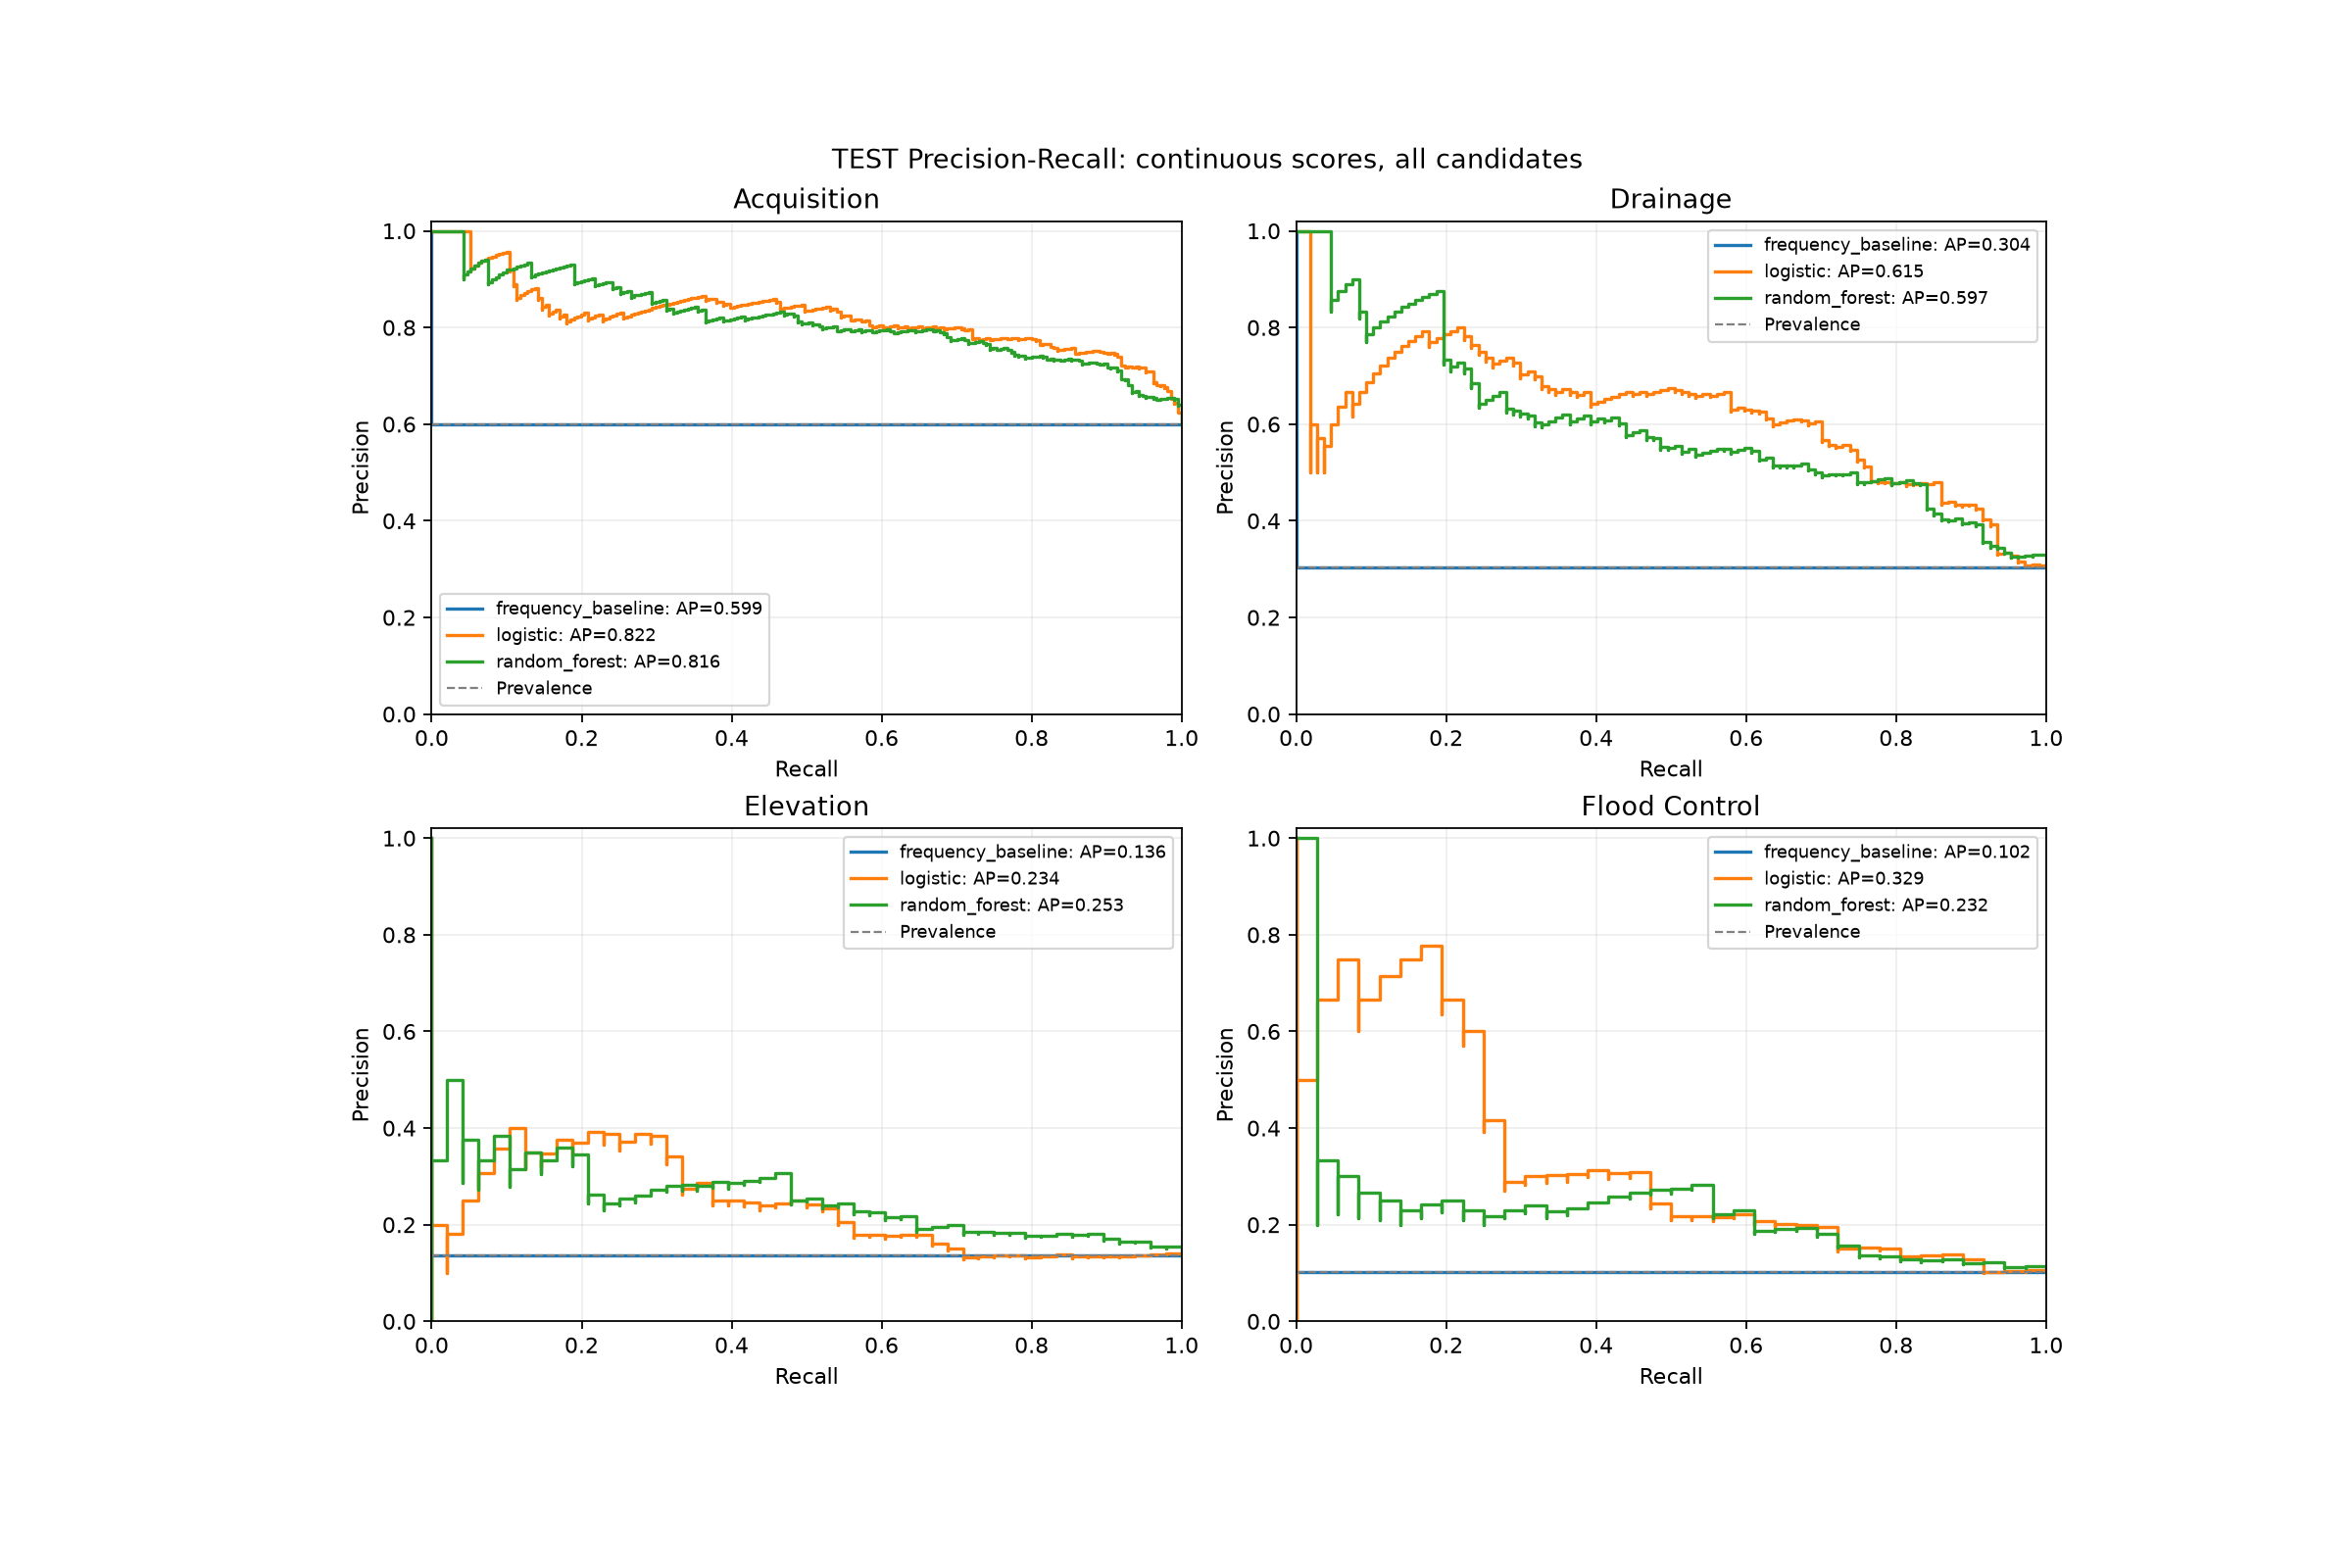
PR Charts
Inspiration
Floods are America's costliest disaster, but funds are distributed unevenly. Reactive relief fails to protect vulnerable communities, amplifying socioeconomic inequality. We built this to answer: Who suffers most, and does FEMA money reach those needing it most?
What it does
Left in the Flood is a spatial intelligence platform visualizing 27 years (1999 - 2025) of NOAA records. It also acts as a decision support system. For any county, our AI estimates federal recovery funding and recommends optimal mitigation measures like property acquisitions.
How we built it
- Frontend: HTML, Mapbox, and deck.gl for an interactive 3D map.
- Data: Python scripts clean NOAA files and join FEMA grants.
- Machine Learning: Logistics and Regressions powers our Elastic Net funding model and Multi-label Logistic Regression recommender.
- Scope: Synthesized 145,363 event records, machine learnt from 36,450 of them.
Challenges we ran into
- Missing Data: Pre-2007 records lacked damage values, requiring heavy interpolation.
- Long-tail Distributions: The costliest 1% of events cause 92.1% of recorded damage. Modeling this was statistically difficult.
- Performance: Rendering massive 3D data required baking data directly into the frontend.
Accomplishments that we're proud of
- Uncovering Gaps: Identified 122 vulnerable counties receiving under 1¢ of mitigation money per $1 of damage.
- High-Performing Model: Our model catches 84.47% of funded mitigation measures.
- Cohesive Storytelling: Unified scattered datasets into one clear narrative.
What's next
- Broader Scope: Integrating Coastal floods due to higher median losses.
- Dynamic Tracking: Adding year-over-year vulnerability metrics.
- Causal Analysis: Linking mitigation projects to long-term economic resilience.
Why it matters
Vulnerable counties suffer more, yet rarely receive mitigation projects. Federal relief remains reactive rather than equity-driven. By quantifying these disparities, we turn disaster logs into actionable insights. Climate resilience must be accessible to everyone, not just the wealthiest.
Built With
- deck.gl
- geospatial
- html
- machine-learning
- mapbox
- python


Log in or sign up for Devpost to join the conversation.