-
-
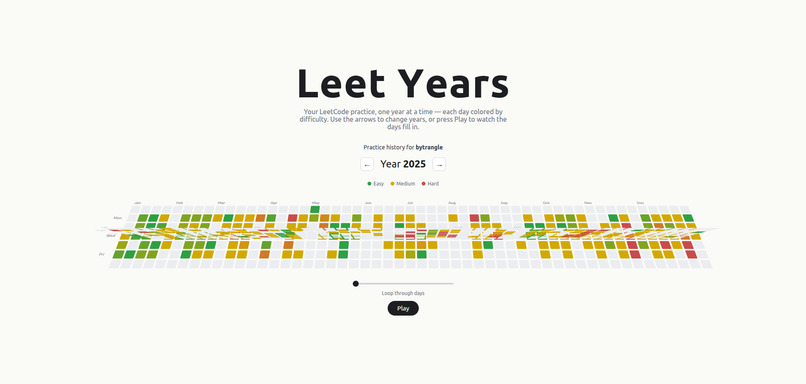
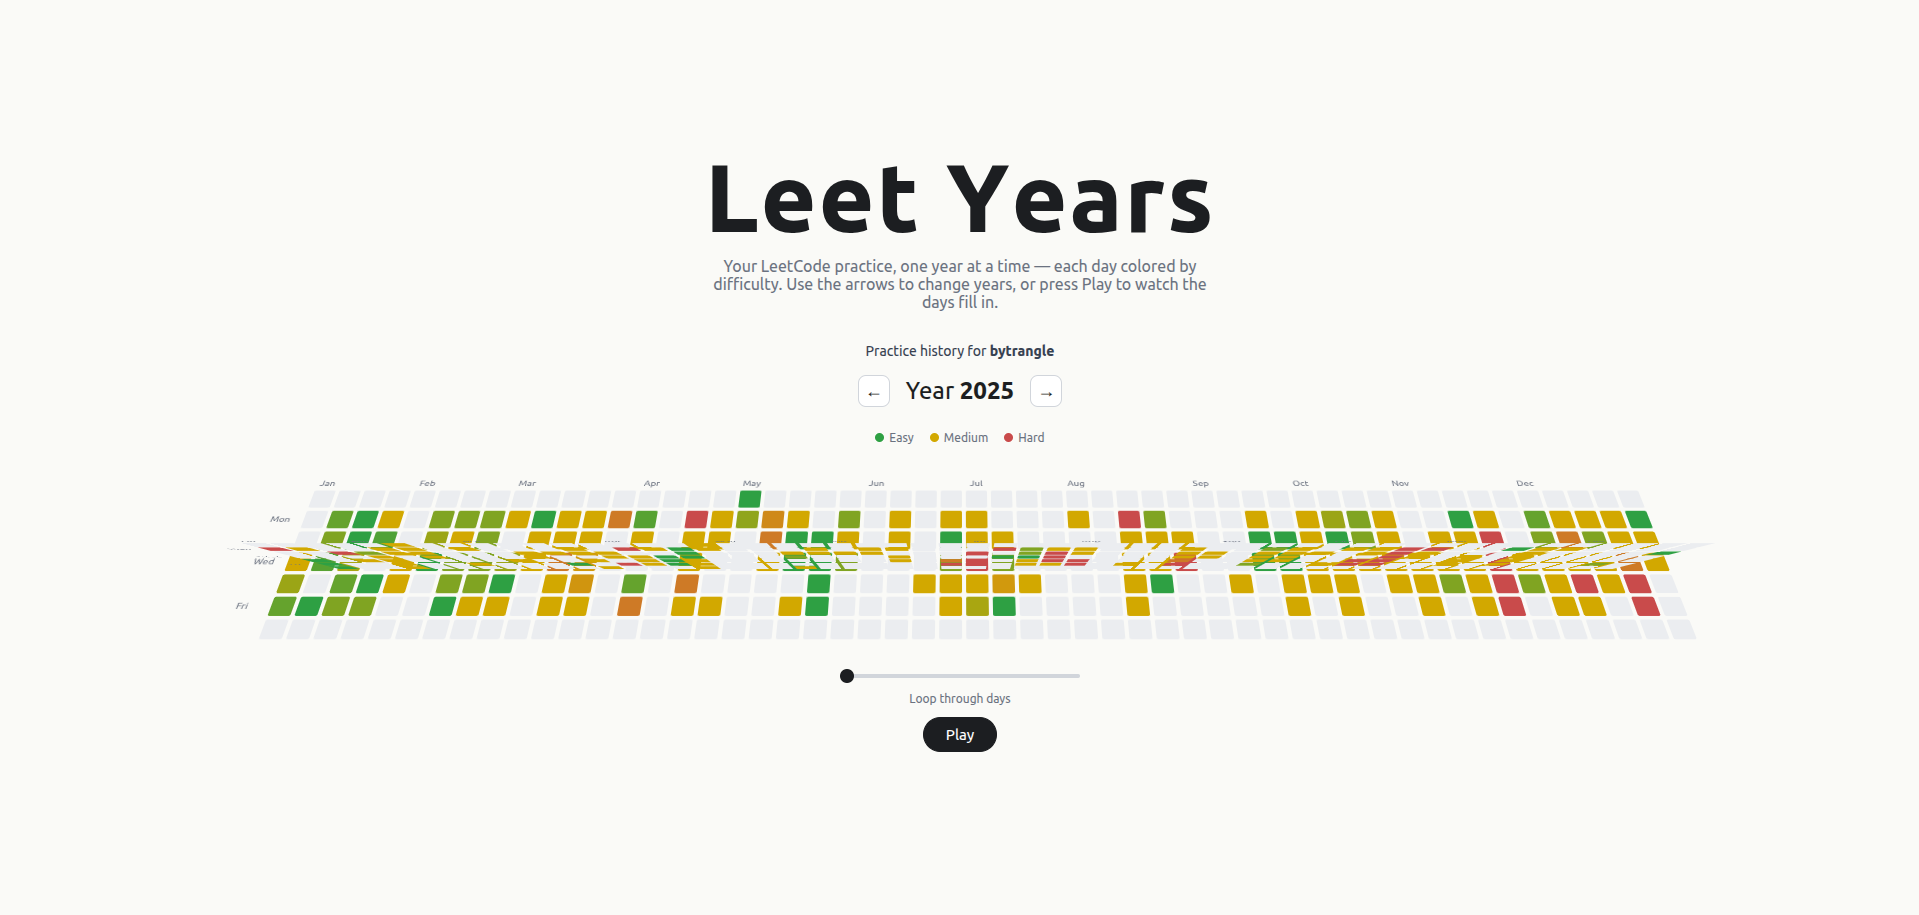
Flip animation when switching to a different year
-
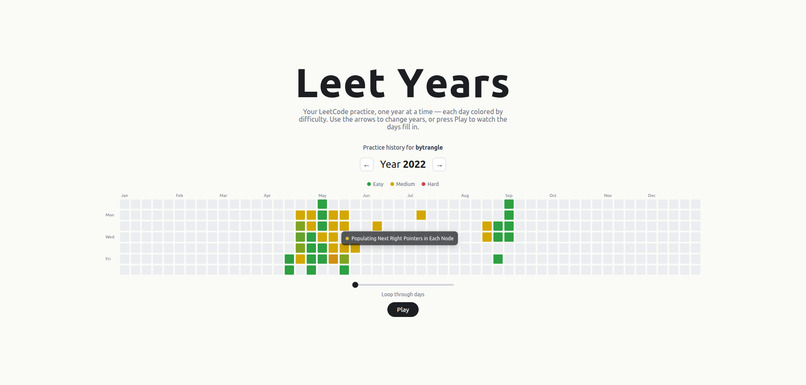
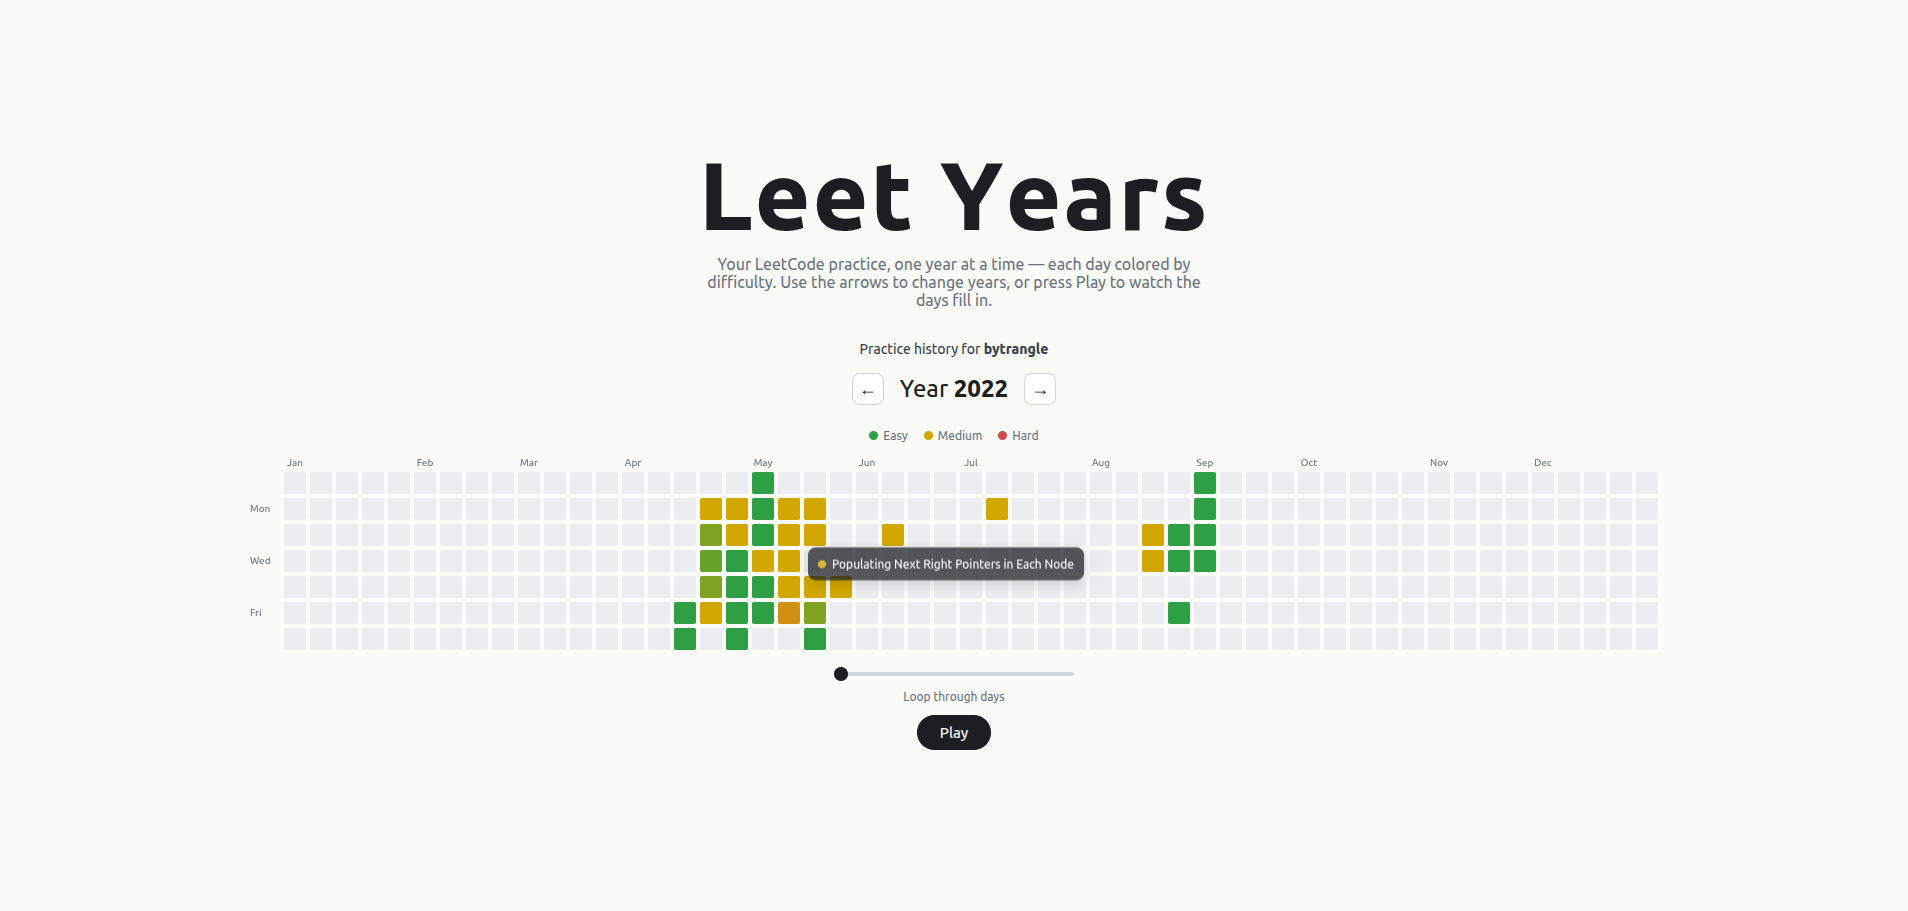
Hover over each cell to see the problems solved for that day
Inspiration
I've been practicing on Leetcode for half a decade. Yet there is no easy way to visualize all the hard work I've done, to tell whether I've made progress, regressed, or hit a plateau. There are plenty of third-party API wrappers for fetching Leetcode data, but none that helps turn the raw data into meaningful story.
What it does
This is a CLI tool that turns your Leetcode's practice data into a heatmap. One heatmap contains 365/366 cells, which correspond to all the days of the year. For days that you solved at least one problem, the cell will be colored based on the average difficulty score of that day. Easy problems - green; medium - yellow; hard - red. For example, if you solve two medium and one easy problems, the cell for that day will be greenish yellow.
How we built it
This hackathon makes me realize that the way developers work have changed dramatically. This project started with plenty of hand sketches to turn the ideas in my head into clumsy images. Then I start all the agent skills from 1 to 6 and describe those images to the agent.
But there are aspects that are easier to code by hand. For example, CSS. I had a strong vision of what my app should look like, and LLM is not that good at seeing images yet. Most of the designs, layout, and animation were hand-coded.
Challenges we ran into
The biggest challenge is that this is a CLI tool. Fetching historical Leetcode data for any user requires authentication, and that takes the form of user's Leetcode session cookie. Keeping that credential out of the browser eliminates cross-origin risks and prevents any third-party from seeing the cookie.
A CLI is always harder to pitch than a web app. It's not easy to convince people to run a command in the terminal and install something unfamiliar. So I supplement the app with a React frontend. Every one gets a localhost website where they can see replay their arduous practice journey and remember that it's always worth it.
Accomplishments that we're proud of
The visualization is inspired by Github's contribution graph, but more exciting due to the flip animation, and it has more dimensions because you can hover over each cell and see what problems you solved for that day.
What we learned
Vibe coding is fun, but it stops being fun you get more serious about your project. Spec-driven development, or whatever you want to call it, produces better results than vibe coding.
What's next for Leet Year
There are many ways to visualize a given dataset. What matters is the goal and the target audience. I'm researching the language of data visualization in order to help Leetcoders tell quickly their strong and weak spots.

Log in or sign up for Devpost to join the conversation.