-
-
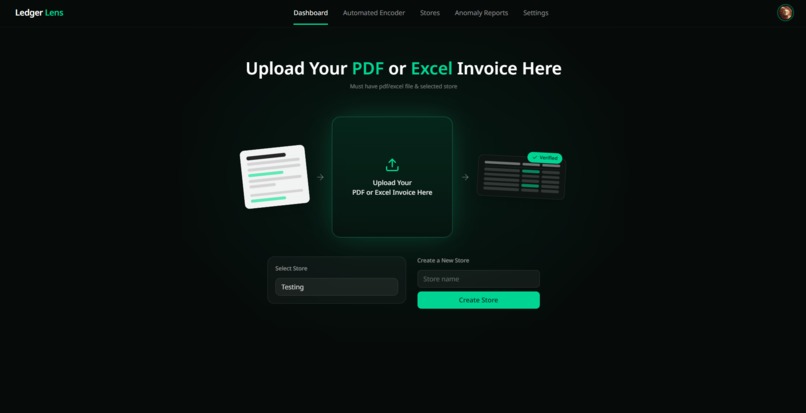
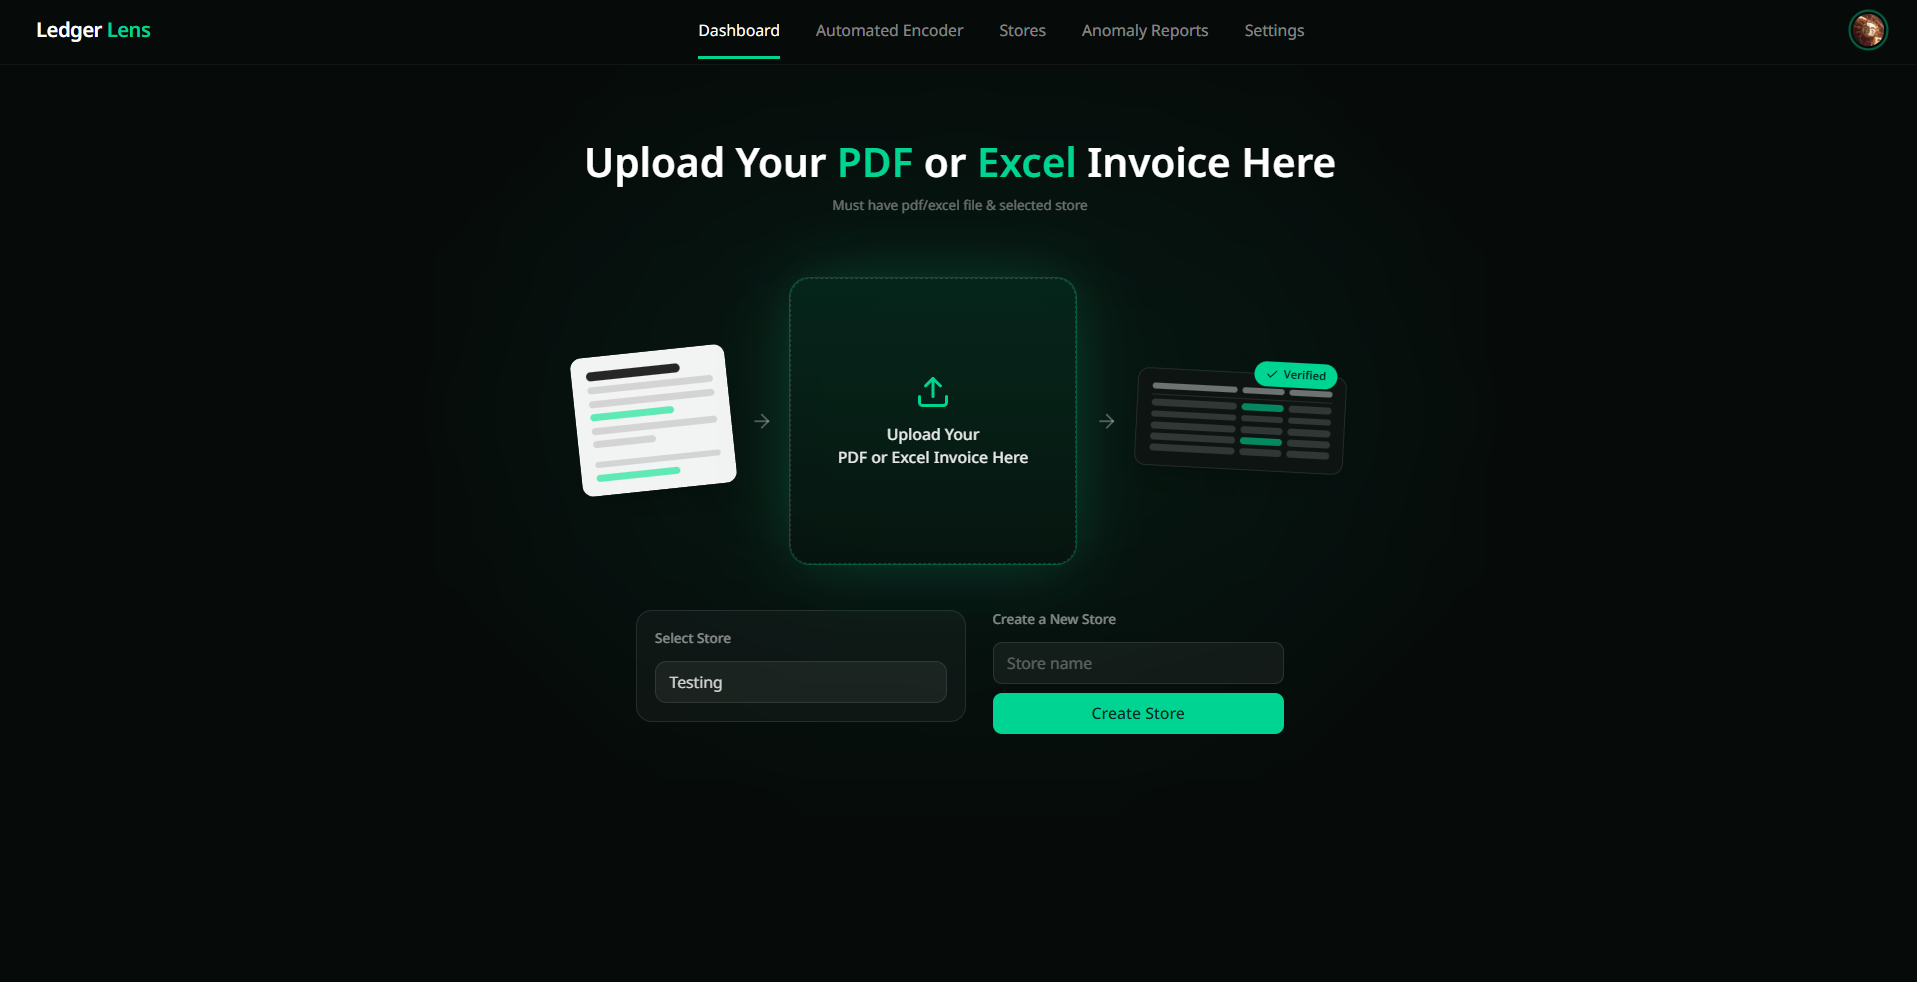
Dashboard
-
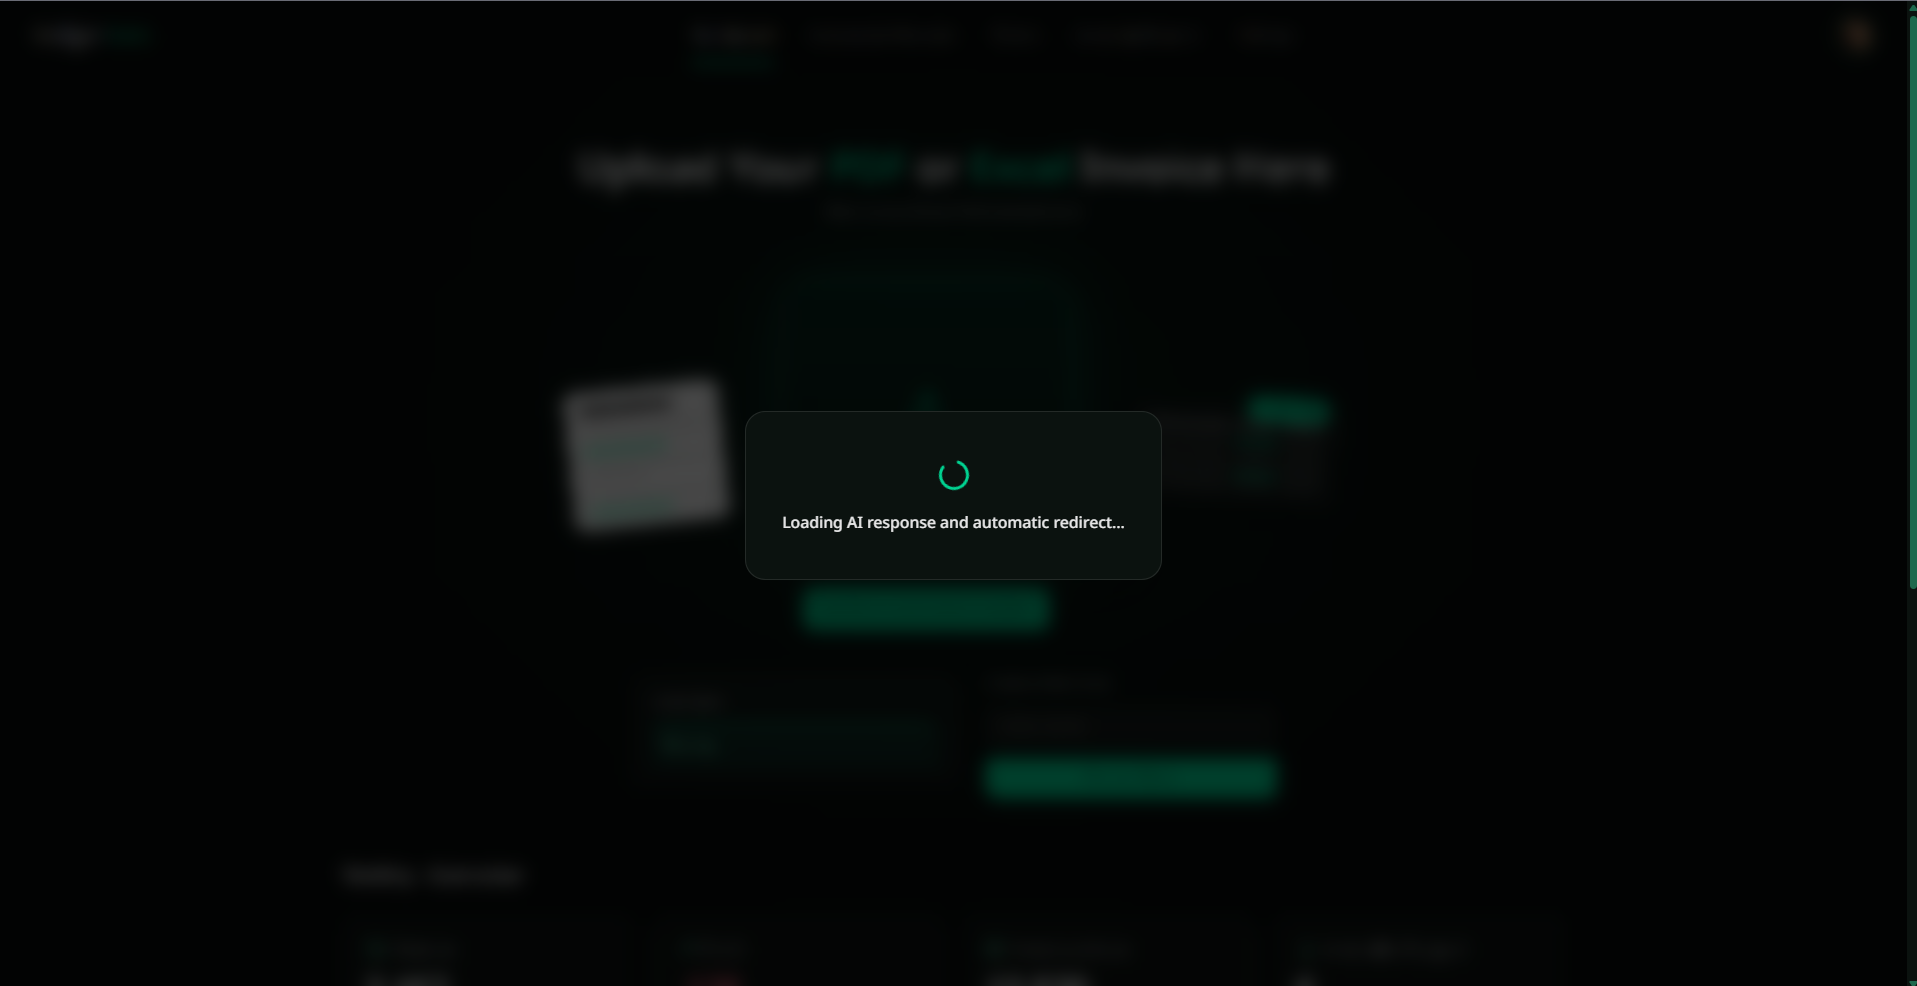
Loading UI
-
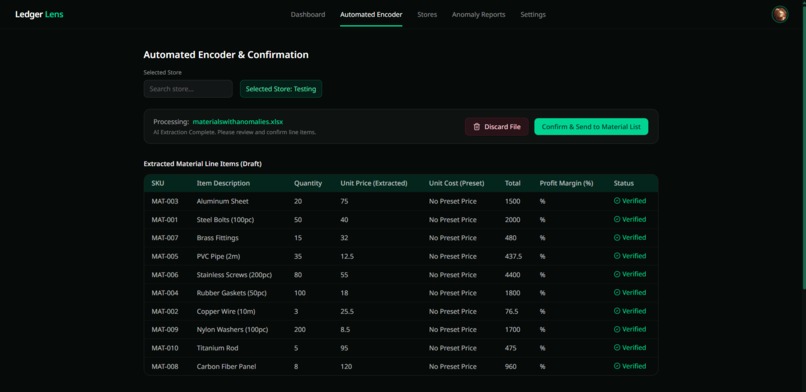
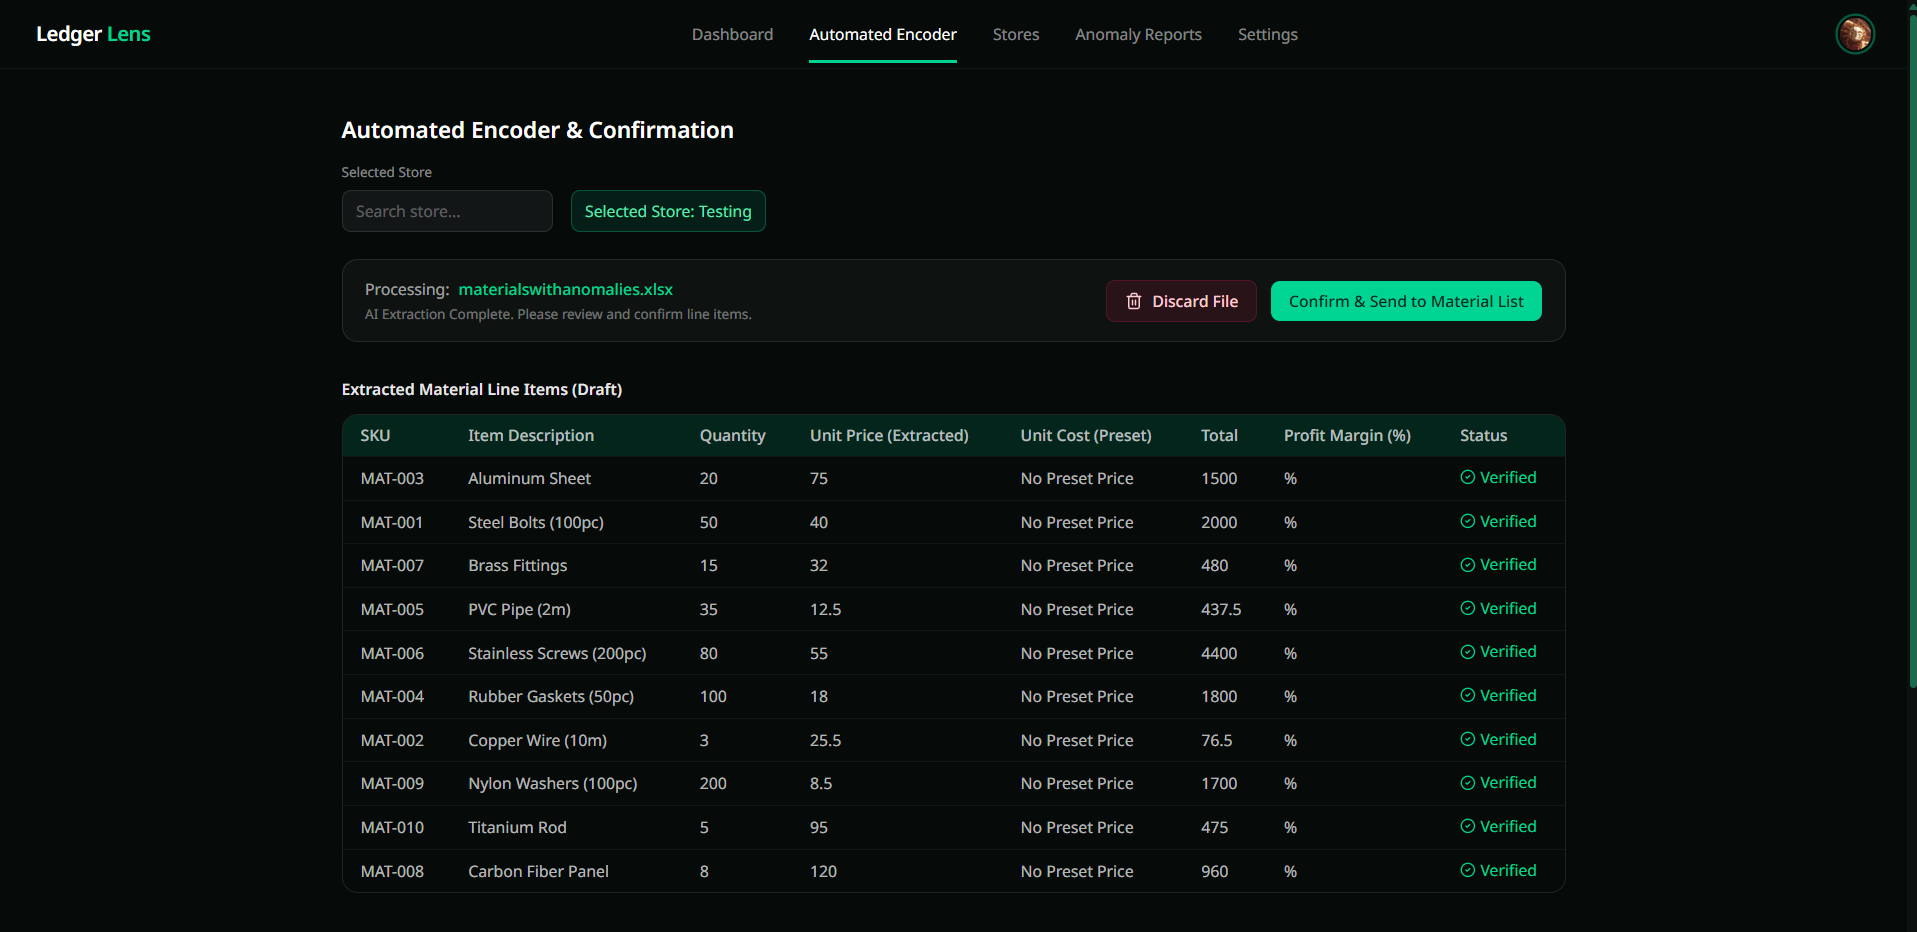
Materials Encoding
-
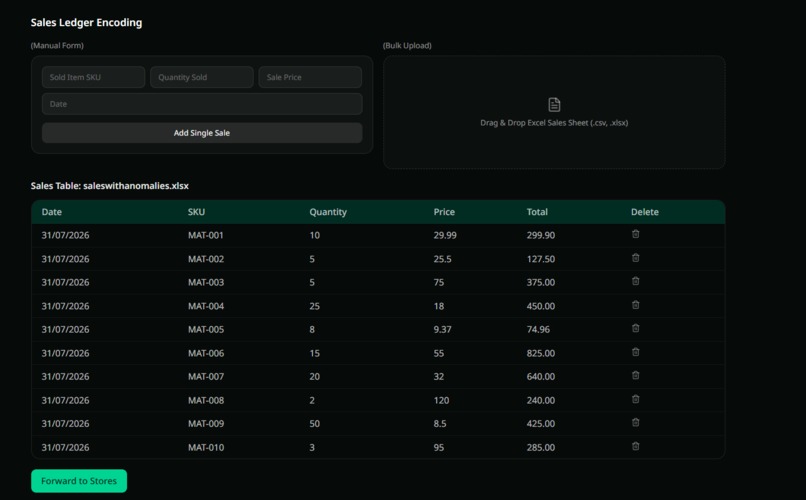
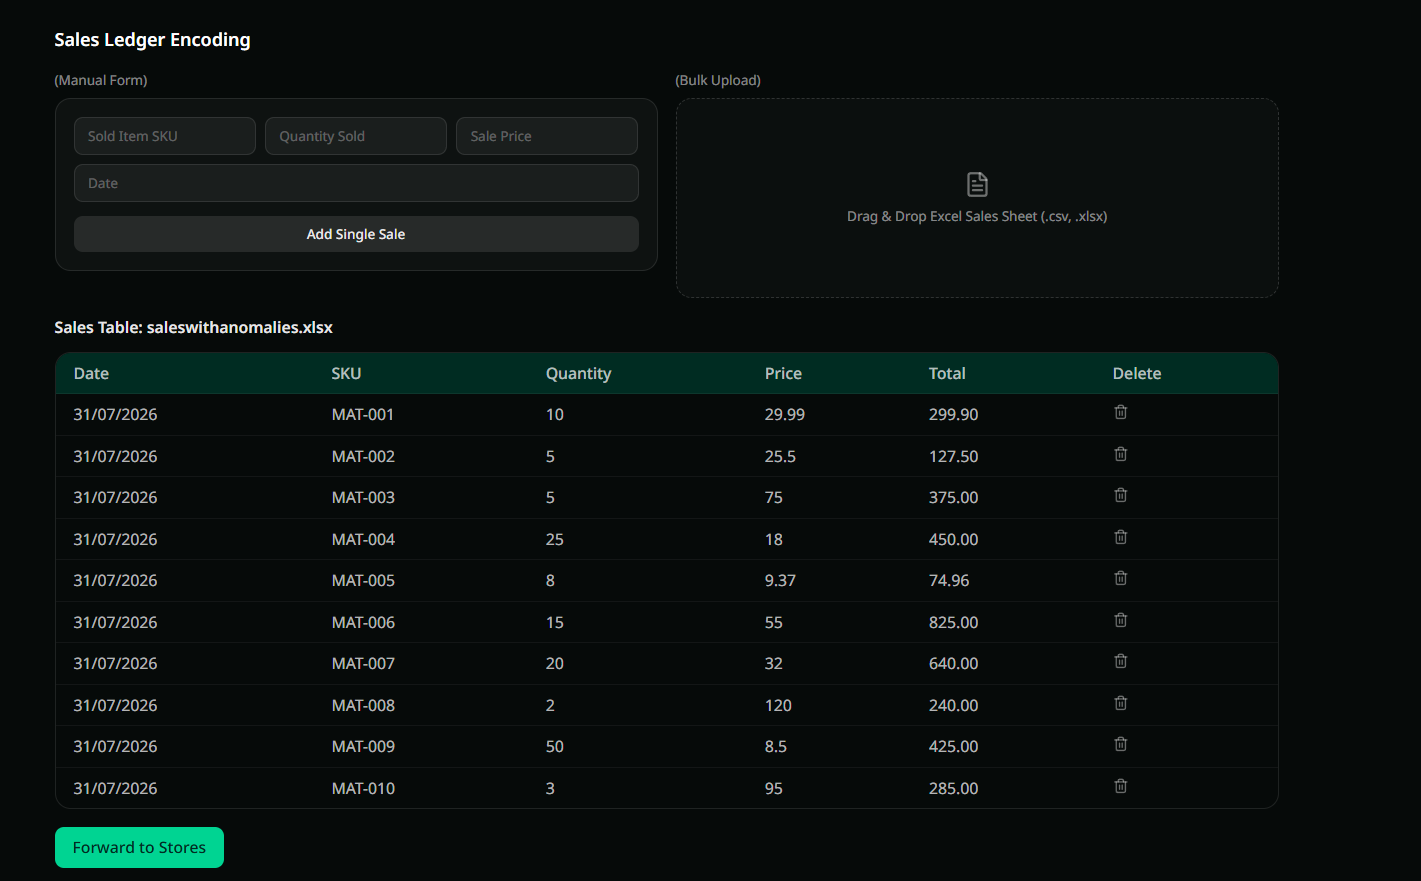
Sales Encoding
-
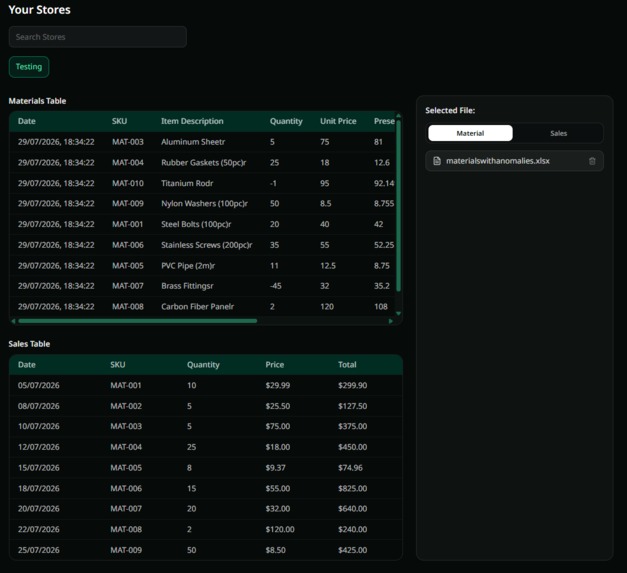
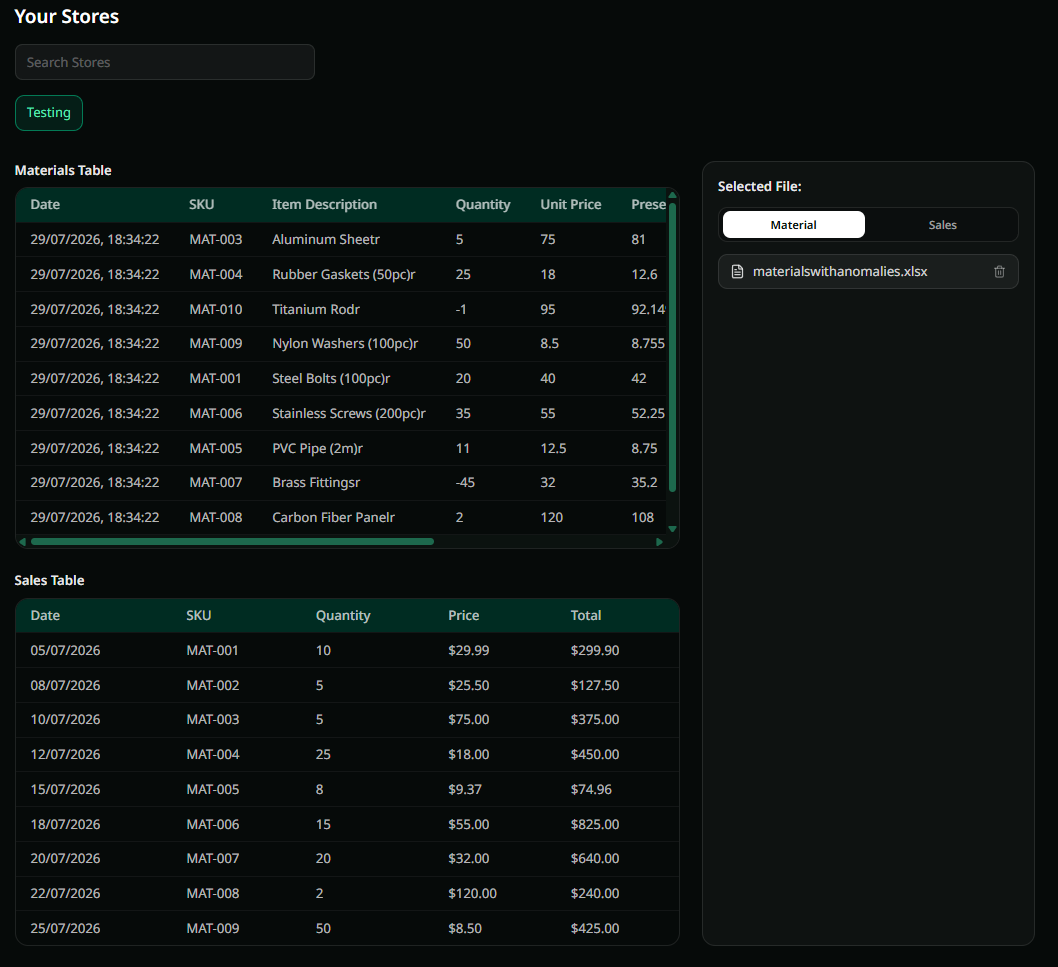
Stores Page
-
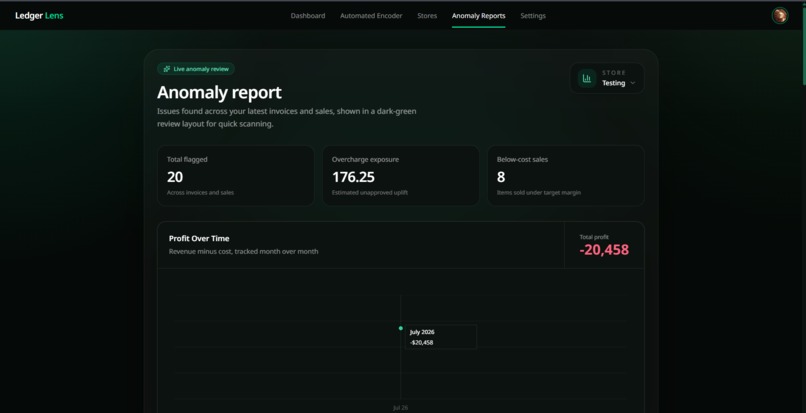
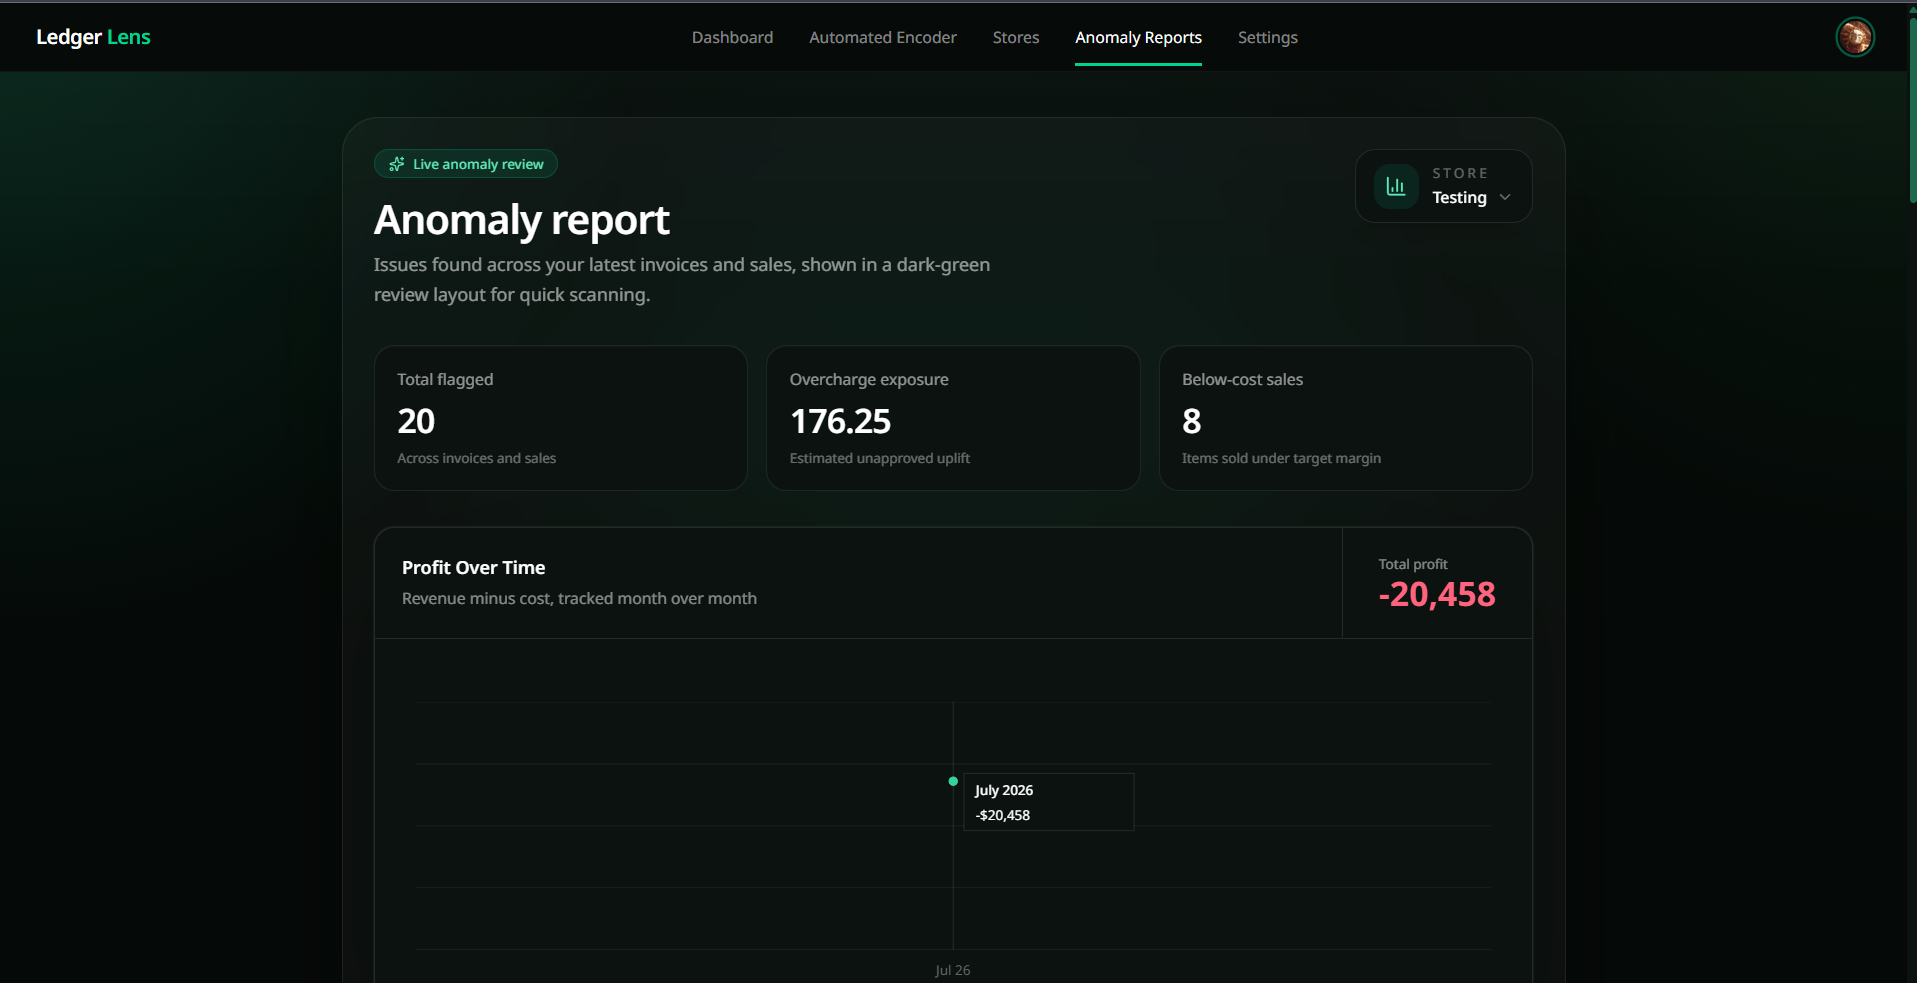
Anomaly Report: All - Top
-
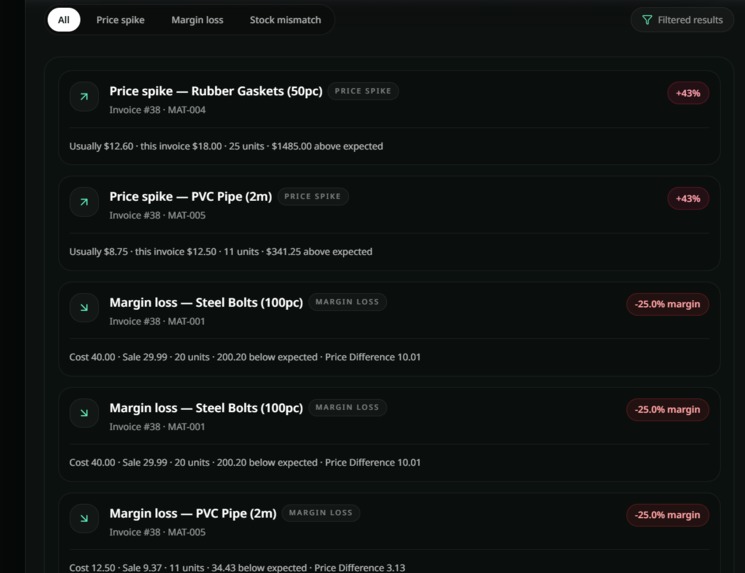
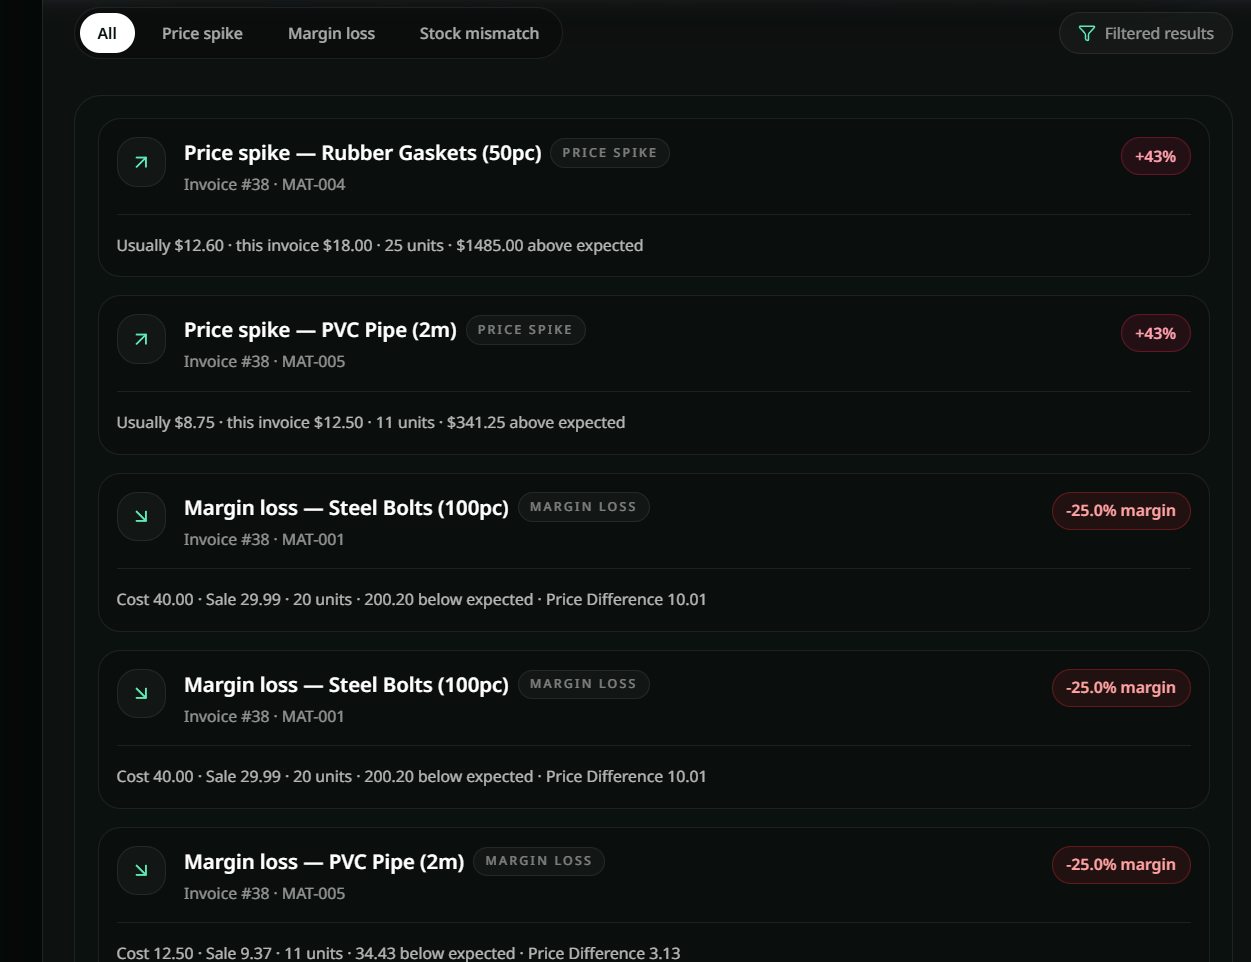
Anomaly Report: All - Bottom
-
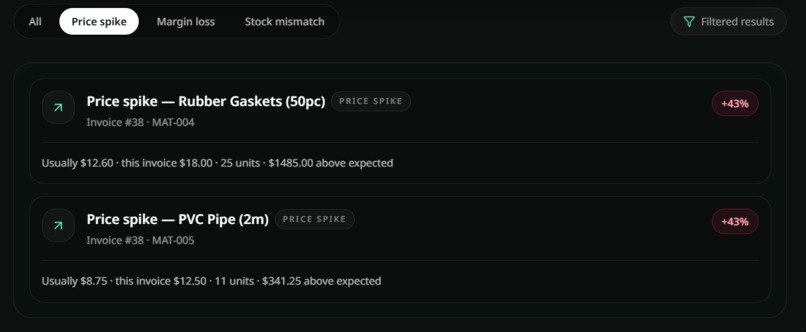
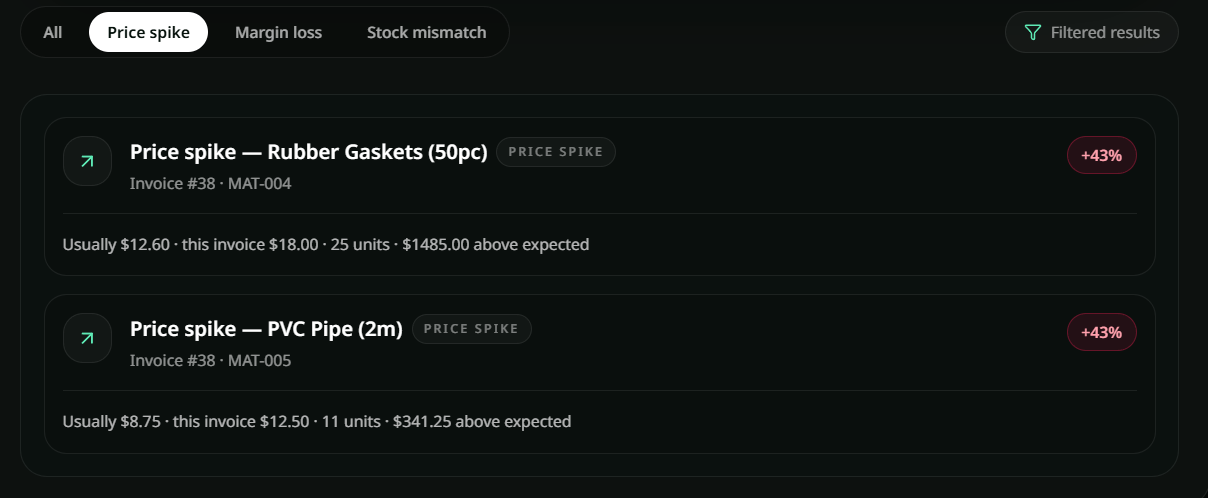
Anomaly Report: Price Spike
-
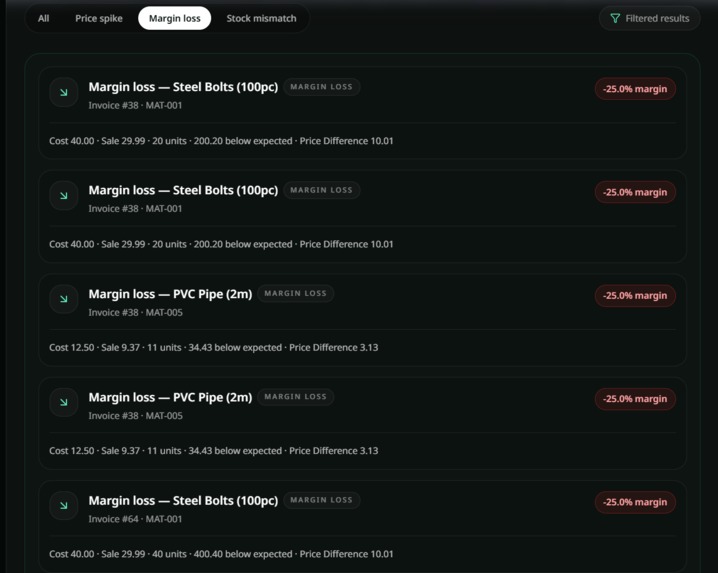
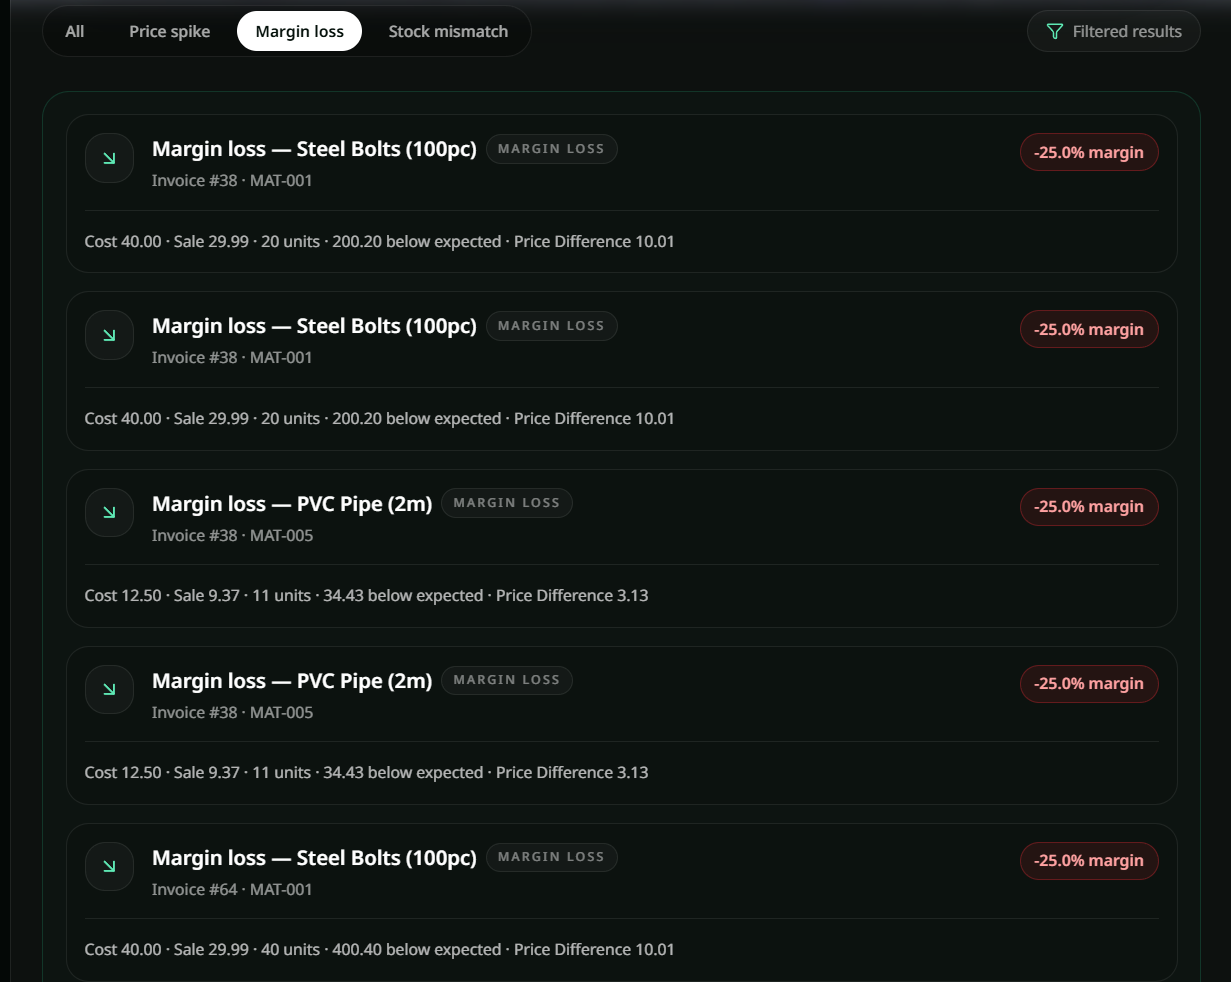
Anomaly Report: Margin Loss
-
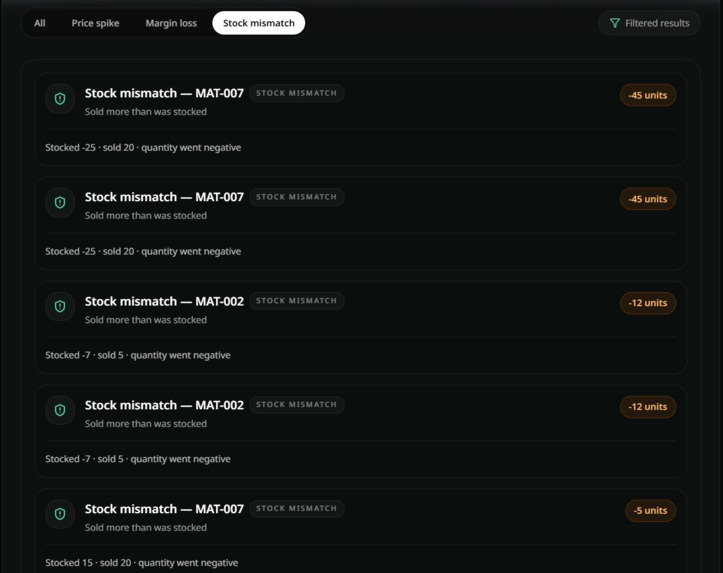
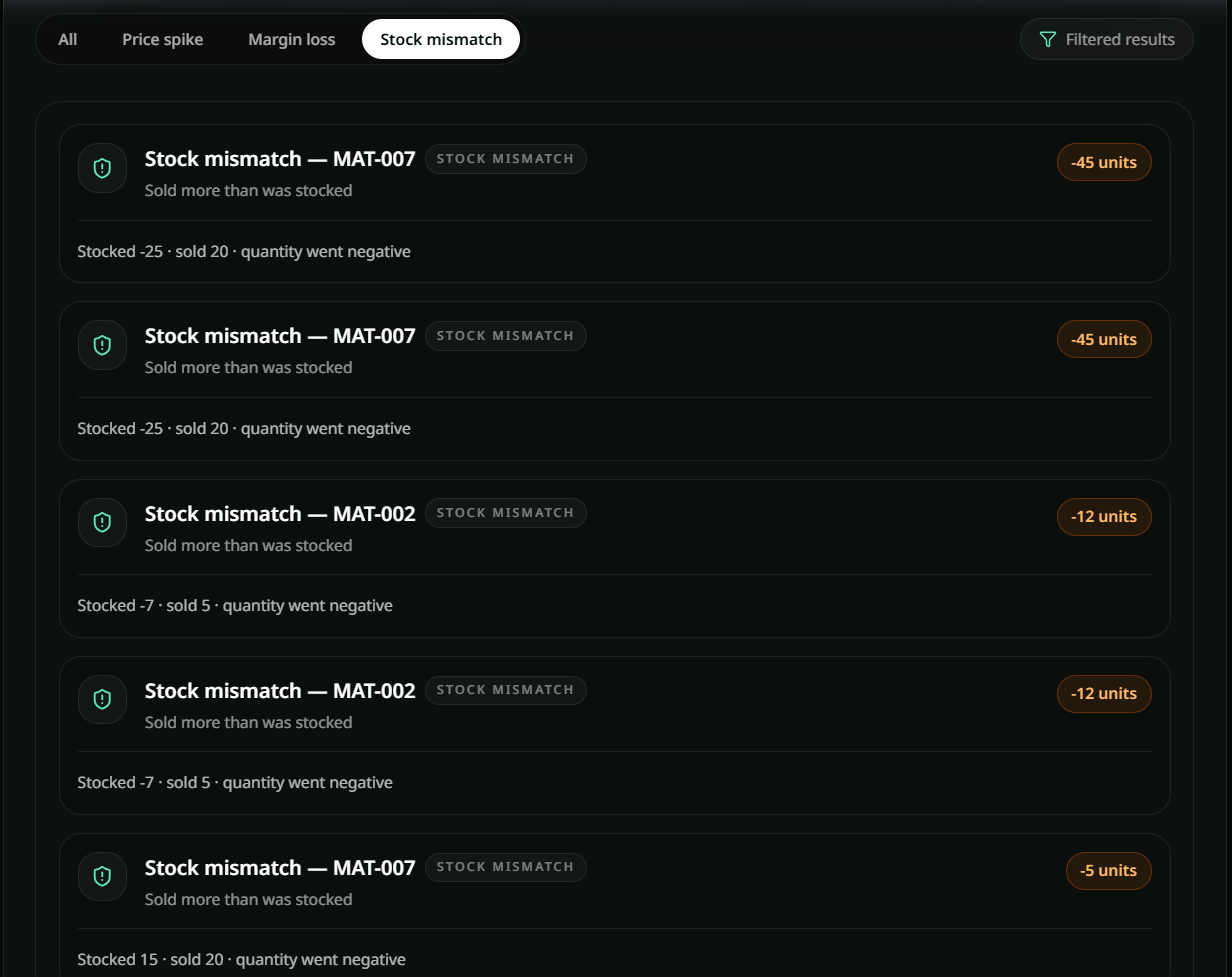
Anomaly Report: Stock Mismatch
-
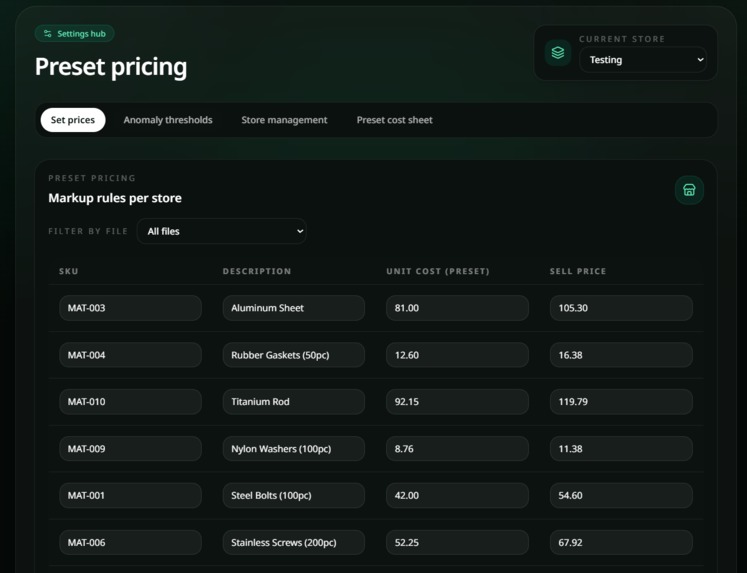
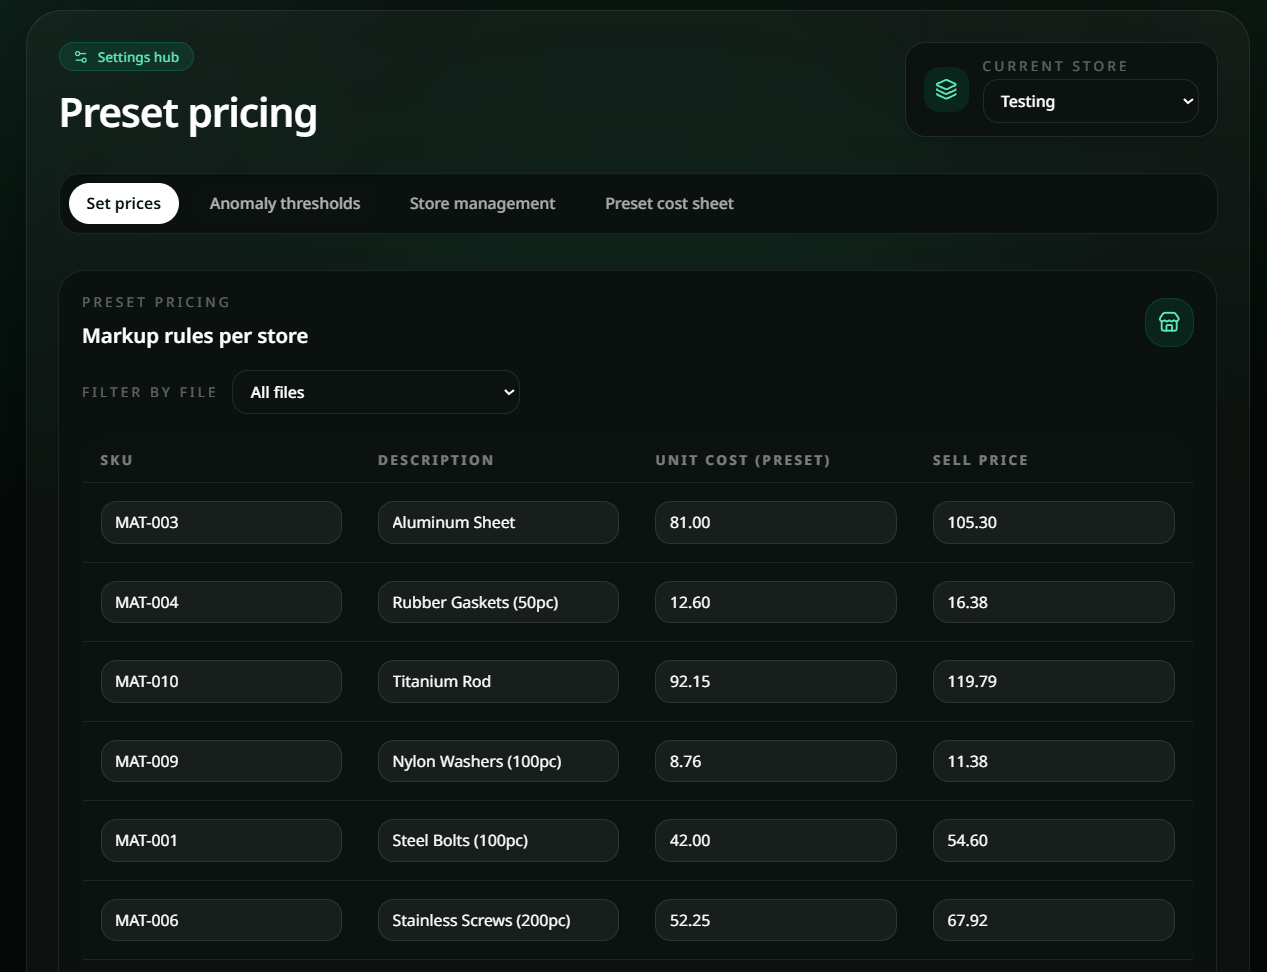
Settings: Preset Pricing
-
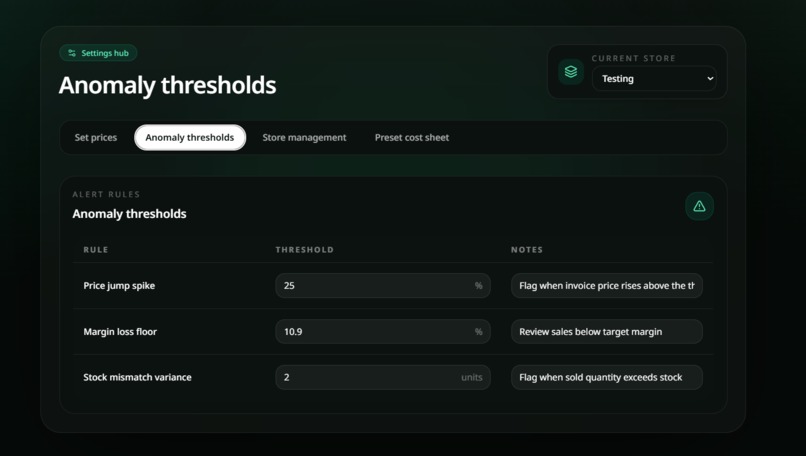
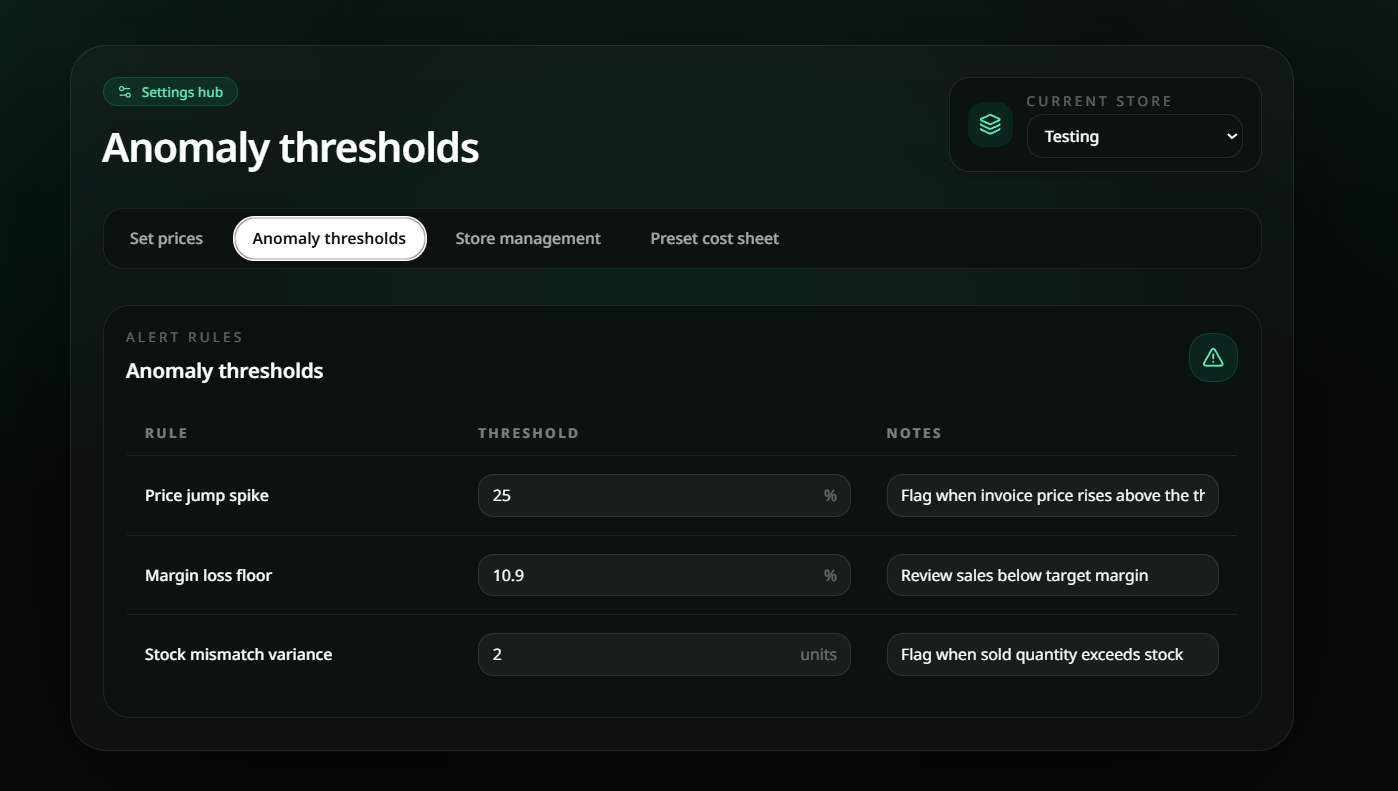
Settings: Anomaly Thresholds
-
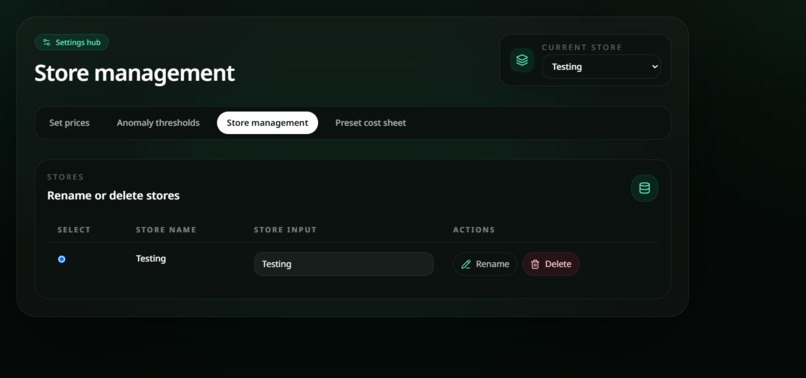
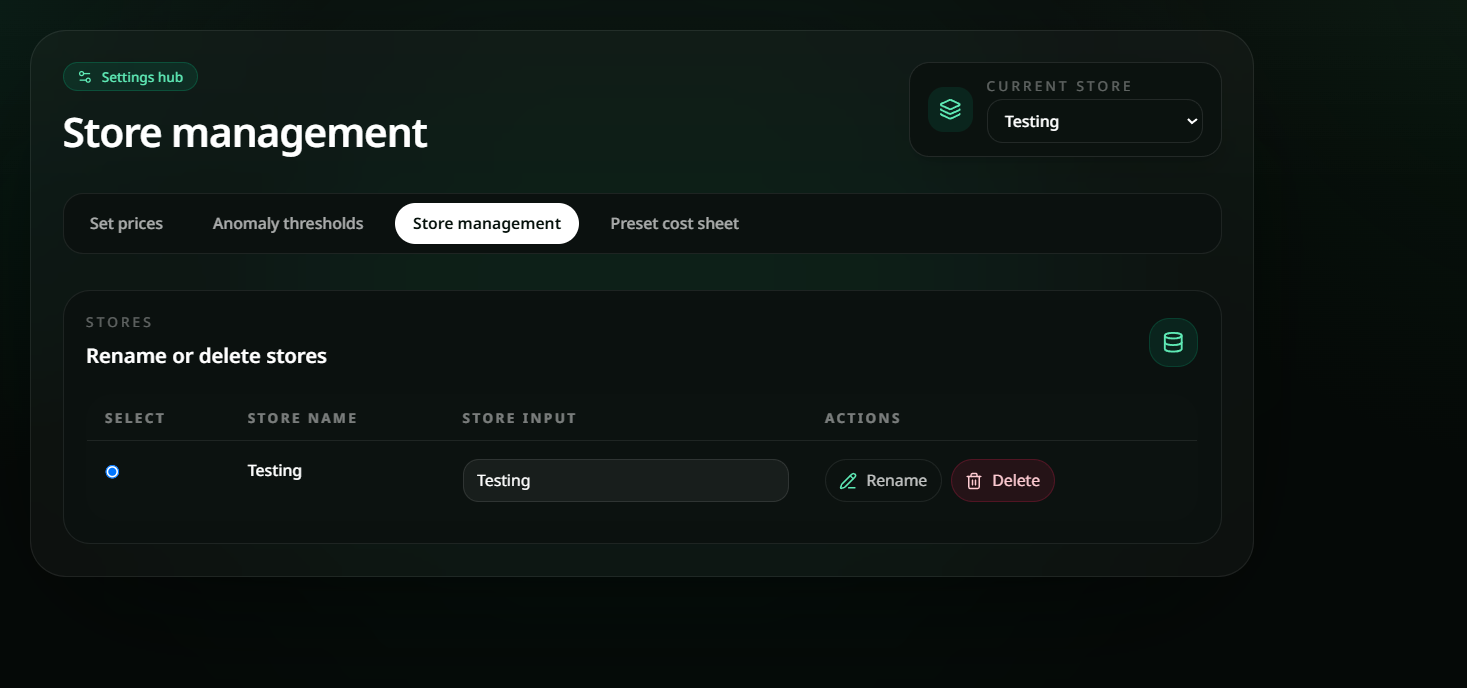
Settings: Store Management
-
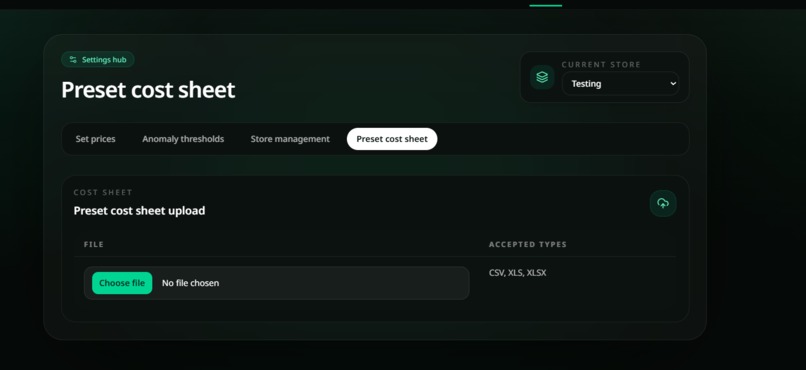
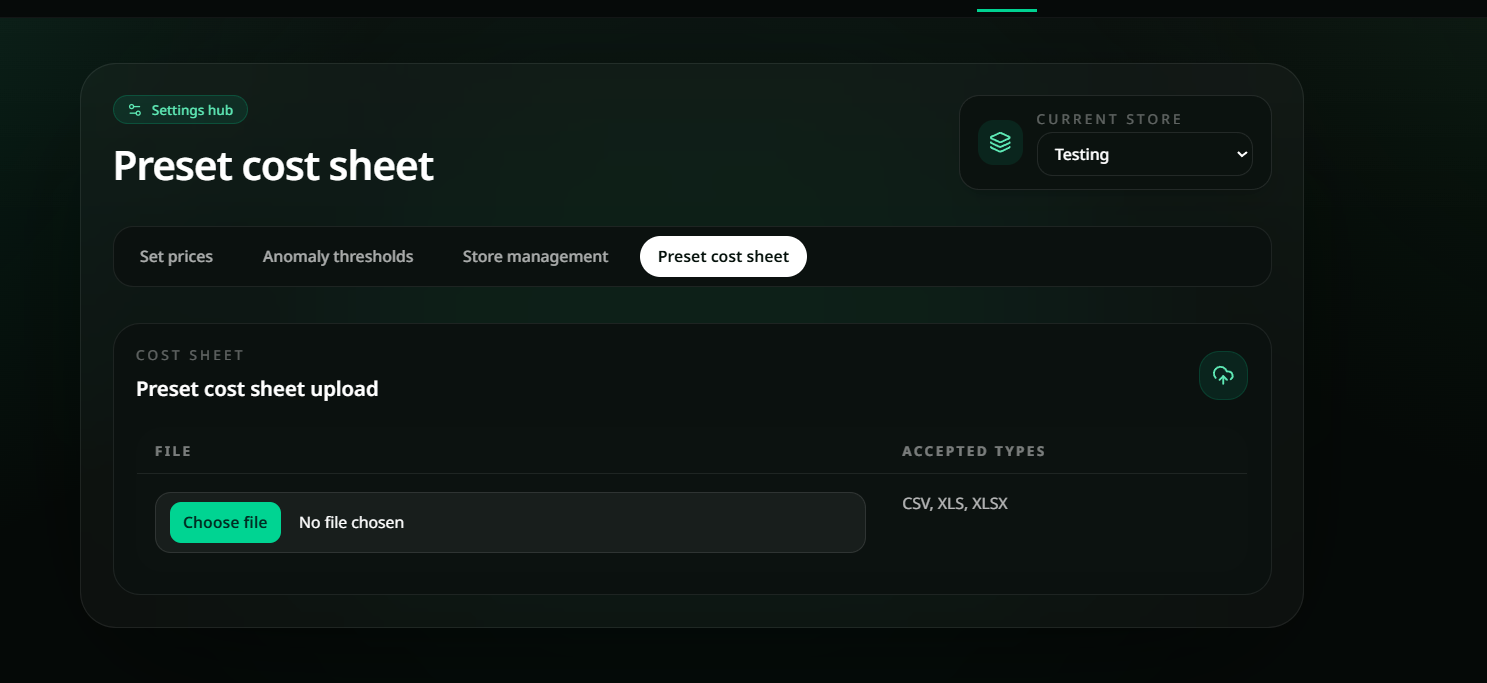
Settings: Preset Cost Sheet Upload
-
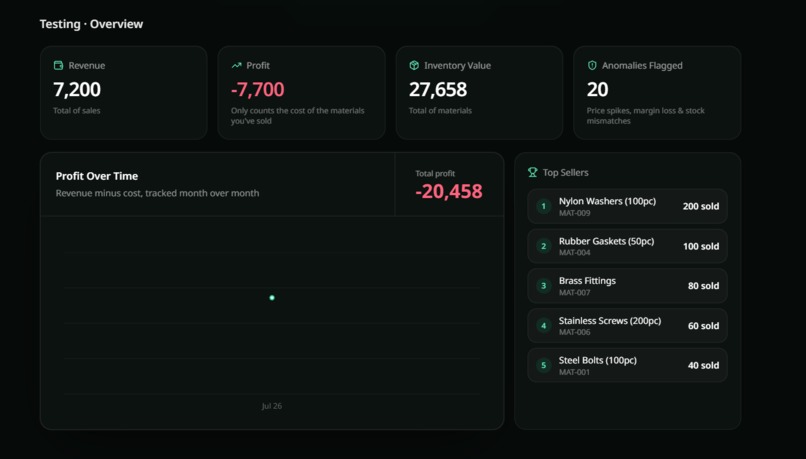
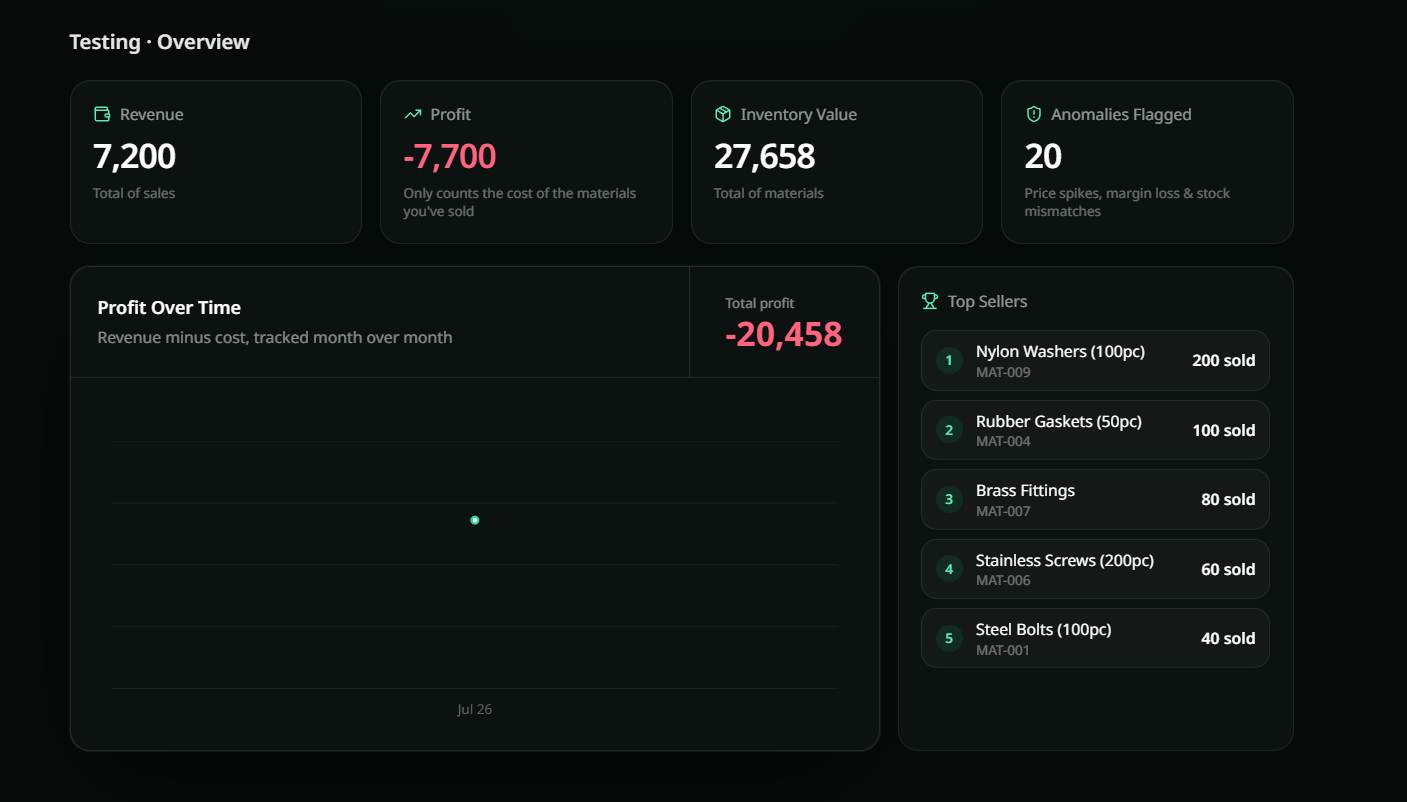
Dashboard: Store Overview
📺 Demo Video Quality Note
For Judges: If the YouTube video defaults to low resolution, please switch the playback quality to 1080p HD in the player settings ⚙️ to view the UI and data tables in full detail.
Inspiration
My main inspiration for this project was my mother's daily routine as a bookkeeper. Everyday, I watched her manually browse through dozens of online construction, shopfitting, and material project files on Southern Cross Commercial Projects. She had to meticulously extract billing information, cross-reference contract variations, and log expenses for high-profile retail fits, like Cotton On, Typo, Supre, from all around the globe. Watching her balance hundreds of items by jumping between endless tabs and rigid spreadsheets made me realize how ineffective and stressful it is. Manual bookkeeping causes a massive time drain, introduces a high risk of data entry errors, and delays real-time financial tracking. I built Ledger Lens to turn this chaotic, manual workflow into a streamlined, automated experience.
What it does
Ledger Lens is a specialized financial, bookkeping data entry website that eliminates the friction of manual retail bookkeeping by converting raw material and sales files into tangible financial intelligence.
Materials Processing: Encodes material expense files instantly, handling materials up to thousands of lines. Sales Processing: Processes high-volume transaction records across thousands of line items without lag or manual data entry. The sales automatically deduct its quantity from the Material that it's connected to.
Stores: Maps every single material cost and sales transaction to its specific physical retail store or project branch. Could be used as a subsection, or if it's a big business with dozens of stores they can track their profits without any store bleeding into the other, so they know which makes profit and which does not.
Analytics Dashboard: Provides a visual, real-time overview of business health through interactive charts and critical metrics. For a summary, it has 3 indicators: Total Revenue, Net Profit, and Current Inventory Value at a glance. In addition, it also displays a line chart showing Profit Over Time, which is anchored to the sale dates, and a counter for how many Anomalies are within the store, as well as the top 5 best sellers in the store.
Automated Anomaly Reports: Acts as an AI auditing layer to protect margins by categorizing and flagging operational errors in the following: Price Spikes: Pinpoints materials whose actual procurement cost exceeds the user's manual preset price. Margin Loss: Flags items that were sold to customers at a price lower than their original wholesale purchase cost. Stock Mismatch: Identifies inventory data integrity issues where a material's sales volume exceeds it's recorded stock.
Settings & Controls: Gives bookkeepers full administrative control over system thresholds and data structures, allowing them to do the following: Manual Price Overrides: Allows administrators to establish and tweak baseline preset prices manually. Custom Anomaly Thresholds: Features adjustable inputs for price spikes, margin losses, and stock mismatches to filter out minor data noise and prevent it from alerting all the time. Store Management: Provides a clean interface to rename, organize, or delete active store profiles. Automated Preset Price: Supports bulk CSV/Excel uploads of Preset Cost Sheets to instantly pair SKUs/Product Codes with predetermined baseline costs.
How we built it
The project was built using the modern PERN (PostgreSQL, Express, React, Node) stack, using TypeScript across the entire codebase to enforce end-to-end type safety. Authentication & User Management: Integrated Clerk to handle secure user authentication, I did this to isolate custom stores, settings, and thresholds to individual user profiles. Database & ORM: Hosted the relational database on Neon for easy and instant modifications if needed. I mapped the schema using Drizzle ORM, while the CRUD operations on the backend was primarily driven by raw sql queries. AI & Data Encoding Layer: Powered by Groq for ultra-low latency inference to process and tag unstructured data. The backend was structured using Node.js and Express to parse input files, run data validation scripts, and securely interact with the Groq API, while the interactive financial dashboards and graph visualizations were built entirely in React.
Challenges we ran into
Encoding: The primary bottleneck was encoding hundreds of sales and material line items at once. Sending large raw datasets to Groq consistently caused it to hit output token limits or fail to respond entirely because the payload was too high. To solve this, I revised the AI pipeline completely. Instead of forcing Groq to process every single line of data, I fed it only the data headers. Groq analyzes the schema and determines exactly where the data fields should be mapped by sending in column numbers. Once the mapping rules are decided by the AI, the Node.js backend handles the bulk data injection via map. This eliminated all token restrictions and dramatically accelerated encoding speeds. State Management: Because users can completely rename or delete stores, update anomaly thresholds, and upload entirely new preset cost sheets on the fly, keeping the relational data intact inside Neon was a challenge.
Accomplishments that we're proud of
The efficiency: At the end, Ledger Lens proved to have the speed and capability to encode thousands of lines at once. The structure successfully shifted from raw LLM extraction to infrastructure encoding. This is not only a victory in speed, but also a victory in lowering API costs. Since Groq is free there was no need to deal with that, but if I were to use another LLM, this method would save lots of money.
What we learned
Smart Architecture over AI: LLMs should not be treated as a data tool. They should only be used as "decision makers" while letting the code handle the data rows. It taught me how to truly design highly scalable, cost effective AI systems. Importance of UI & Control: Before making the settings page, I realized how incomplete the product is, and how even I would be hesitant to use it. Many software lack these proper tuning controls, and I realized being able to input your own thresholds was crucial to making the software feel complete.
What's next for Ledger Lens
Historical Predictive Budgeting: Ledger Lens eventually aims to integrate looking at history to decide the preset prices. Instead of a user having to put the preset price on their own, Ledger Lens adapts and learns the prices. Xero Integration: Because bookkeepers rely on Xero as their official general ledger, our platform will act as a data feeder. Using Groq to encode messy project files, catch margin anomalies, and then instantly stream pre-audited, clean financial data straight into Xero's endpoints with a single click. Alongside this, we plan to implement native .xlsx drag-and-drop file streaming and add predictive budgeting models to flag seasonal material price spikes before they damage a retail brand's bottom line.


Log in or sign up for Devpost to join the conversation.