
Leavitt
Leave it to Leavitt.
At a glance
- Read-only by construction. The FSM has no write edge. Safe to leave pointed at production.
- Never confident-wrong. Under chaos, the bare agent drifts to confident wrong answers. Leavitt degrades or declines. Comparison in
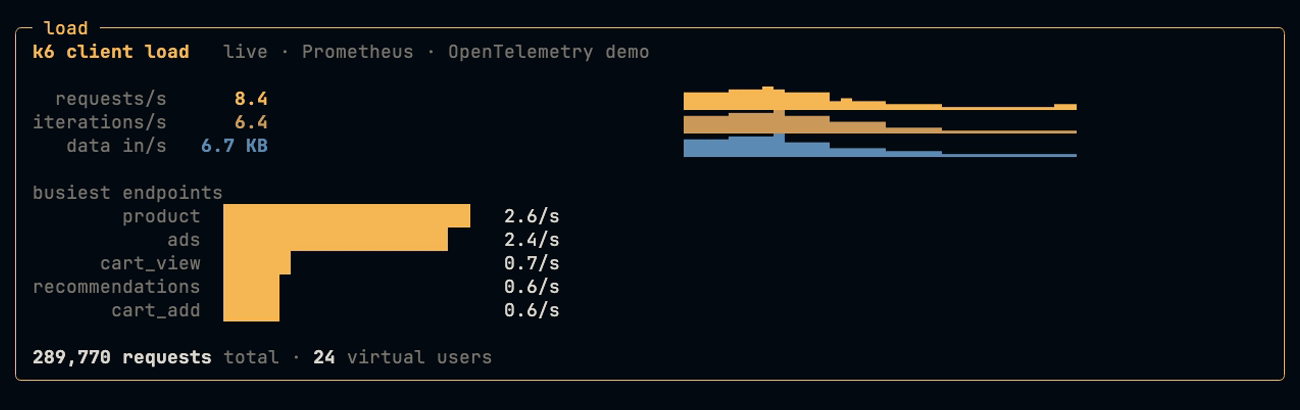
demo/results_table.md. - Diagnoses from real telemetry. Metrics (Prometheus), logs (Loki), client load (k6), feature flags, all through MCP. The cascade detail in the report exists only in the live data, not the prompt.
- Ships as a Nemotron agent on Crusoe. Driven headless by Hermes; LLM calls route through TrueFoundry's AI Gateway for provider failover; evaluated on Microsoft Research's AIOpsLab.
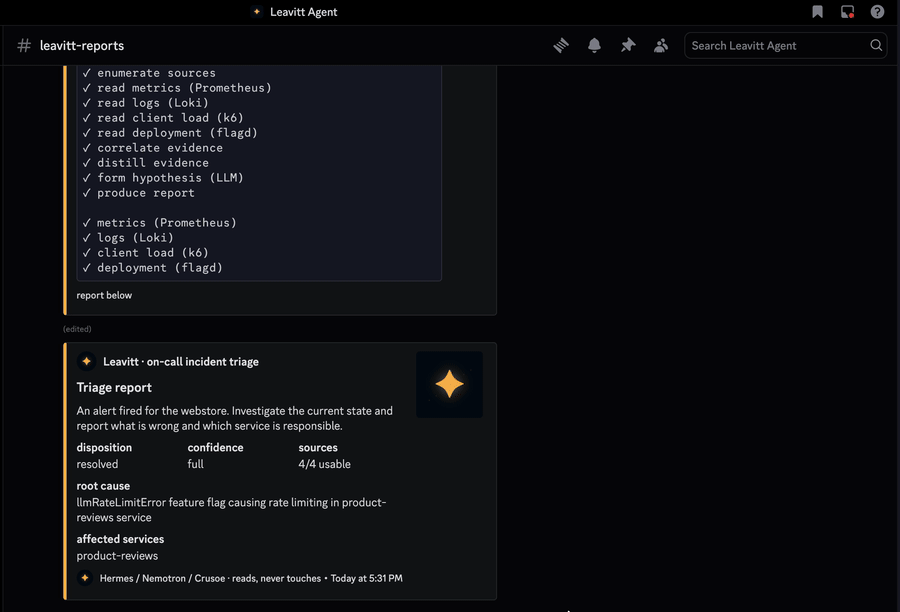
- Runs unattended. Cron, alert-webhook, and Discord delivery. It wakes, reads, files a report.
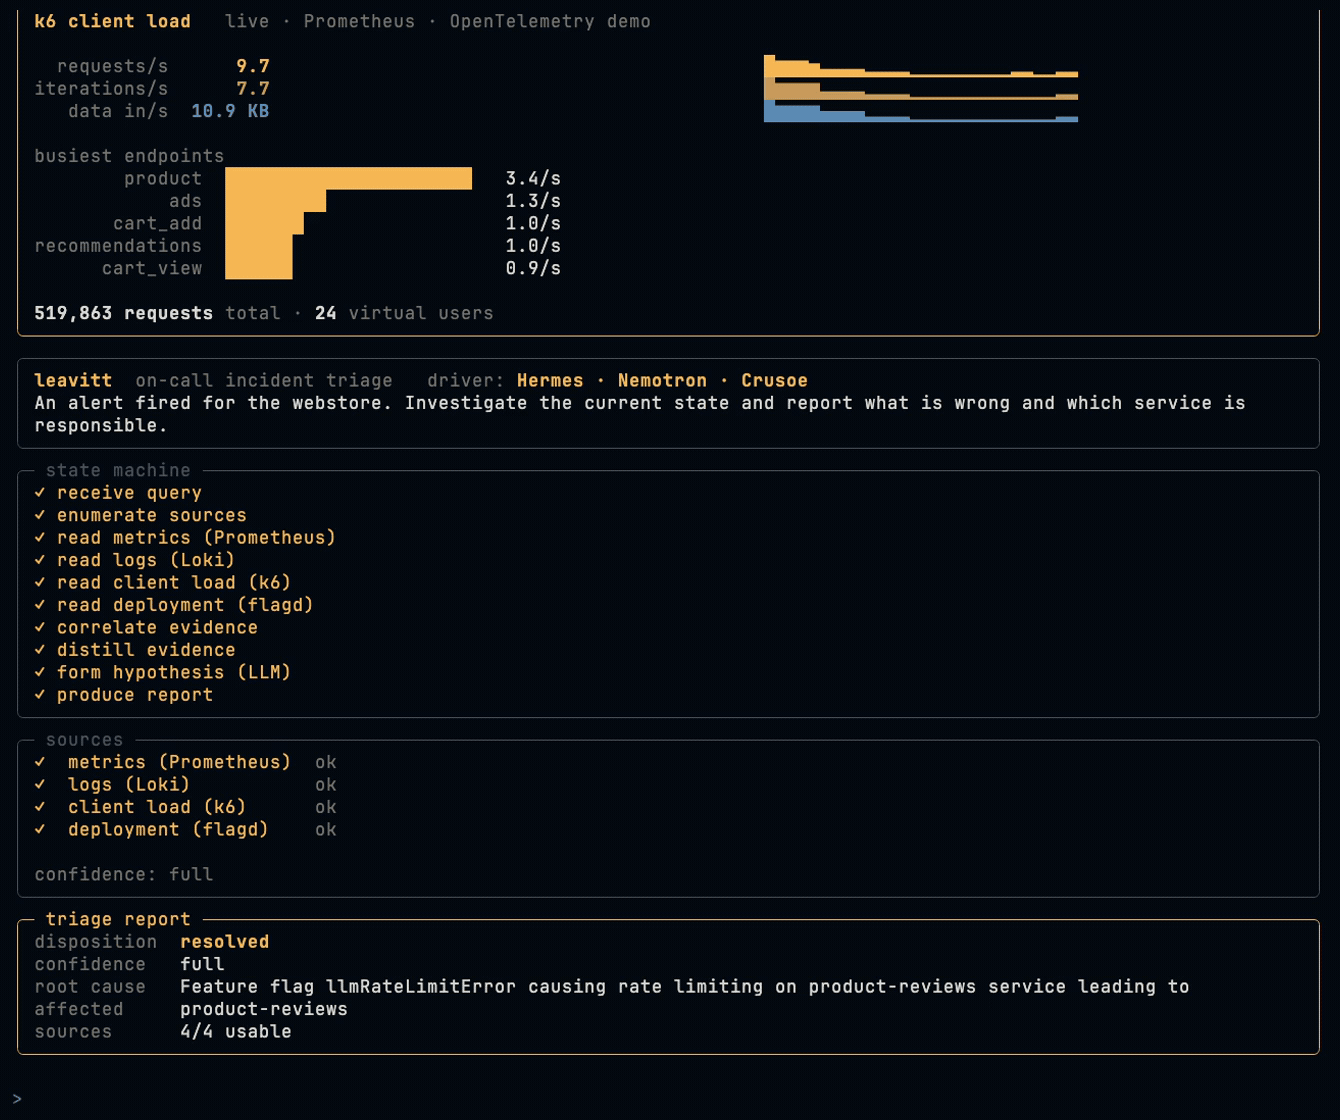
Leavitt diagnoses production incidents by reading your observability stack the way a careful on-call engineer would, one source at a time, and reporting the root cause with a confidence it can actually defend. It is built on Theodosia, a state-machine runtime that keeps the reasoning on rails, so when the evidence is thin it says so instead of inventing an answer.
Inspiration
When something breaks in production, triage is a scramble across half a dozen tools: error rates in Grafana, exceptions in the logs, failing requests in the load tests, a feature flag someone flipped an hour ago. An on-call engineer stitches it together at 3am. This reading and correlating is exactly what an agent should be good at.
Two things stop you from trusting an agent with it. An agent that can act can make the outage worse while you watch. And, more quietly, an LLM under pressure invents a confident, plausible, wrong root cause and sends you down the wrong path for an hour. The second failure is the one that actually burns on-call teams, because it looks like an answer.
We wanted an agent that does the reading well, finds the real cause fast, and tells the truth about how sure it is. That meant building the discipline into the runtime instead of asking the model to be careful.
What it does
You give Leavitt an incident question. It reads four observability sources through MCP servers, server-side error rate (Prometheus), warning and error logs (Loki), client-side failure rate (k6 load tests), and current feature-flag state, correlates them, and reports what broke: the root cause, the affected services, and the cascade between them. The interesting cases are the ones a human would miss, an error that only shows up in the logs while the HTTP status stays 200, or a flag flipped upstream of the symptom.
The conclusion is bounded by the evidence, not the model's confidence. resolved only with full coverage and a cause grounded in the signal; degraded when a source was lost mid-investigation; inconclusive when nothing usable came back. It would rather hand you a narrowed-down "I could not confirm this" than a clean-looking guess.
It diagnoses; it does not act, which is what makes it safe to put on a schedule and leave pointed at production: it wakes, reads, and writes a report to an audit trail, and there is nothing it can do to the systems it watches.
It runs as a Hermes agent on NVIDIA Nemotron via Crusoe Cloud managed inference: Hermes drives the Leavitt MCP and Nemotron walks the workflow to the report.
How we built it
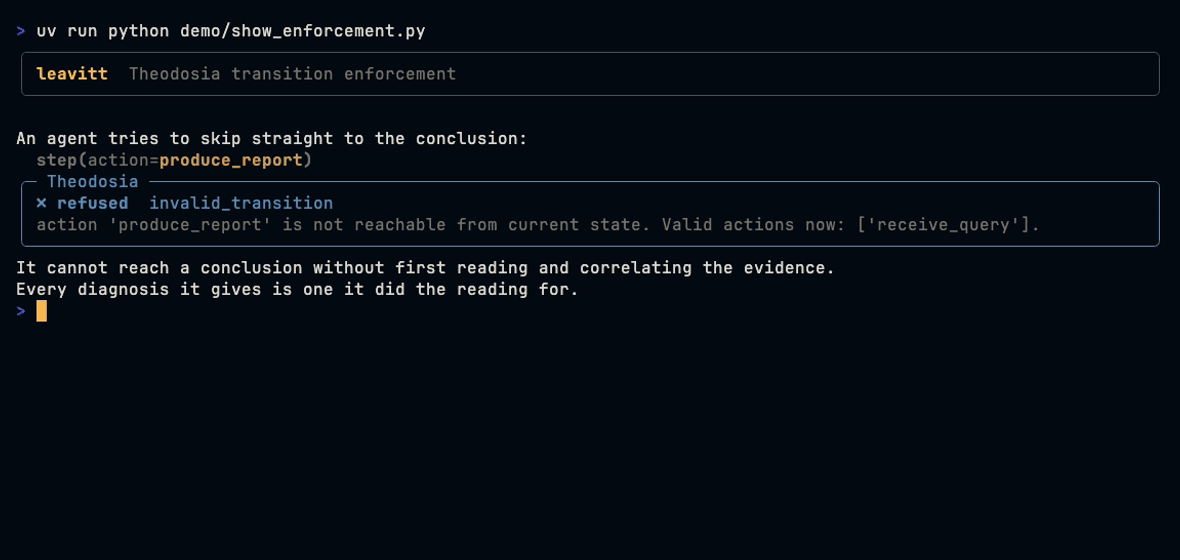
Leavitt is a Burr state machine mounted as an MCP server by Theodosia. The driving model calls one step at a time, and Theodosia validates every transition against the graph, so the agent cannot skip the correlation step to jump to a conclusion. The diagnosis always rests on evidence it actually gathered.
  receive_query
      |
  enumerate_sources
      |
      v
  +-------------------------------------------------------------+
  |  read four sources, one validated step each:                |
  |    query_grafana_metrics      server error rate (Prometheus)|
  |    query_grafana_logs         warning + error logs (Loki)   |
  |    query_client_load          client failure rate (k6)      |
  |    query_deployment_context   feature-flag state            |
  +-------------------------------------------------------------+
      |
      v
  correlate_evidence ---- all sources failed ----> retry the reads
      |
      | otherwise
      v
  distill_evidence  ->  form_hypothesis  ->  produce_report  [terminal]
The flow: receive the question, enumerate sources, read the four sources, correlate the evidence (with a retry loop if every source is down), distill it to a high-signal digest, form a hypothesis, and produce the report.
- Substrate: the OpenTelemetry Demo (15+ instrumented microservices) with
flagdfor chaos injection. We rewrote the demo's Python/Locust load generator in k6 so the stack is Grafana-native end to end, and wired k6's client-side metrics back as a Leavitt source. We added Loki so logs are queryable throughmcp-grafana, which does not read the demo's default OpenSearch. - Sources as MCP upstreams: each query runs inside an action through
theodosia.call_upstream, so every read is a recorded ledger entry and failures are classifiedok/error/malformedbefore they reach correlation. One bad source cannot poison the diagnosis. - Two-tier reasoning: a deterministic
distill_evidencestep reduces raw Prometheus matrices and log dumps to a high-signal digest before the reasoning model sees it, so the model spends its attention on the diagnosis, not on parsing telemetry.
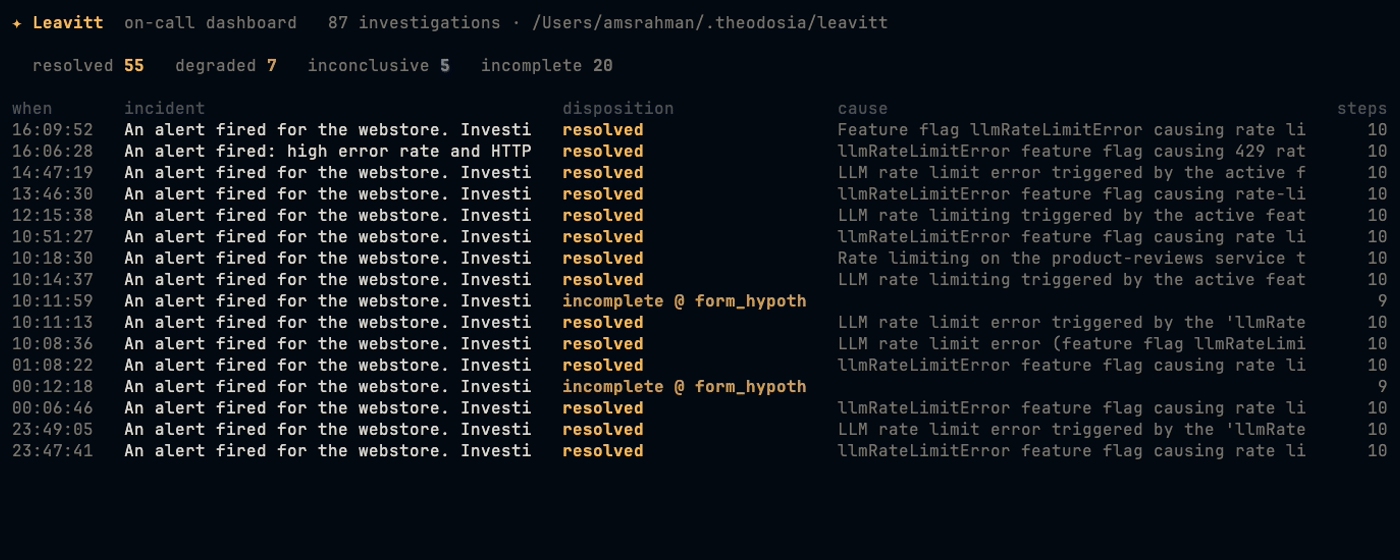
We benchmarked it against chaos: every flagd scenario under clean, single-source-down, and multi-failure conditions, comparing Leavitt to the same model with the same data and the same raw tools but no Theodosia layer. Under failure the bare agent drifts toward confident wrong answers; Leavitt degrades or declines and stays correct about what it does not know.
Because Theodosia exposes Leavitt as a standard MCP server, any agent can drive it with no custom glue. We ran it end to end as a Hermes agent (NousResearch) on Nemotron via Crusoe: Nemotron drove the full workflow to the correct cause, and the cascade detail it returned exists only in the live telemetry, not the prompt, so it genuinely read its way there. Leavitt's own model calls route through TrueFoundry's AI Gateway with one env switch, so provider failover and retries happen at the gateway.
On call. Leavitt is headless and runs unattended. A Hermes cron schedule fires the investigation on an interval; it wakes, reads, and files a report you can wake up to. Because it only ever reads, you can point it at production and forget it is there.
Challenges we ran into
- RunPod cannot run Docker. We tried to offload the heavy substrate to a RunPod pod and found its pods are unprivileged containers with no Docker daemon, so
docker-composecannot run there. We verified this by probing capabilities over SSH, then moved the substrate local. - mcp-grafana speaks Loki, not OpenSearch. The demo ships logs to OpenSearch, which
mcp-grafanahas no tool for. We added Loki and pointed the collector at it so the log source was real. - Kimi K2.6 is a reasoning model. Output splits into reasoning and content; a small token budget gets consumed by reasoning and returns empty content. Raw telemetry made it worse. The
distill_evidencestep and a larger budget fixed it. - The driver sometimes stopped a step early. Driven headless, the model would occasionally form a hypothesis and answer without running the final report step. We made the terminal step explicit in the system prompt and surfaced the finding the moment the hypothesis lands, so a conclusion always shows.
Accomplishments that we're proud of
Everything runs against real infrastructure with real chaos. No mocked metrics; the results come from real runs against the OpenTelemetry Demo with real flagd failures.
What we are proudest of is the diagnosis holding up when the telemetry does not. Kill a source mid-investigation and Leavitt finishes from what remains, names the cause, and marks the report degraded with a recovery note rather than pretending it had full coverage. Feed it garbage and it declines to conclude. The comparison against the no-Theodosia baseline is in demo/results_table.md.
The architecture turns the dangerous failure mode, a confident wrong conclusion, into a safe one: a report marked degraded or inconclusive, with the full read trail attached.
What we learned
Theodosia guarantees the agent stays inside the graph and never reaches an invalid state. It does not guarantee a weak model makes progress; a confused model can stall. But a stall leaves an incomplete trace you can alarm on, which is a safe failure, where a confident wrong answer is not. The trade is liveness for trustworthiness, and for an unattended triage worker that is the right trade. The guarantee is also only as good as the graph: Theodosia enforces adherence, the graph author owns correctness.
What's next for Leavitt
The same agent that reads your dashboards can read another agent's. Point Leavitt at a Hermes/Nemotron fleet's telemetry and it becomes an on-call diagnostician for the agents themselves. Scheduled runs already work through Hermes cron; next is firing on an alert webhook instead of on a timer, and widening what it can read: traces through the Jaeger datasource, and latency queries for the cache-style failures that never raise an error rate.
Built on Theodosia.
Built With
- burr
- fastmcp
- grafana
- k6
- prometheus
- theodosia


Log in or sign up for Devpost to join the conversation.