-
CivicWatch Dashboard
-
Overview and Model Checks
-
Comparisons
-
Control Chart
-
Investigation Logs
-
Methods
Inspiration
CivicWatch was developed by the Lean Leaders team for Cornell University's SYSEN 5300 Six Sigma Hackathon, addressing the Urban Systems and Civil Liberties challenge.
We wanted to explore how statistical process control could help community organizations better understand patterns in observed traffic enforcement activity.
Raw enforcement counts alone can be misleading. For example, an increase in traffic stops may simply reflect an increase in traffic volume rather than a meaningful change in enforcement behavior. Our goal was to develop a tool that could distinguish ordinary statistical variation from unusual enforcement patterns that warrant further review.
We also wanted to demonstrate how Six Sigma principles, traditionally associated with manufacturing and process improvement, could be applied to complex community systems.
What it does
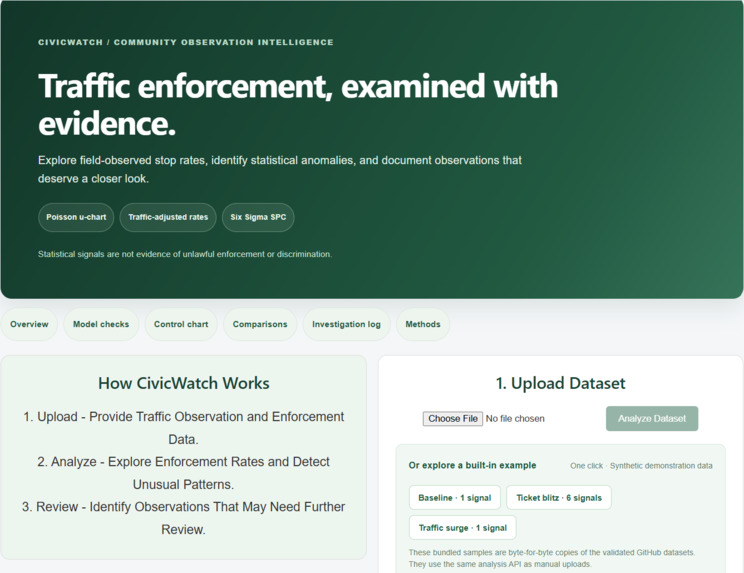
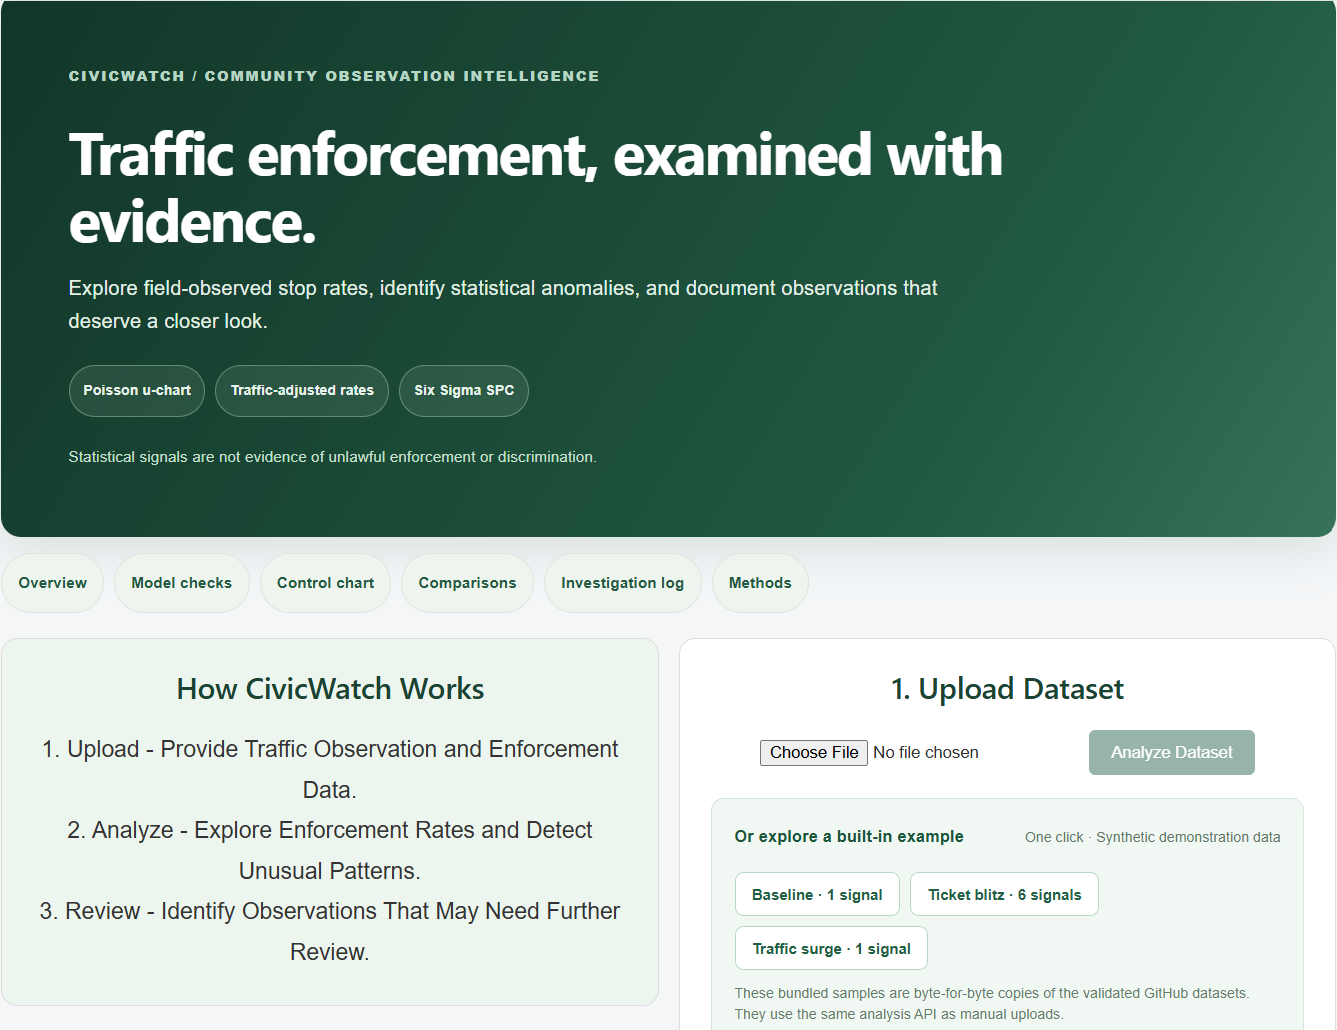
CivicWatch is an interactive, web-based statistical process control dashboard designed to help community organizations and field coordinators analyze traffic enforcement observations.
Users can upload their own CSV containing vehicle counts, observed enforcement stops, dates, geographic zones, and observation shifts. Alternatively, they can explore three built-in demonstration scenarios with a single click.
The dashboard:
- Calculates observed enforcement stops per 1,000 vehicles, adjusting for differences in traffic volume.
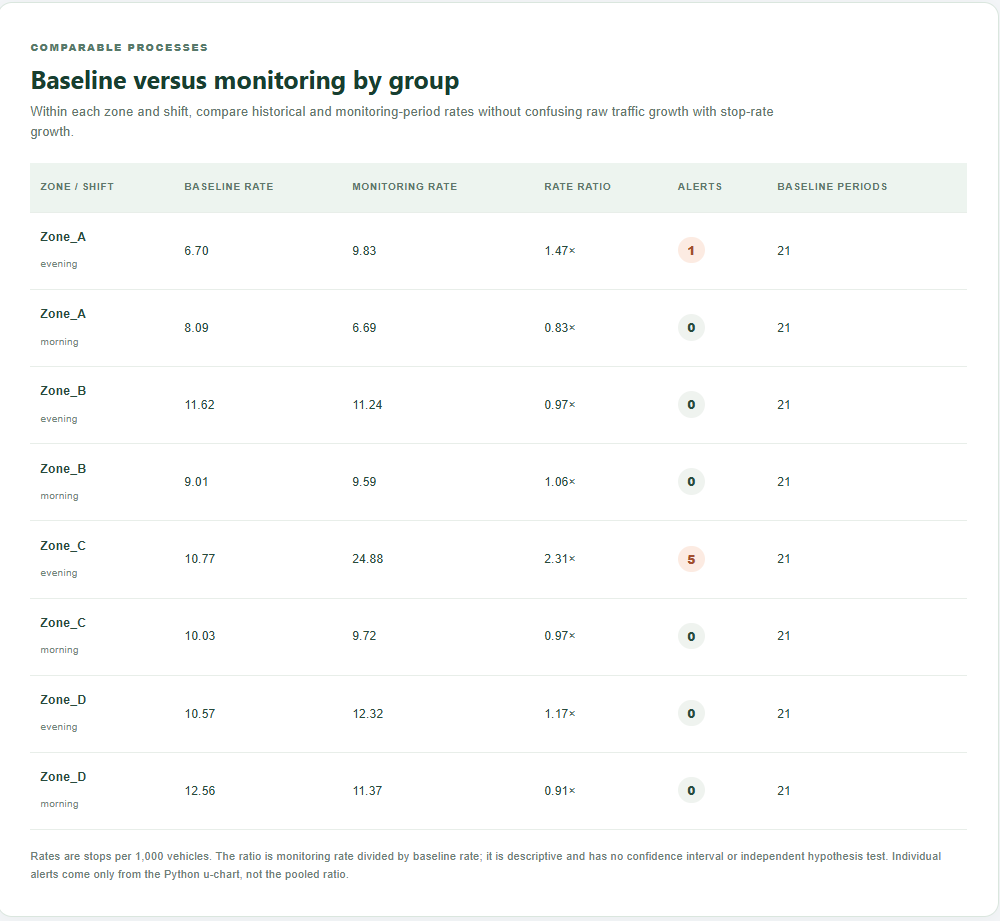
- Establishes historical statistical baselines for individual zones and shifts.
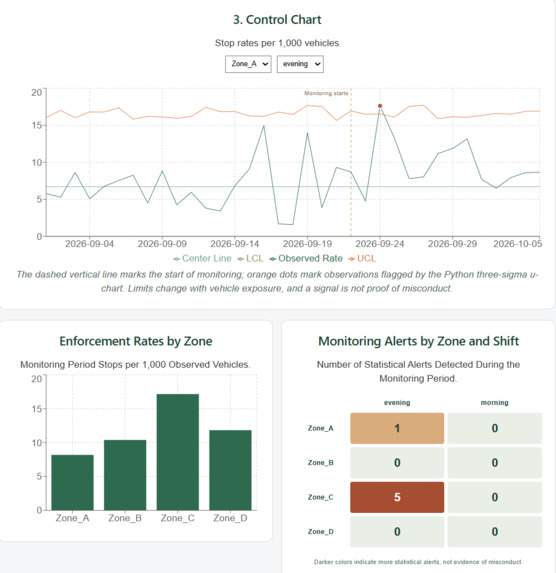
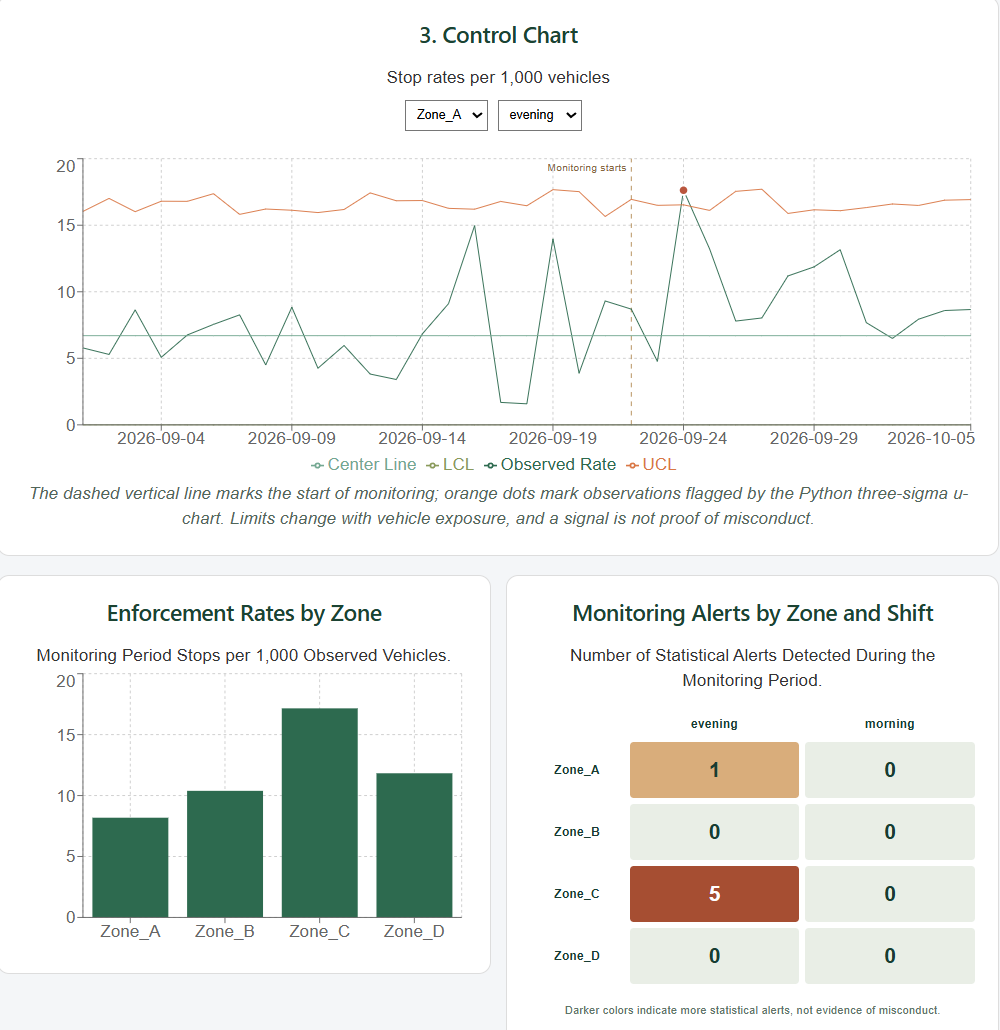
- Displays interactive control charts with observed rates, center lines, and exposure-adjusted upper and lower control limits.
- Highlights statistical signals and distinguishes baseline observations from monitoring observations.
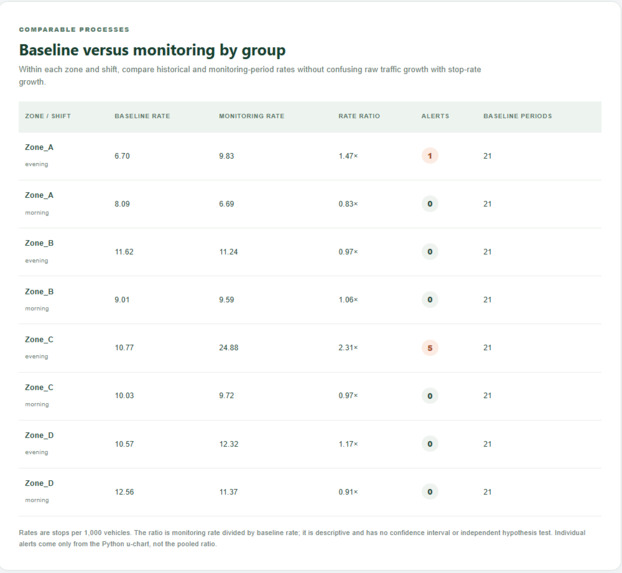
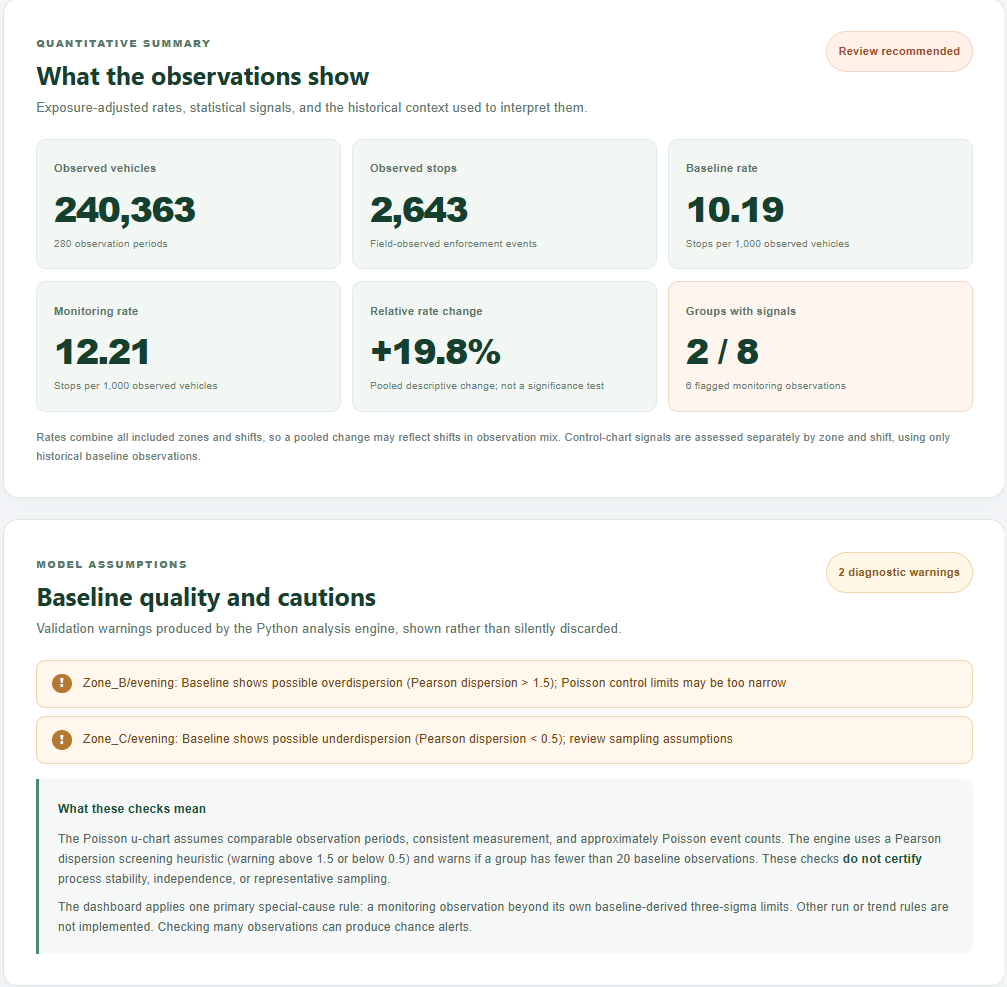
- Provides descriptive statistical summaries, baseline-versus-monitoring comparisons, zone comparisons, and a zone/shift alert heatmap.
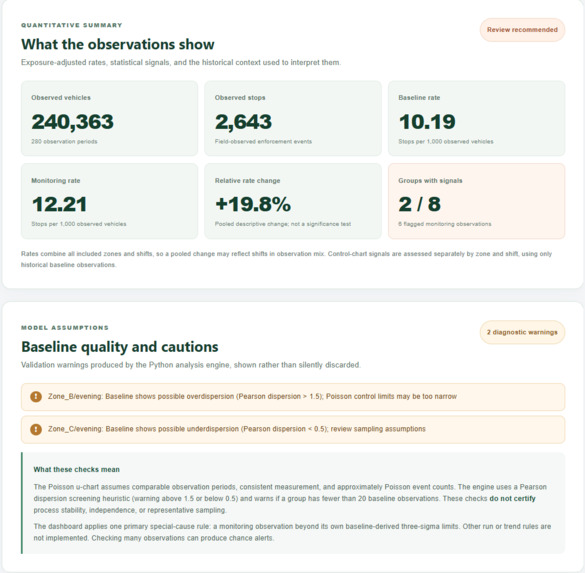
- Displays statistical assumption warnings, including possible overdispersion and underdispersion.
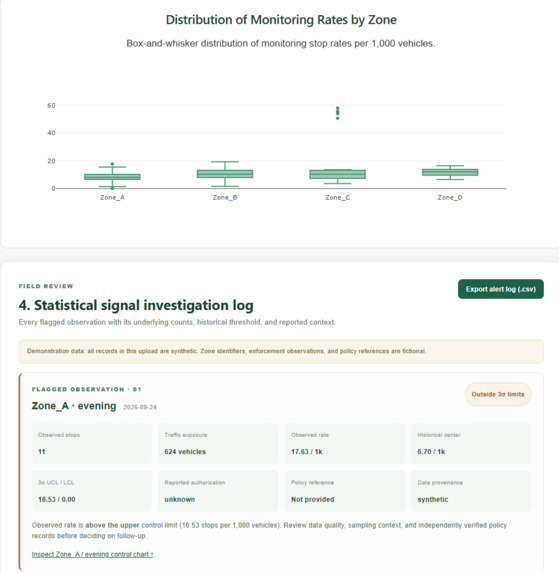
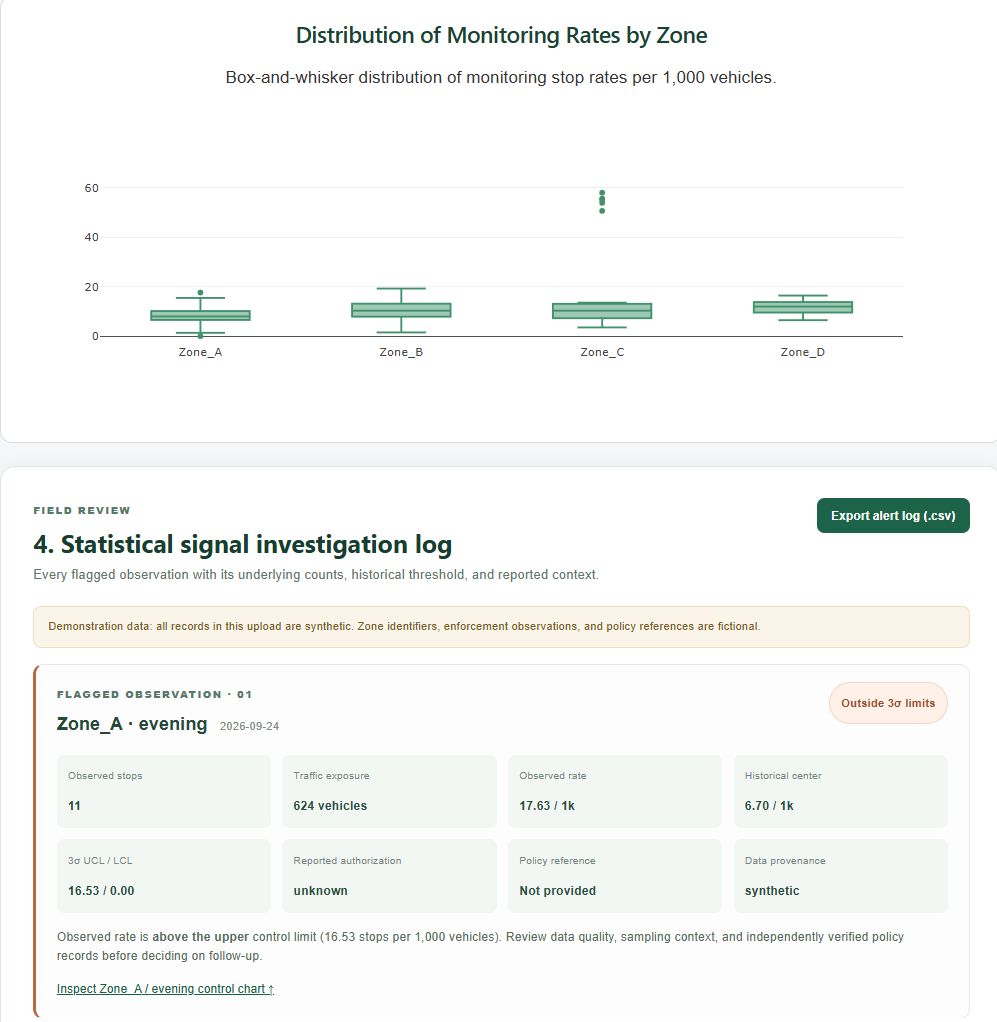
- Generates detailed investigation records containing observed stops, traffic exposure, control limits, and reported authorization context.
- Allows users to export flagged observations as a CSV for additional review.
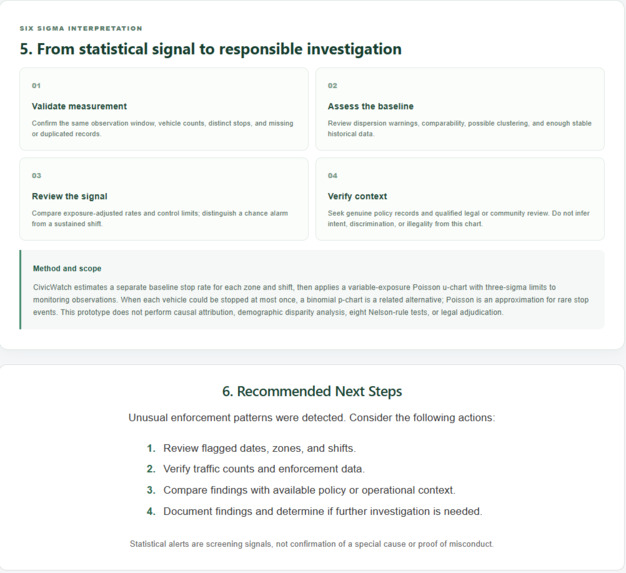
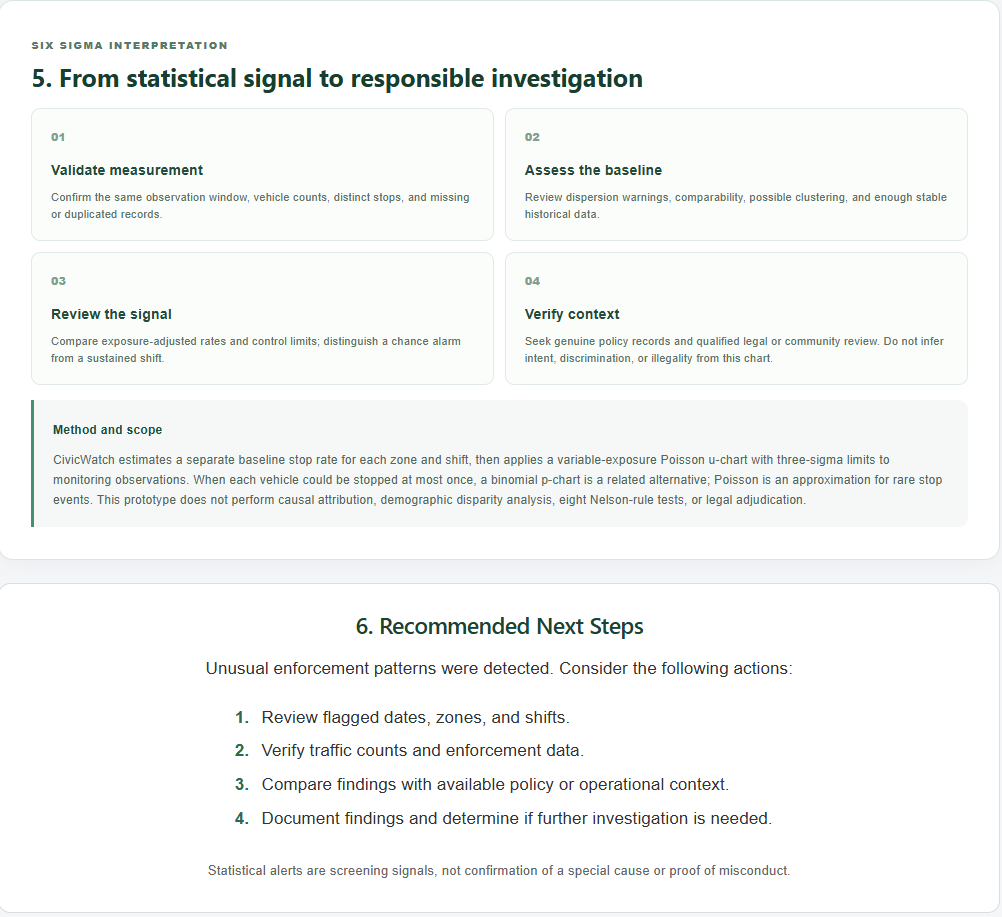
- Provides a structured investigation workflow and recommended follow-up actions.
CivicWatch is intended to support evidence-informed investigation. A statistical alert does not establish unlawful enforcement, discrimination, or causation.
How we built it
We developed CivicWatch using Python, FastAPI, React, Vite, Recharts, and Plotly.
The statistical foundation of our application is a baseline-only Poisson u-chart, a statistical process control method for monitoring event rates when the number of observed opportunities varies.
Our primary metric is:
Enforcement Rate = (Observed Stops / Observed Vehicles) × 1,000
We calculate three-sigma control limits using baseline observations, with separate statistical baselines for each geographic zone and observation shift. This accounts for variations in traffic exposure and helps distinguish changes in enforcement intensity from changes in traffic volume.
The Python backend handles data validation, statistical calculations, signal detection, and model diagnostics. The React frontend provides interactive charts, investigation summaries, and downloadable alert records.
We deployed the frontend and FastAPI backend as separate applications on Cornell's Posit Connect server.
Statistical validation
We developed three fully synthetic datasets containing 280 observations each:
- Baseline: Represents approximately stable enforcement activity, producing one incidental statistical alert.
- Ticket Blitz: Simulates five consecutive days of unusually elevated enforcement activity in Zone_C during the evening shift, producing six total alerts.
- Traffic Surge: Simulates increased traffic volume without an increase in the underlying enforcement rate, producing one incidental alert.
The three scenarios are available directly inside CivicWatch, allowing reviewers to test the application without downloading or preparing data.
We also implemented Pearson dispersion diagnostics to help identify potential departures from the Poisson model's assumptions. These diagnostics are presented as screening warnings, not definitive tests of process stability.
Our statistical engine and API passed 30 automated Python tests, while the frontend passed 9 additional tests covering descriptive calculations, evidence export, and consistency between built-in demonstrations and the validated source datasets.
Six Sigma methodology
CivicWatch applies several concepts from SYSEN 5300, including statistical process control, probability distributions, measurement consistency, baseline evaluation, and risk-aware interpretation.
We also documented potential failure modes in field-observation processes using a Failure Modes and Effects Analysis (FMEA), addressing issues such as incomplete traffic counts, inconsistent observation periods, unrepresentative baselines, and inaccurate authorization context.
The accompanying methodology documentation explains the statistical assumptions, limitations, and distinctions between control limits and policy requirements.
Challenges we ran into
One of our biggest challenges was integrating statistical analysis, a backend API, and a React dashboard into a complete application that anyone could access.
We encountered frontend build errors, deployment configuration issues, and public-access restrictions while publishing our application to Posit Connect. Resolving these issues required collaborative troubleshooting, automated testing, and repeated deployment verification.
Another major challenge was selecting and interpreting an appropriate statistical model.
Traffic enforcement observations require careful consideration of exposure. Simply comparing raw stop counts could produce misleading conclusions when traffic volumes change.
We also needed to distinguish statistical anomalies from potential policy violations. An observation exceeding its control limits provides a reason for further investigation, but it does not establish why the pattern occurred.
Finally, we worked to make statistical results understandable to users without a technical background while clearly communicating model assumptions and uncertainty.
Accomplishments that we're proud of
Our team successfully developed and publicly deployed a functional statistical process control application within the hackathon's seven-day development window.
Key accomplishments include:
- Building an interactive dashboard that requires no local software installation.
- Implementing independently tested Poisson u-chart calculations with exposure-adjusted control limits.
- Passing 39 automated Python and frontend tests, along with frontend lint and production build checks.
- Developing three reproducible synthetic datasets with documented assumptions and expected outcomes.
- Providing one-click demonstrations of baseline activity, an enforcement-rate surge, and a traffic-volume surge.
- Successfully detecting all five intentionally introduced ticket-blitz observations.
- Demonstrating that increased traffic volume does not necessarily indicate unusual enforcement intensity.
- Providing statistical model diagnostics and clearer communication of baseline assumptions.
- Building an investigation log with supporting counts, statistical thresholds, and reported policy context.
- Implementing CSV export functionality for flagged observations.
- Documenting our statistical methodology, limitations, and field-observation risks through an FMEA.
- Validating all three scenarios through the deployed application, producing the expected 1, 6, and 1 monitoring alerts.
We are particularly proud that CivicWatch combines statistical rigor with an accessible, interactive interface designed to support responsible interpretation and evidence-informed decisions.
What we learned
This project reinforced the importance of selecting statistical methods that reflect the underlying measurement process.
We learned how to apply statistical process control outside traditional manufacturing environments and why normalizing event counts is essential when exposure varies.
We also learned that a mathematically correct statistical result is only one part of a useful analytical tool. Users need to understand the assumptions behind a result, what constitutes a meaningful signal, and what additional evidence is necessary before acting.
Through our FMEA and methodology review, we gained a better understanding of how measurement errors, baseline selection, sampling consistency, and contextual information can influence the reliability of statistical conclusions.
We also gained practical experience with API development, frontend integration, automated testing, GitHub collaboration, cloud deployment, technical documentation, and designing an application around stakeholder needs.
Most importantly, CivicWatch highlighted the distinction between detecting unusual statistical behavior and explaining why that behavior occurred.
What's next for Lean Leaders: CivicWatch
CivicWatch is currently a functional demonstration using synthetic data. Its underlying approach could be extended to support more comprehensive monitoring applications.
Potential future improvements include:
- Validated statistical confidence intervals and additional comparisons between monitoring areas and periods.
- Additional special-cause detection methods adapted to discrete event counts and varying exposure.
- More comprehensive downloadable reports beyond the current CSV alert export.
- Integration of independently verified policy and authorization records.
- Standardized field-observation procedures and expanded data-quality assessments.
- Evaluation of alternative statistical models when Poisson assumptions are not appropriate.
- Stronger accessibility, privacy, security, and data-governance safeguards for real-world deployment.
Before using CivicWatch with actual field observations, we would need to establish reliable data collection procedures, evaluate model assumptions using real data, implement appropriate privacy protections, and establish safeguards against misleading statistical interpretations.
Our broader goal is to demonstrate how Six Sigma principles can support transparent, responsible, and evidence-informed decision-making in community systems.
Built With
- fastapi
- github
- javascript
- plotly.js
- posit-connect
- python
- react
- recharts
- vite


Log in or sign up for Devpost to join the conversation.