-
-
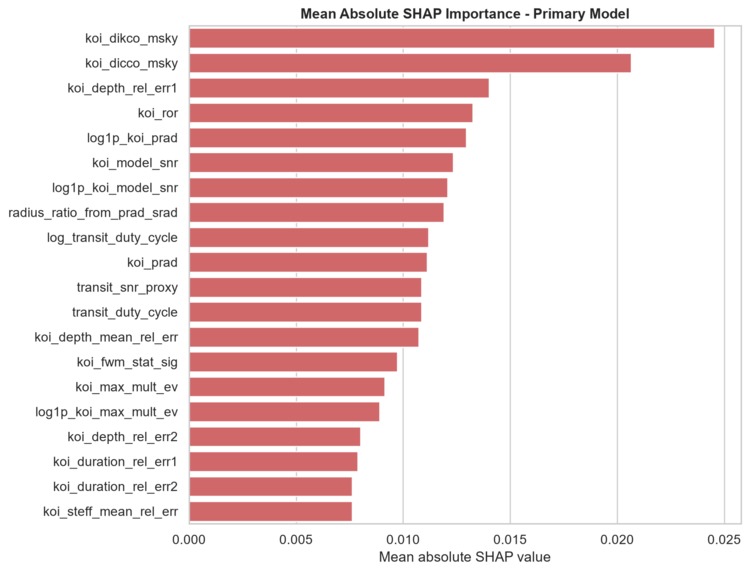
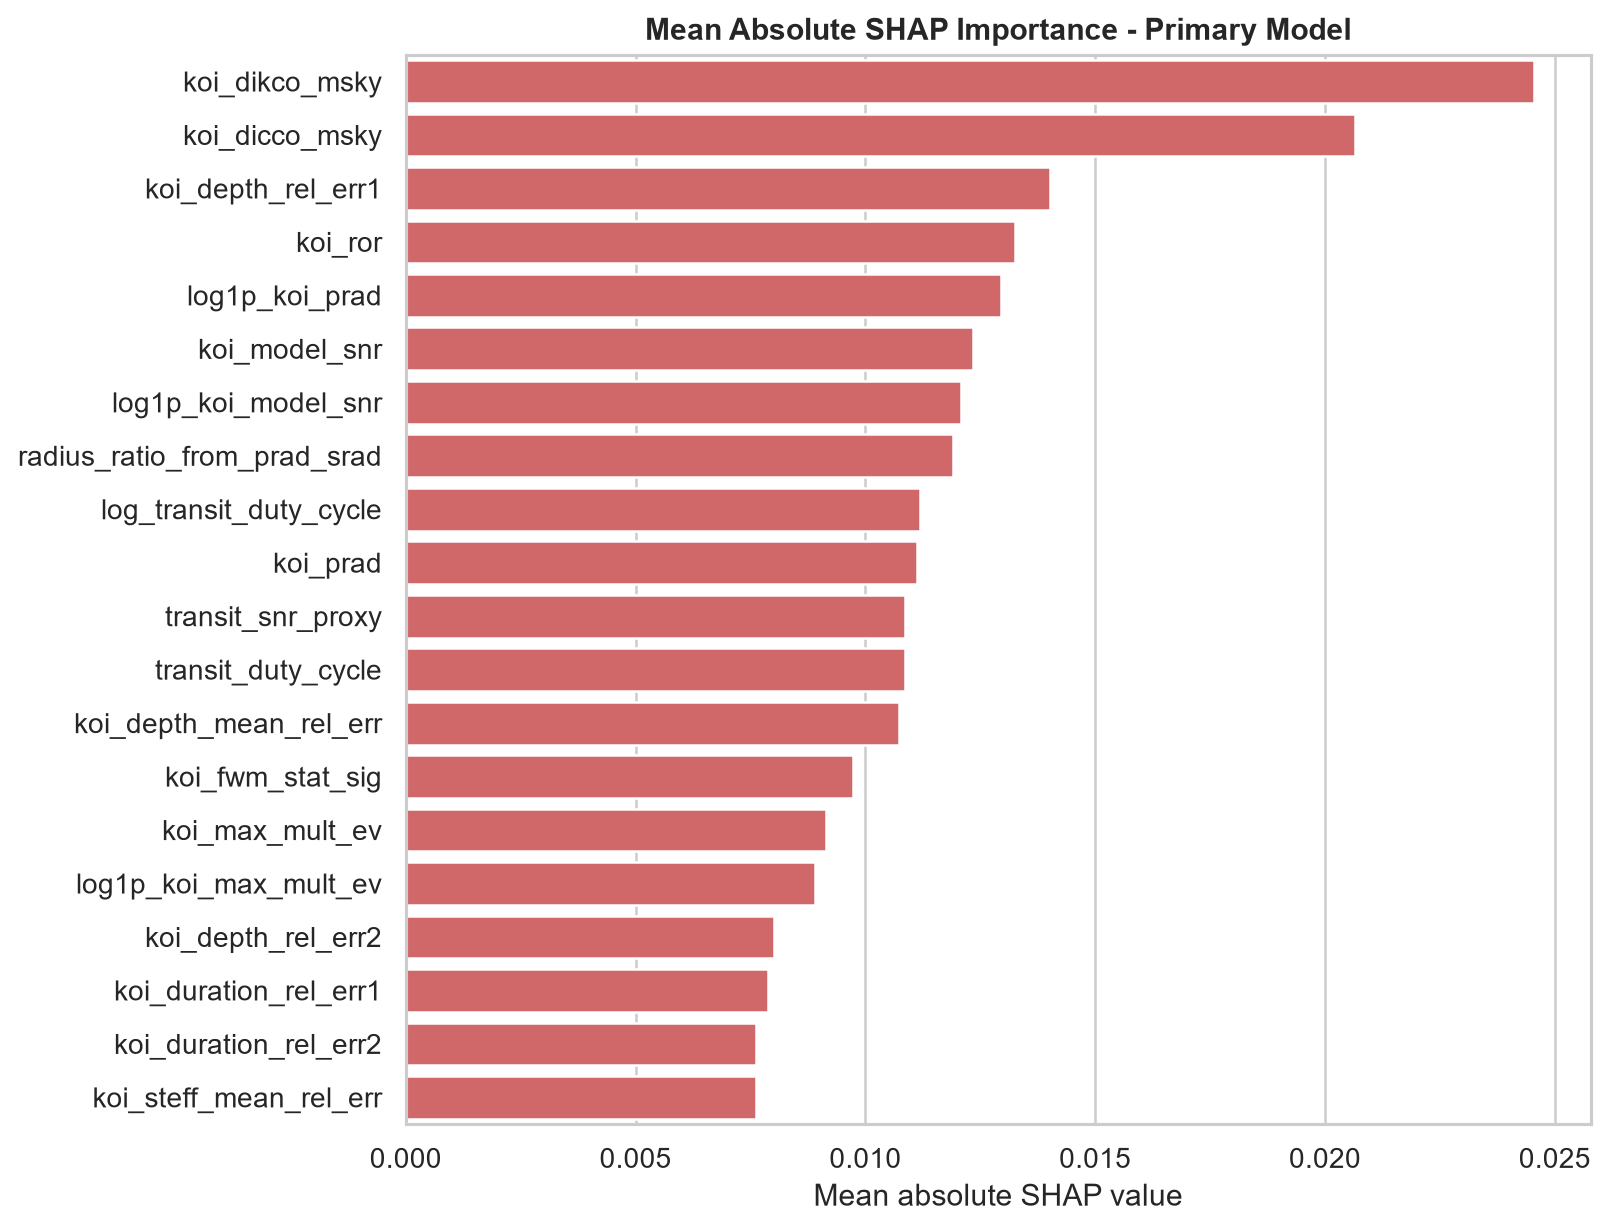
Top SHAP features: centroid-offset signals (koi_dikco_msky, koi_dicco_msky) plus our engineered SNR and radius-ratio features.
-
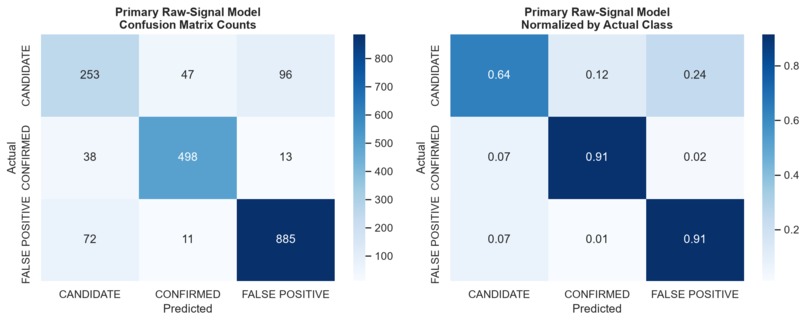
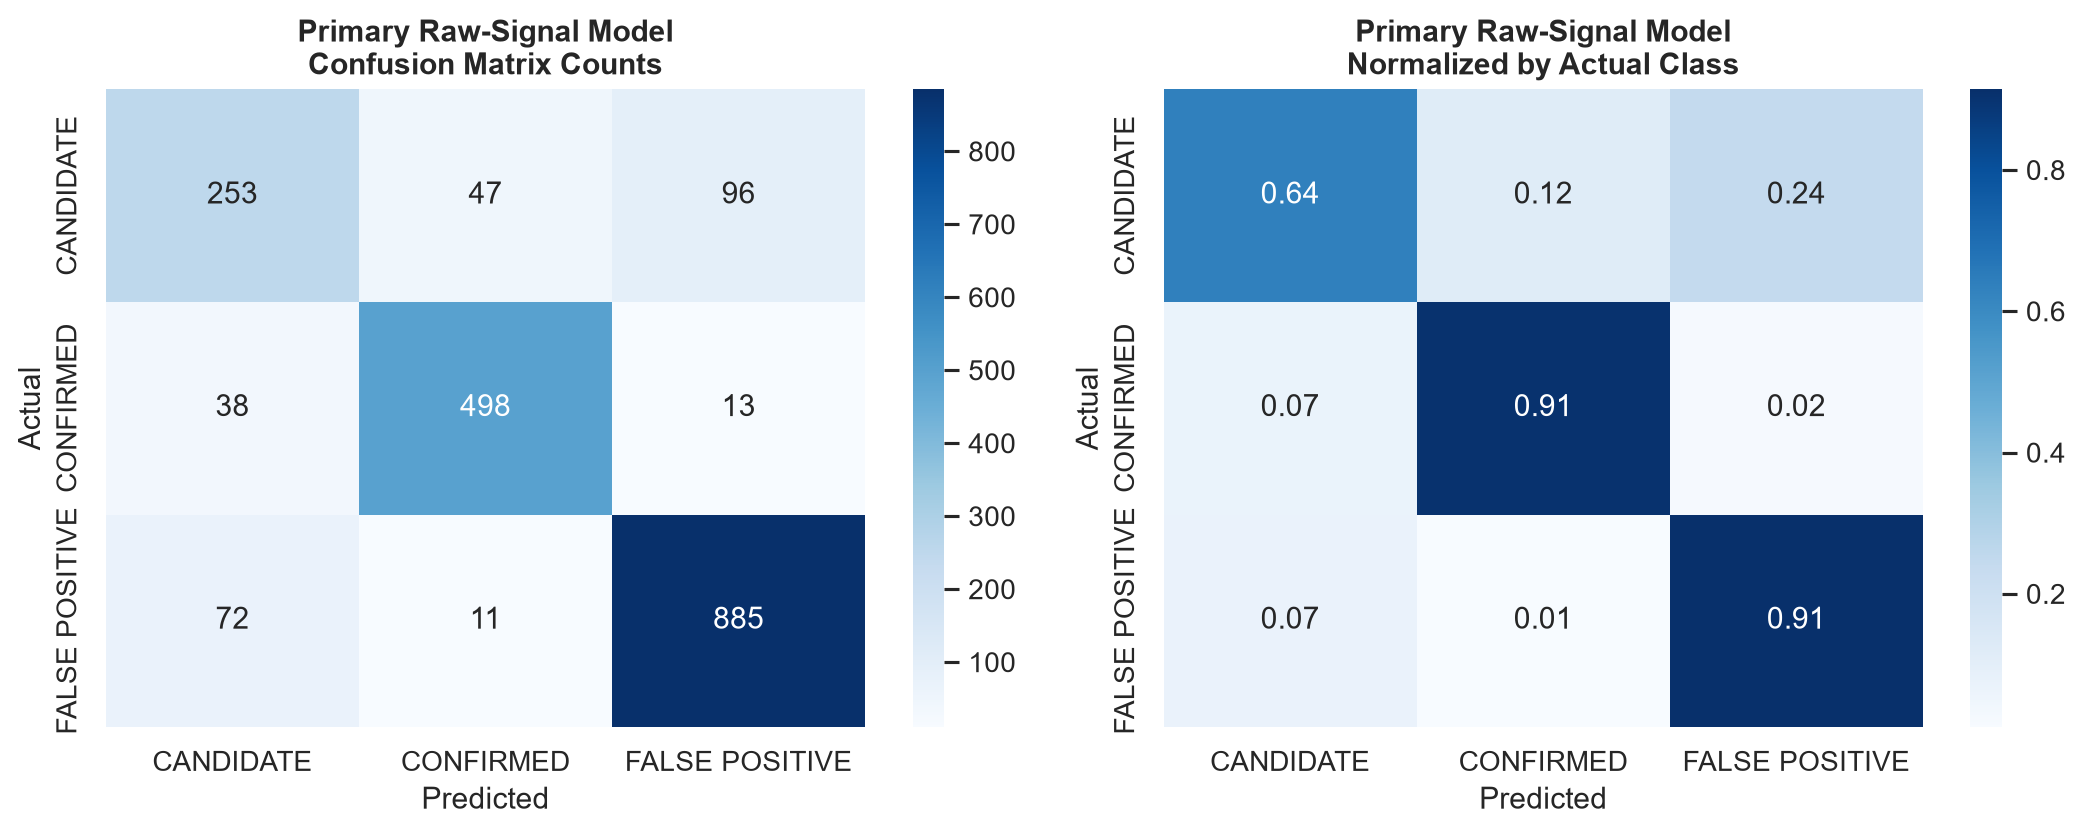
Primary raw-signal model: 91% recall on Confirmed & False Positive, 64% on Candidate — the hardest class to separate.
-
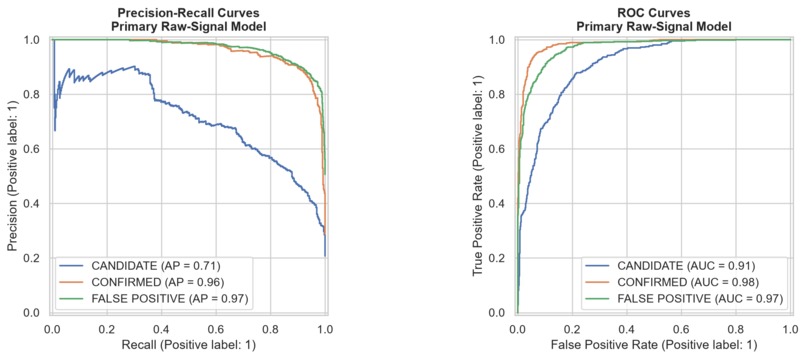
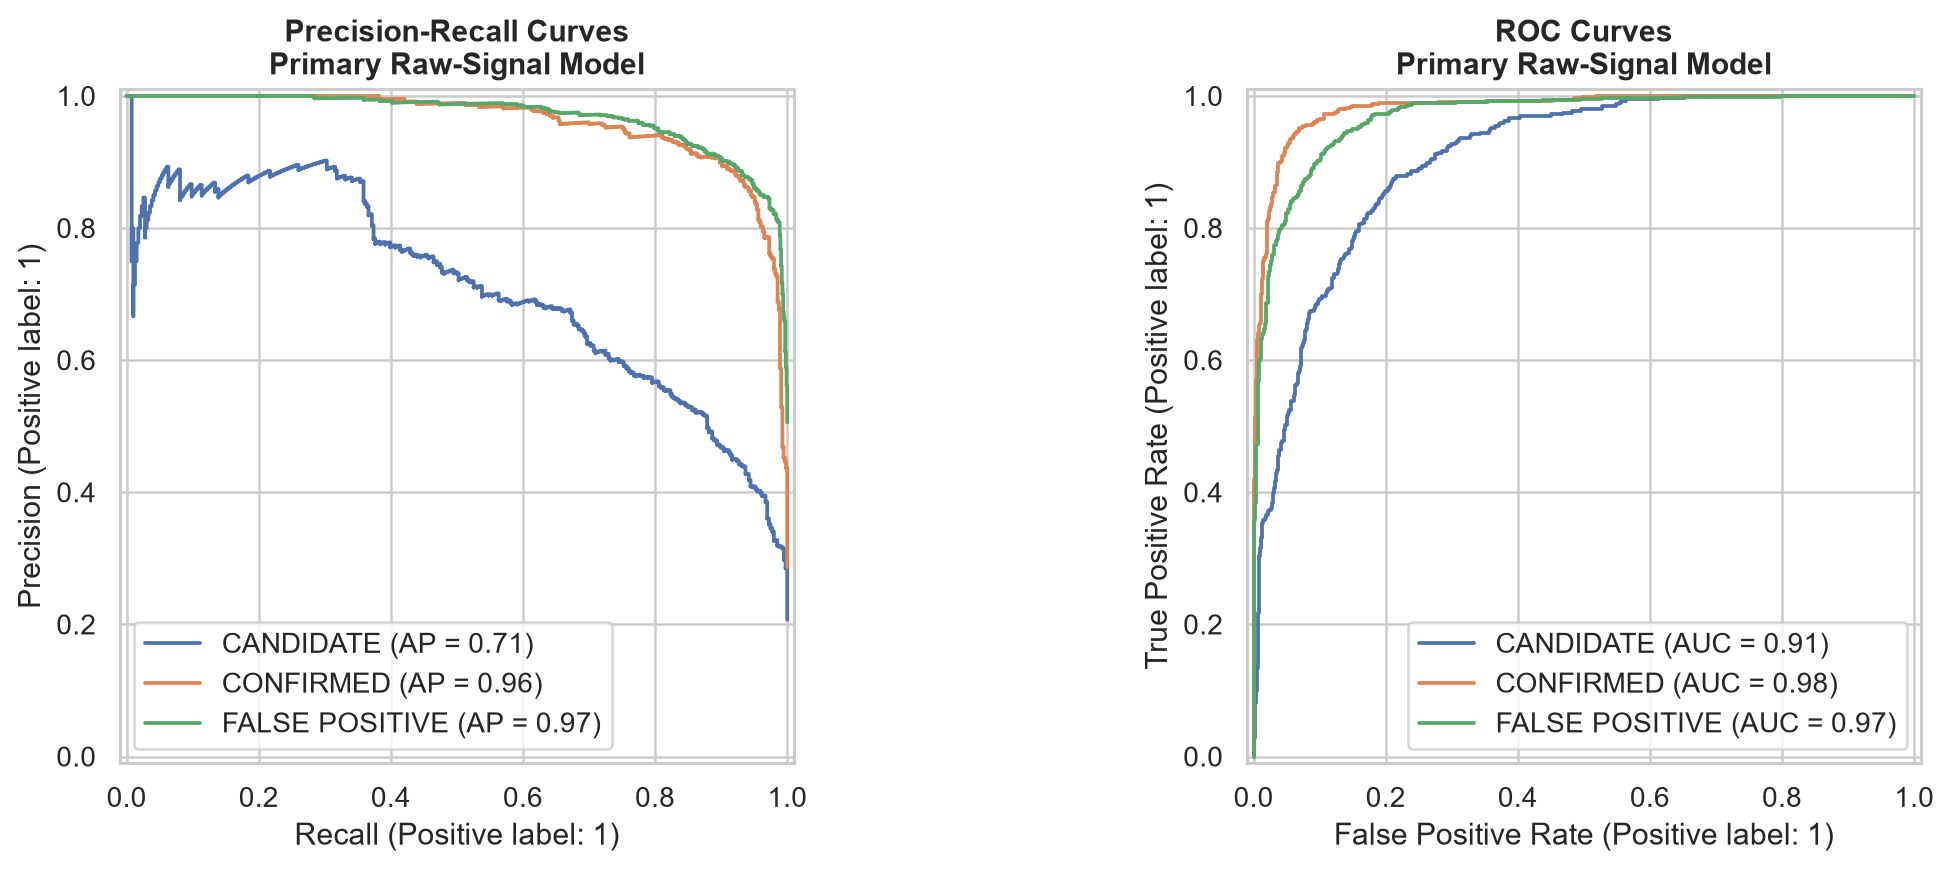
AUC 0.91–0.98 across classes. Candidate is toughest (AP 0.71) vs. Confirmed (AP 0.96) and False Positive (AP 0.97).
-
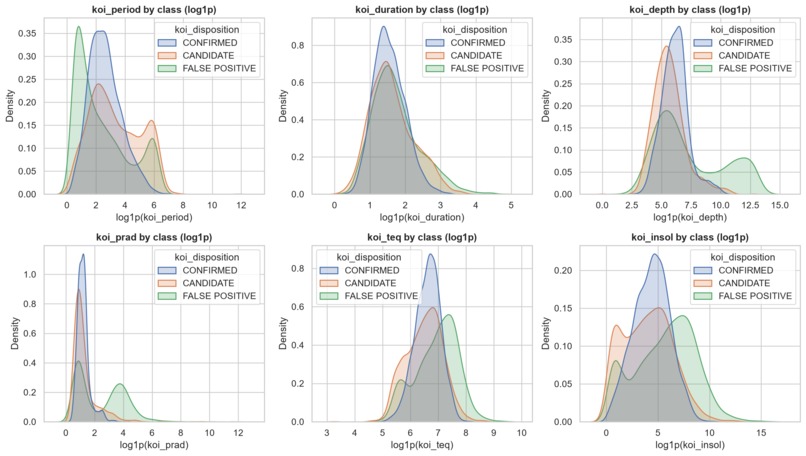
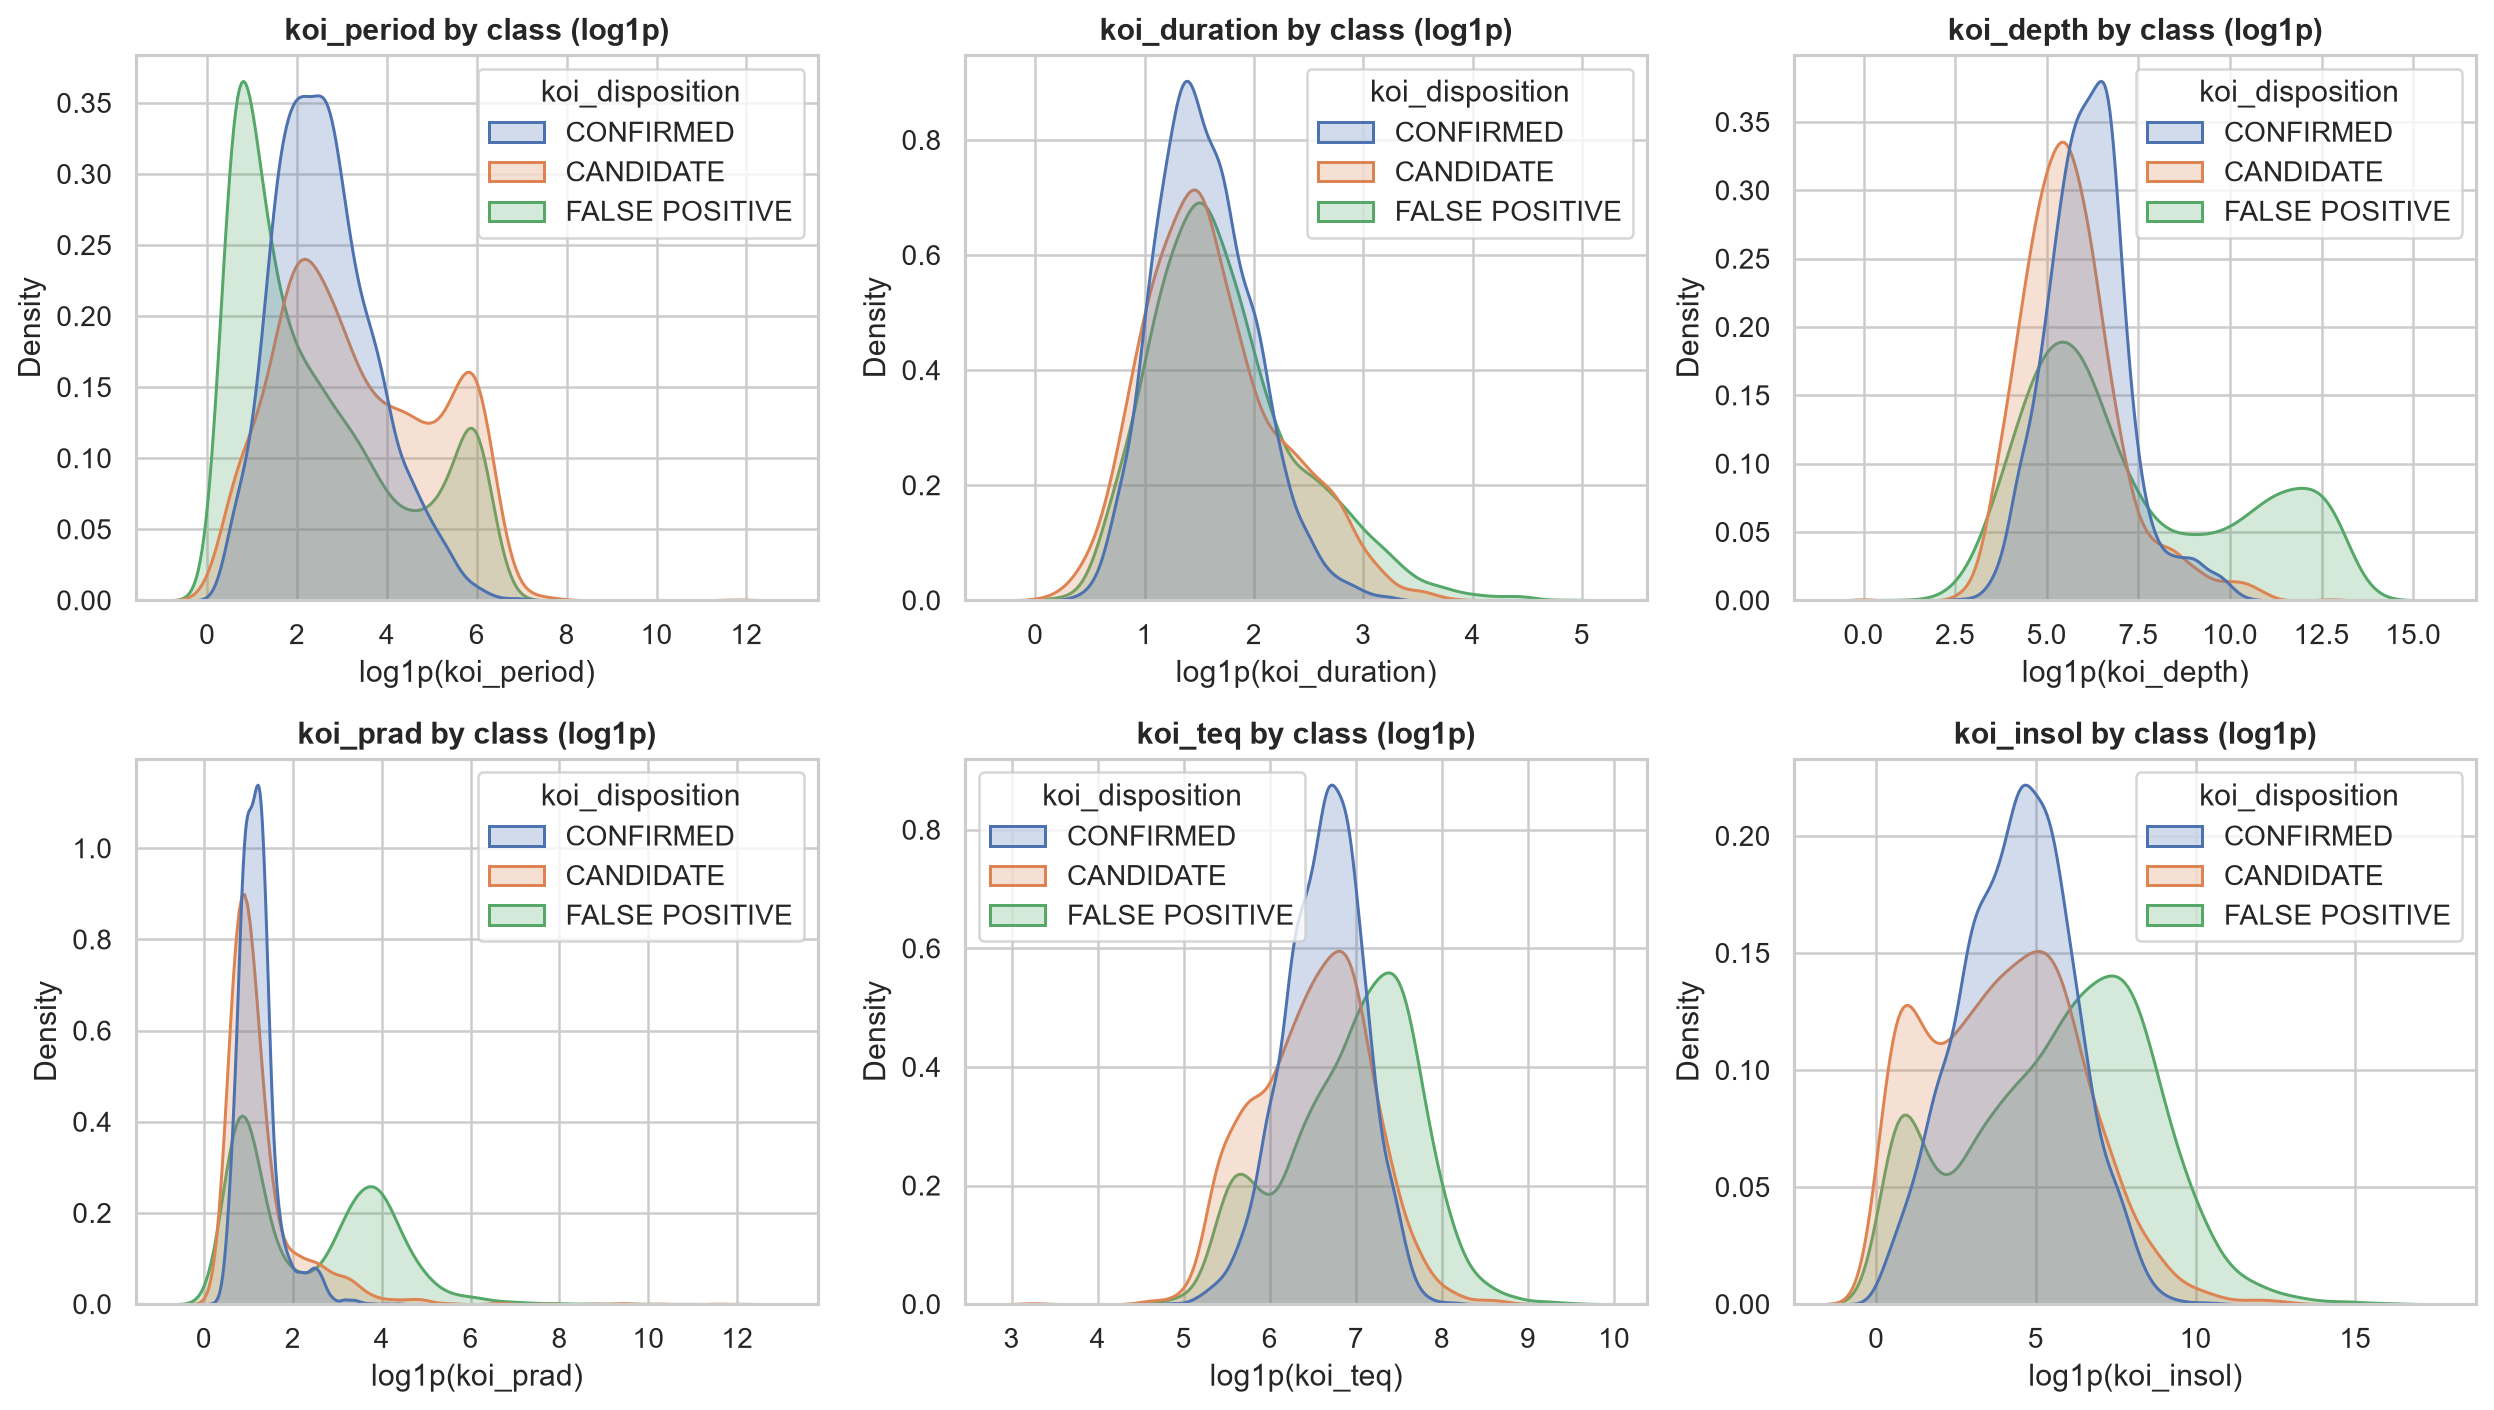
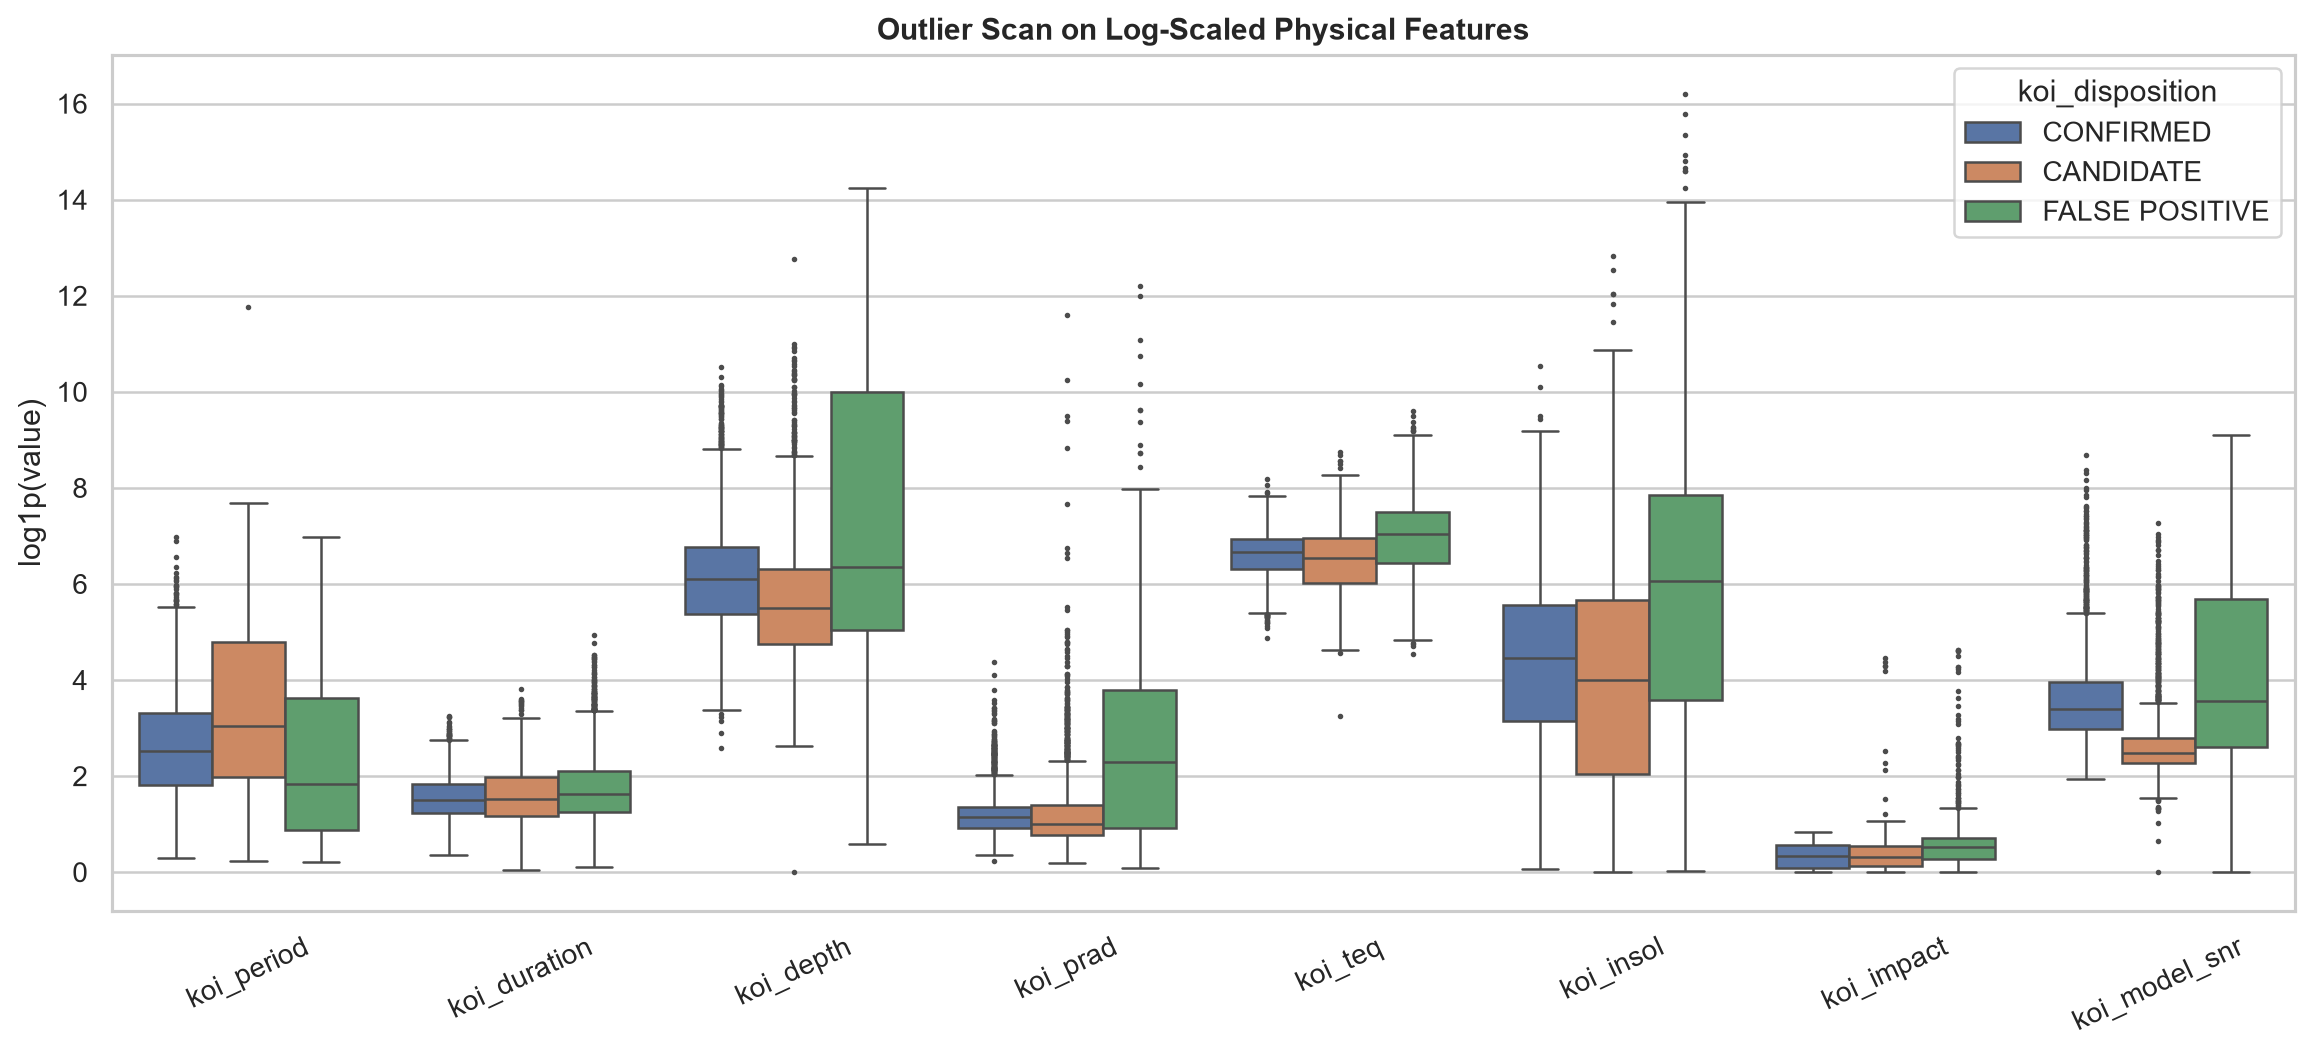
Log-scaled transit features by class — false positives skew toward deeper, hotter, higher-insolation signals.
-
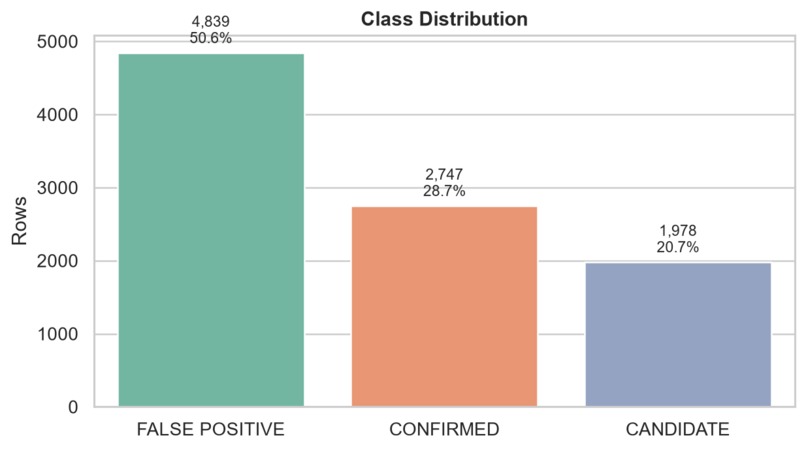
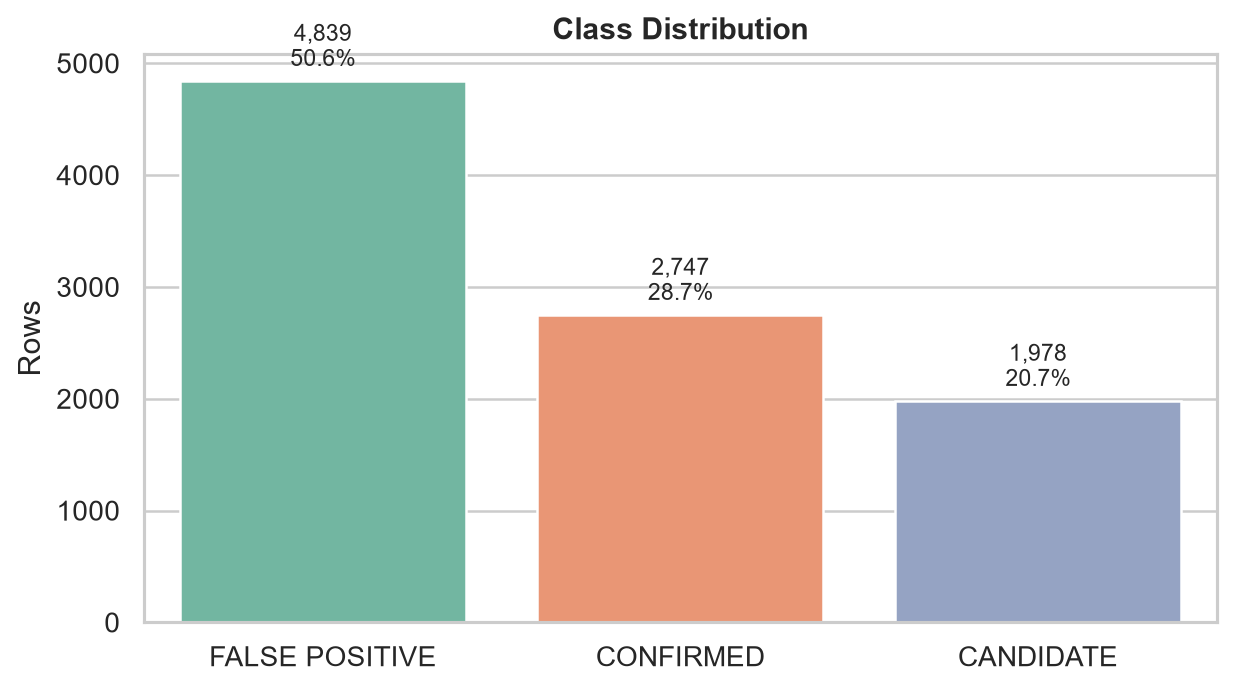
Class imbalance: 4,839 False Positive (50.6%), 2,747 Confirmed (28.7%), 1,978 Candidate (20.7%).
-
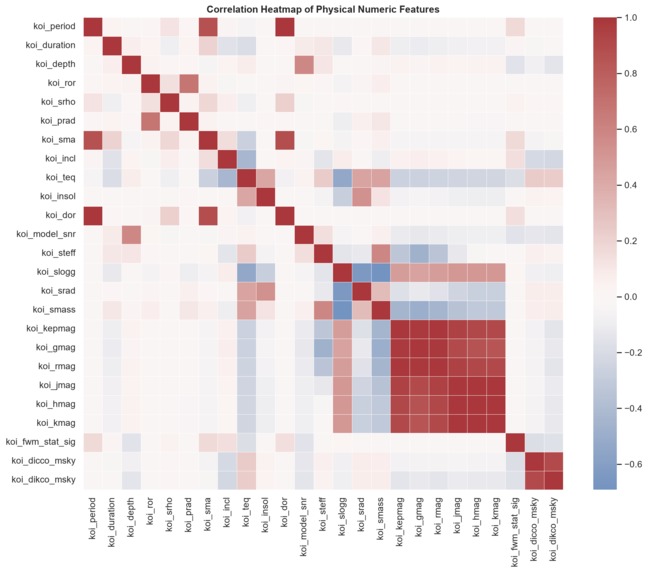
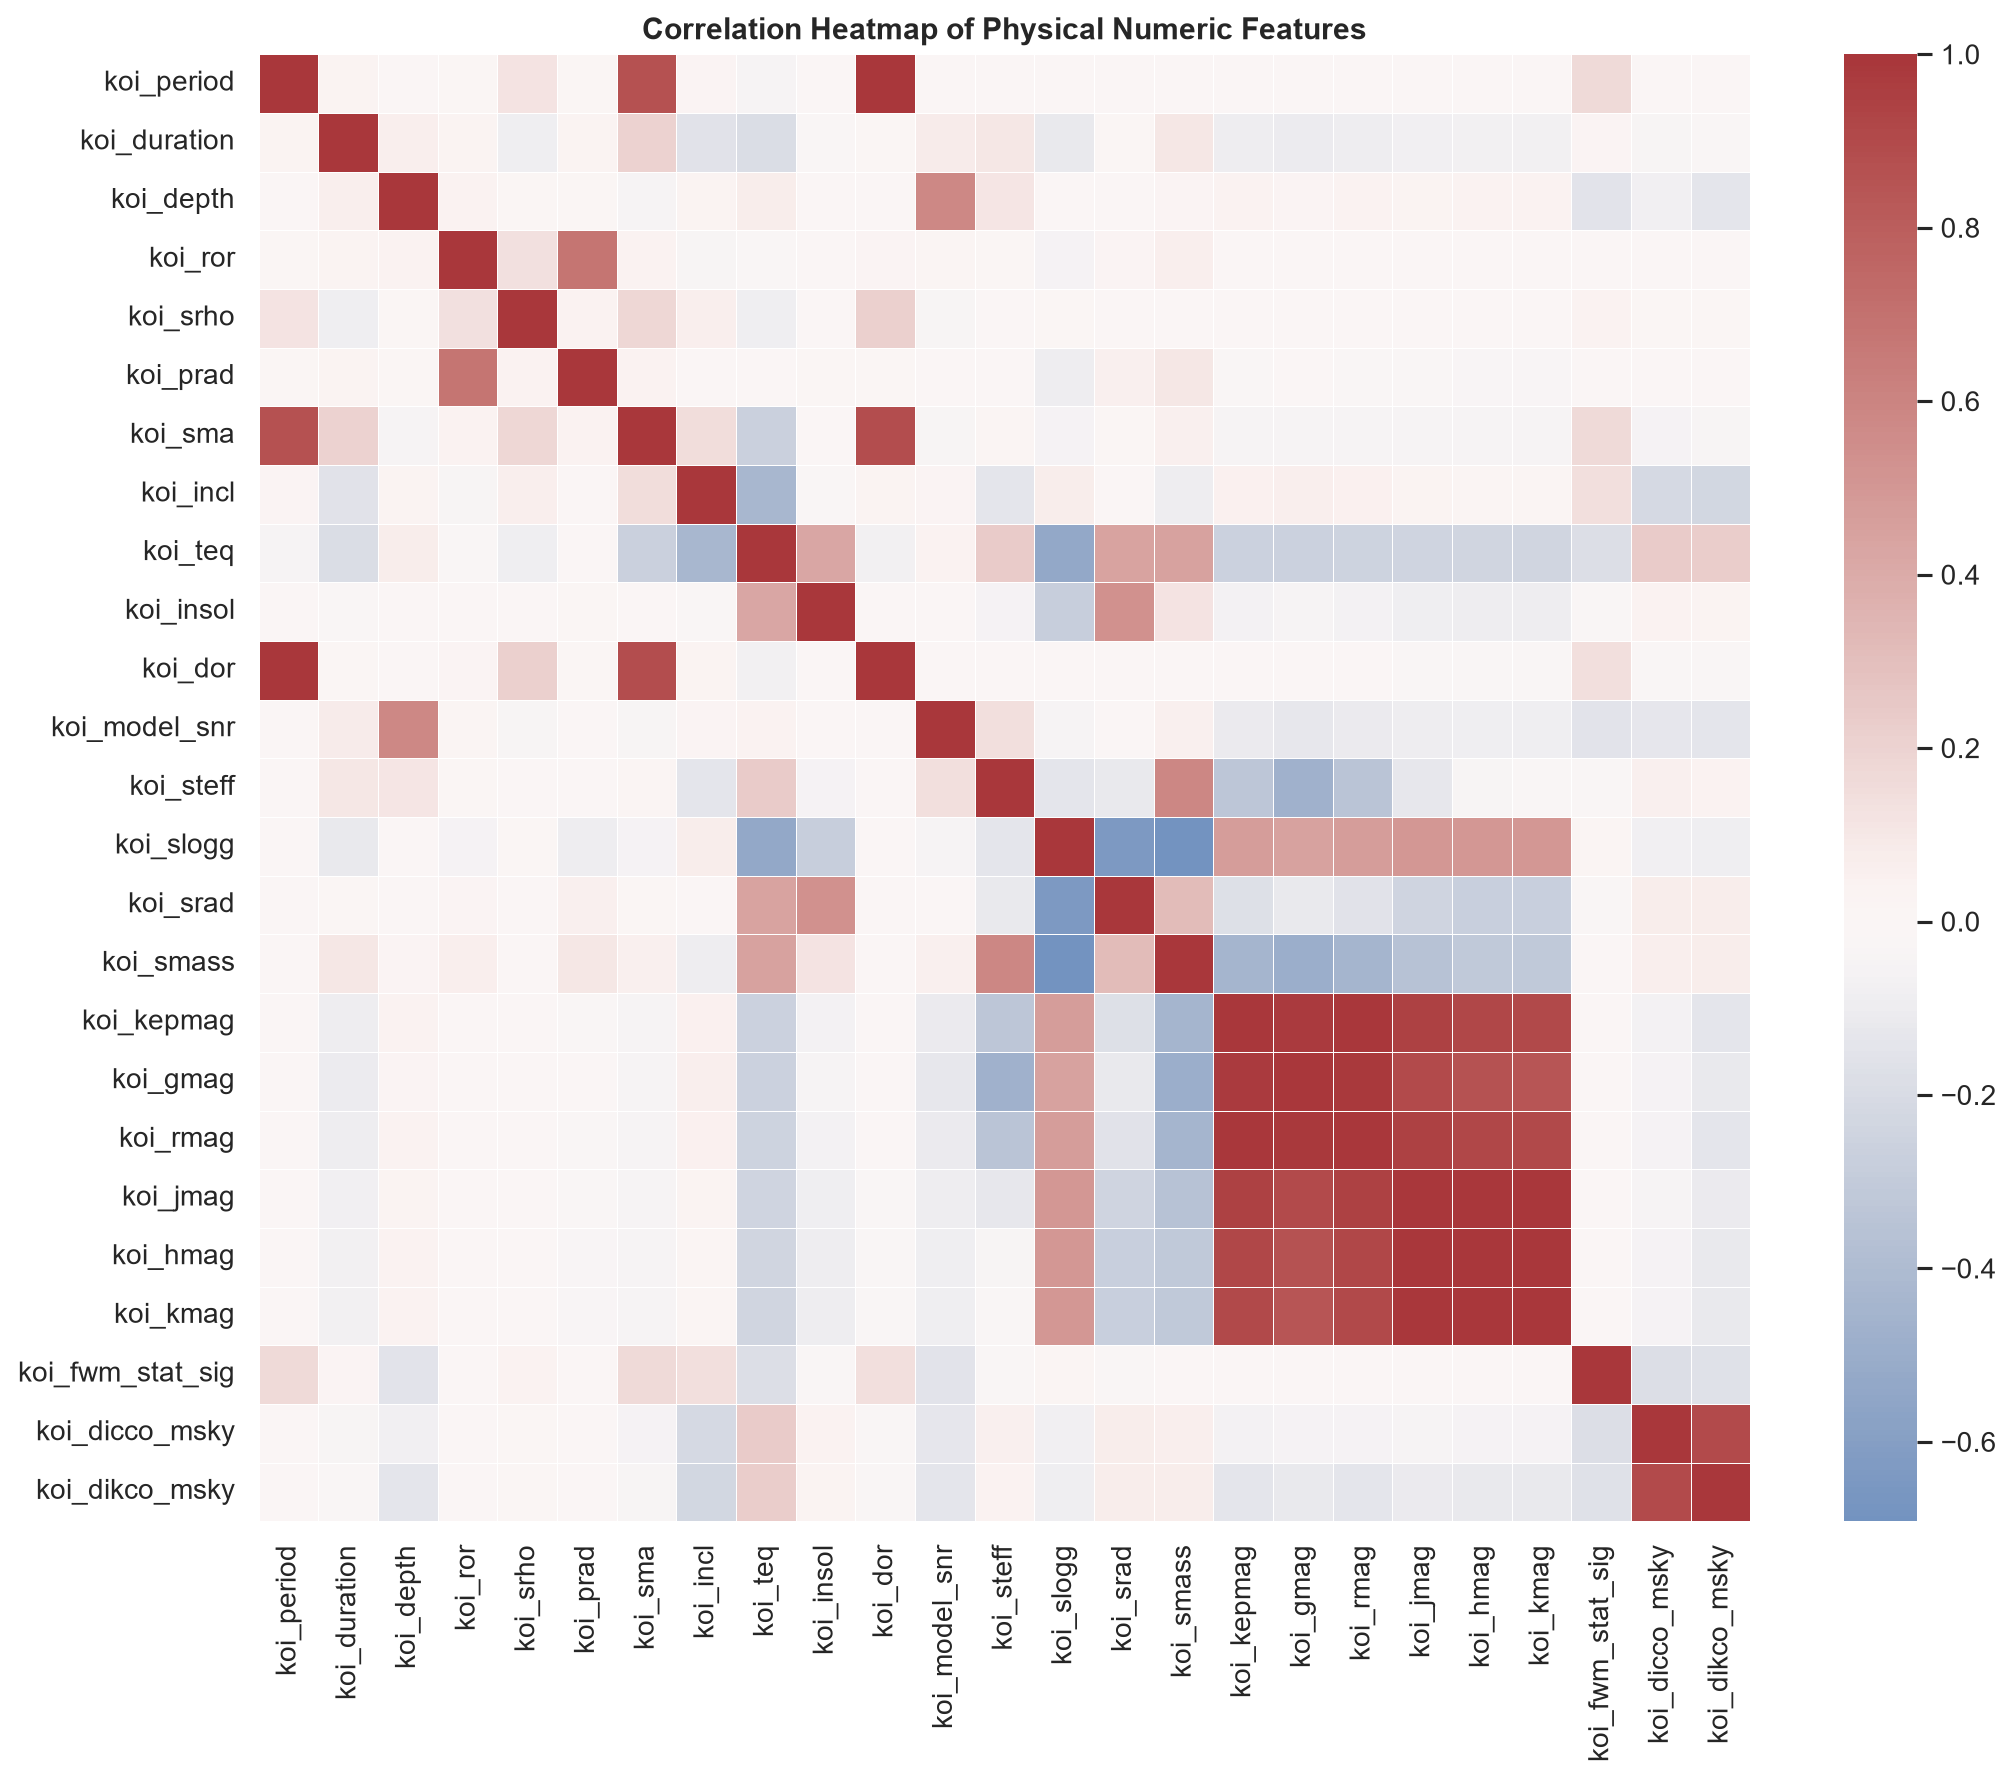
Correlation heatmap across 24 physical features — flagged multicollinear stellar-magnitude columns before modeling.
-
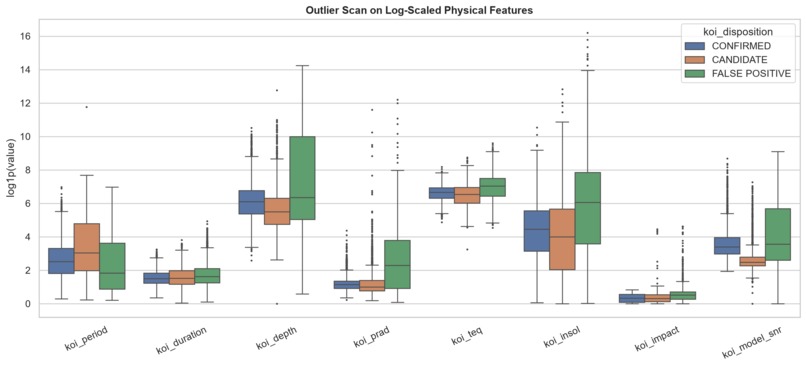
Log-scaled outlier scan by class — extreme depth and radius outliers reviewed rather than blindly dropped.
Inspiration
Astronomers don't see exoplanets directly — they infer them from a faint, periodic dip in starlight as a planet crosses its star. We wanted to tackle the exact classification problem NASA scientists face when vetting Kepler candidates, using real observational data instead of a synthetic dataset — and to do it honestly, without letting the model quietly "cheat" off NASA's own vetting labels.
What it does
Classifies Kepler Objects of Interest (KOIs) as CONFIRMED, CANDIDATE, or FALSE POSITIVE using real transit and stellar measurements from the NASA Exoplanet Archive's Kepler cumulative table (9,564 rows, 140 columns).
| Model | Accuracy | Macro F1 | Weighted F1 | Macro Recall |
|---|---|---|---|---|
| Random Forest, raw-signal (primary) | 0.855 | 0.823 | 0.853 | 0.820 |
| Random Forest, + NASA vetting flags (comparison only) | — | 0.896 | 0.920 | 0.890 |
The gap between these two rows is the point — see "Why two models" below.
Why two models
Several columns in the Kepler catalog are NASA's own near-final verdicts, not raw measurements — koi_pdisposition, and identifier columns like kepler_name (named planets are almost always already confirmed). Including these would let a model quietly "copy the answer" instead of learning real signal. We excluded them entirely from the primary model, and isolated NASA's diagnostic false-positive flags (koi_fpflag_*) into a separate, clearly labeled comparison model rather than folding them in silently. The primary 0.855 accuracy / 0.823 macro F1 result is therefore a genuine estimate of what's learnable from raw transit and stellar signal alone — not a NASA verdict in disguise.
How we built it
Pipeline:
Raw KOI CSV (9,564 rows × 140 cols)
        │
        ▼
Leakage Audit ──► koi_pdisposition, koi_score, kepler_name, IDs → DROPPED
        │          koi_fpflag_* (vetting flags) → isolated to comparison model
        ▼
EDA ──► class imbalance, missingness, correlation, outlier scan
        │
        ▼
Feature Engineering ──► transit SNR proxy, radius-ratio consistency,
        │                log-transforms, error-to-value ratios
        ▼
Stratified 5-Fold CV ──► imputer fit fresh INSIDE each fold (no leakage)
        │
        ▼
Model Training ──► Random Forest vs. XGBoost, tuned
        │
        ▼
Evaluation ──► Confusion Matrix · PR/ROC curves · CV stability
        │
        ▼
Explainability ──► SHAP values · plain-language summary
| Stage | Key decision |
|---|---|
| Leakage audit | Dropped columns that are NASA's own near-final verdicts, not raw measurements |
| EDA | Quantified 50.6% / 28.7% / 20.7% class split before choosing a resampling strategy |
| Feature engineering | Built transit-physics-aware features, not generic polynomial terms |
| Validation | Stratified 5-fold CV, imputer refit per fold to prevent validation leakage |
| Explainability | SHAP + a plain-language paragraph, not just a feature-importance plot |
Stack: Python, scikit-learn, XGBoost, SHAP, pandas, NumPy, Jupyter, Matplotlib, Seaborn
Challenges we ran into
The biggest challenge wasn't modeling — it was realizing several catalog columns are NASA's own near-final verdicts rather than raw measurements. kepler_name is especially subtle: named KOIs are almost always already confirmed, so it's an almost-perfect leak that doesn't look like one at first glance. Designing a primary/comparison model split, instead of just picking whichever number looked better, was the harder and more important decision.
Accomplishments that we're proud of
| Accomplishment | Why it matters |
|---|---|
| Zero-error, top-to-bottom reproducibility | Restart Kernel & Run All succeeds with no manual fixes |
| Fold-safe imputation | Missing-value stats computed only from training folds, never validation folds |
| Two-model leakage comparison | Shows exactly how much apparent accuracy inflation comes from NASA's own flags |
| Physically-grounded features | Every engineered feature ties to real transit photometry, not blind feature crossing |
What we learned
The most important raw-signal features were koi_dikco_msky, koi_dicco_msky, koi_depth_rel_err1, koi_model_snr, koi_ror, and koi_depth_mean_rel_err — these make physical sense: false positives often show unusually large inferred radii, high impact parameters, inconsistent radius-depth relationships, or extreme signal properties. In plain terms: the model checks whether a dip in starlight is the right size, lasts a believable amount of time, repeats in a stable orbit, and matches what we already know about the star. When it doesn't line up, that's a red flag for a false positive rather than a real planet.
What's next for Leakage-Free Kepler Exoplanet Classifier
Extending the same leakage-audit methodology to TESS Objects of Interest (TOI) data, and testing whether the transit-consistency features generalize across missions rather than being Kepler-specific artifacts.
Built With
- jupyter
- matplotlib
- numpy
- pandas
- python
- scikit-learn
- seaborn
- shap
- xgboost

Log in or sign up for Devpost to join the conversation.