-
-
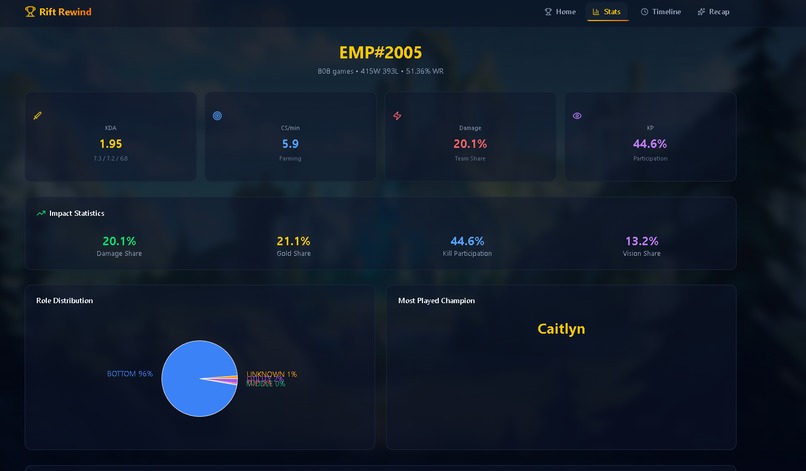
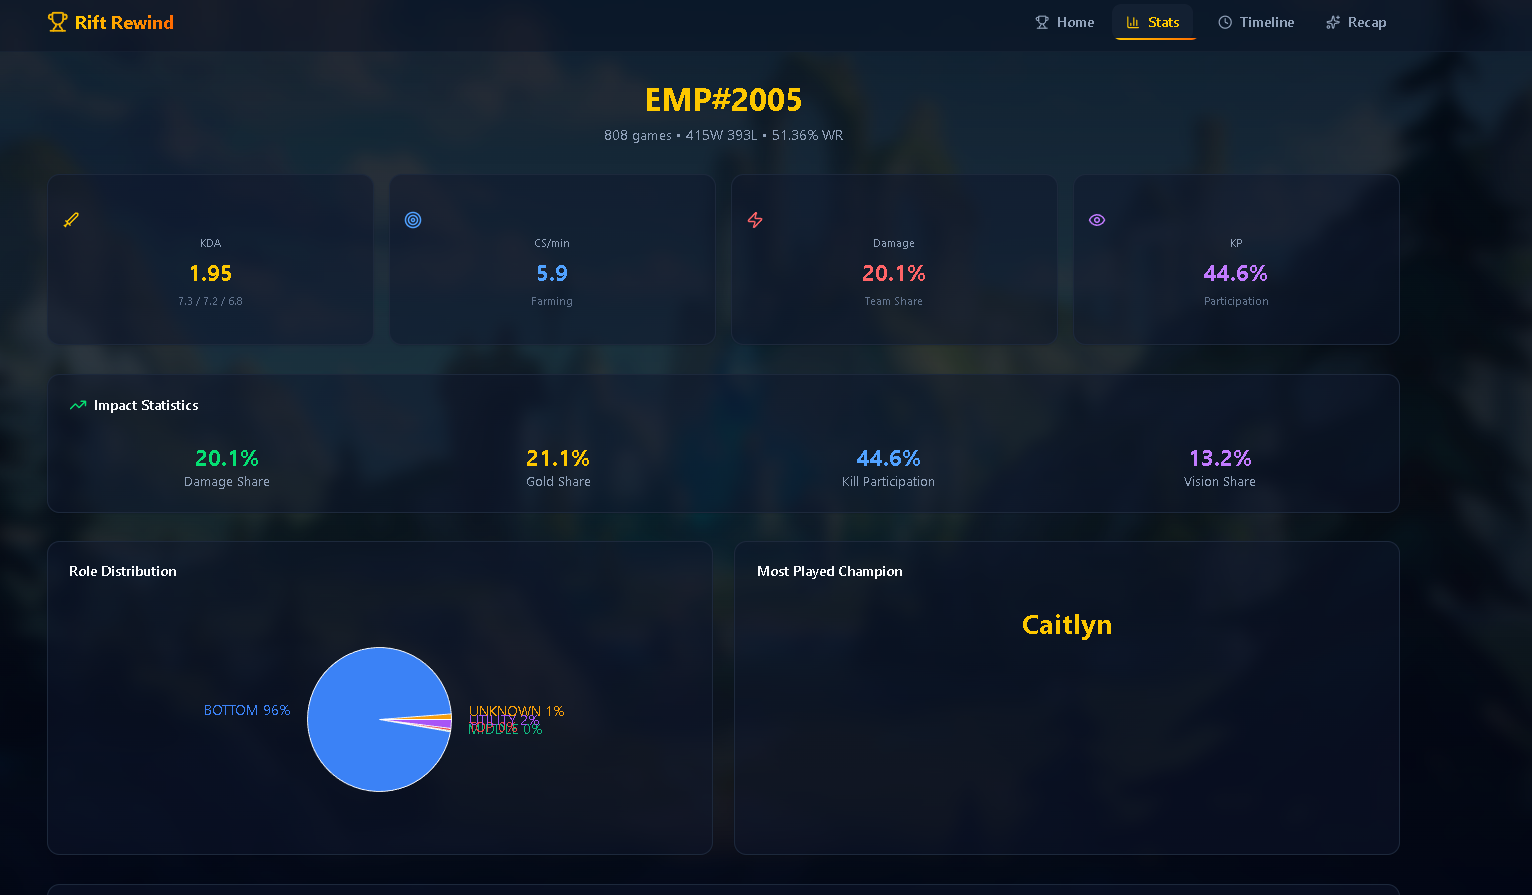
Overall season stats including KDA, CS/min, impact metrics, and role distribution.
-
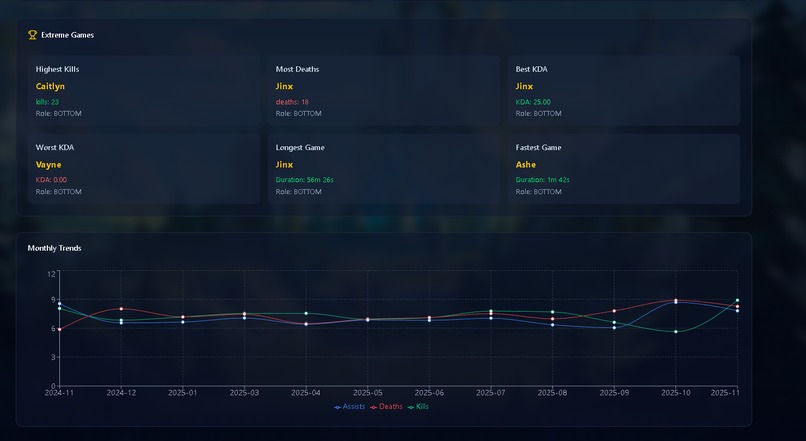
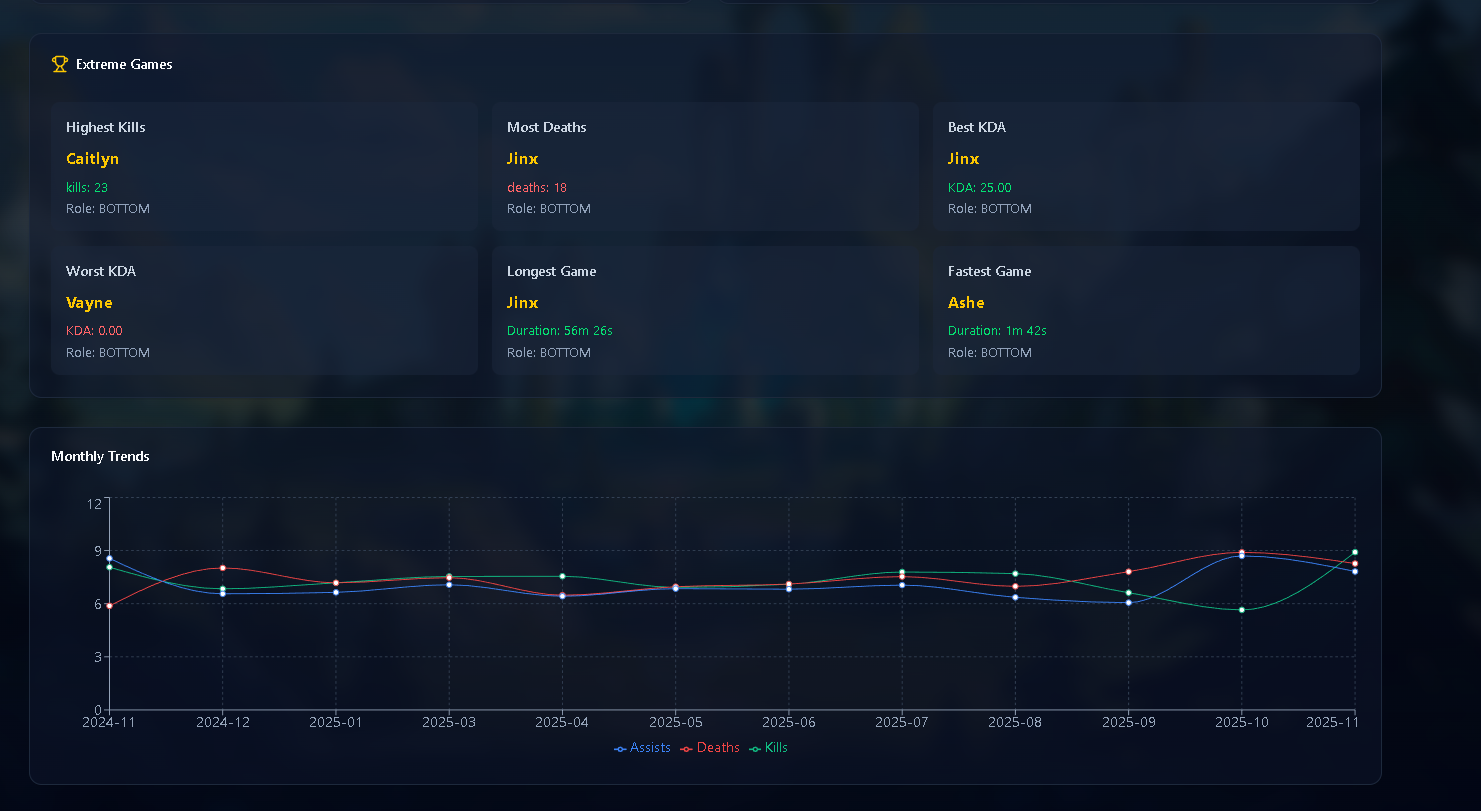
Extreme match performances and month-to-month performance trends.
-
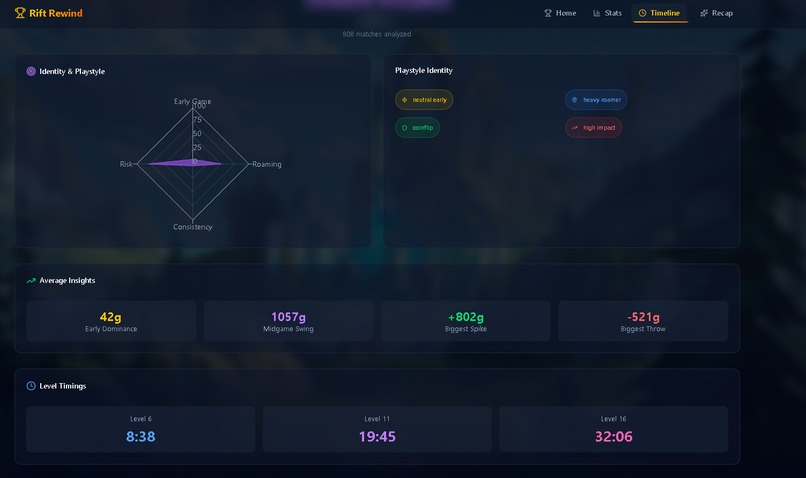
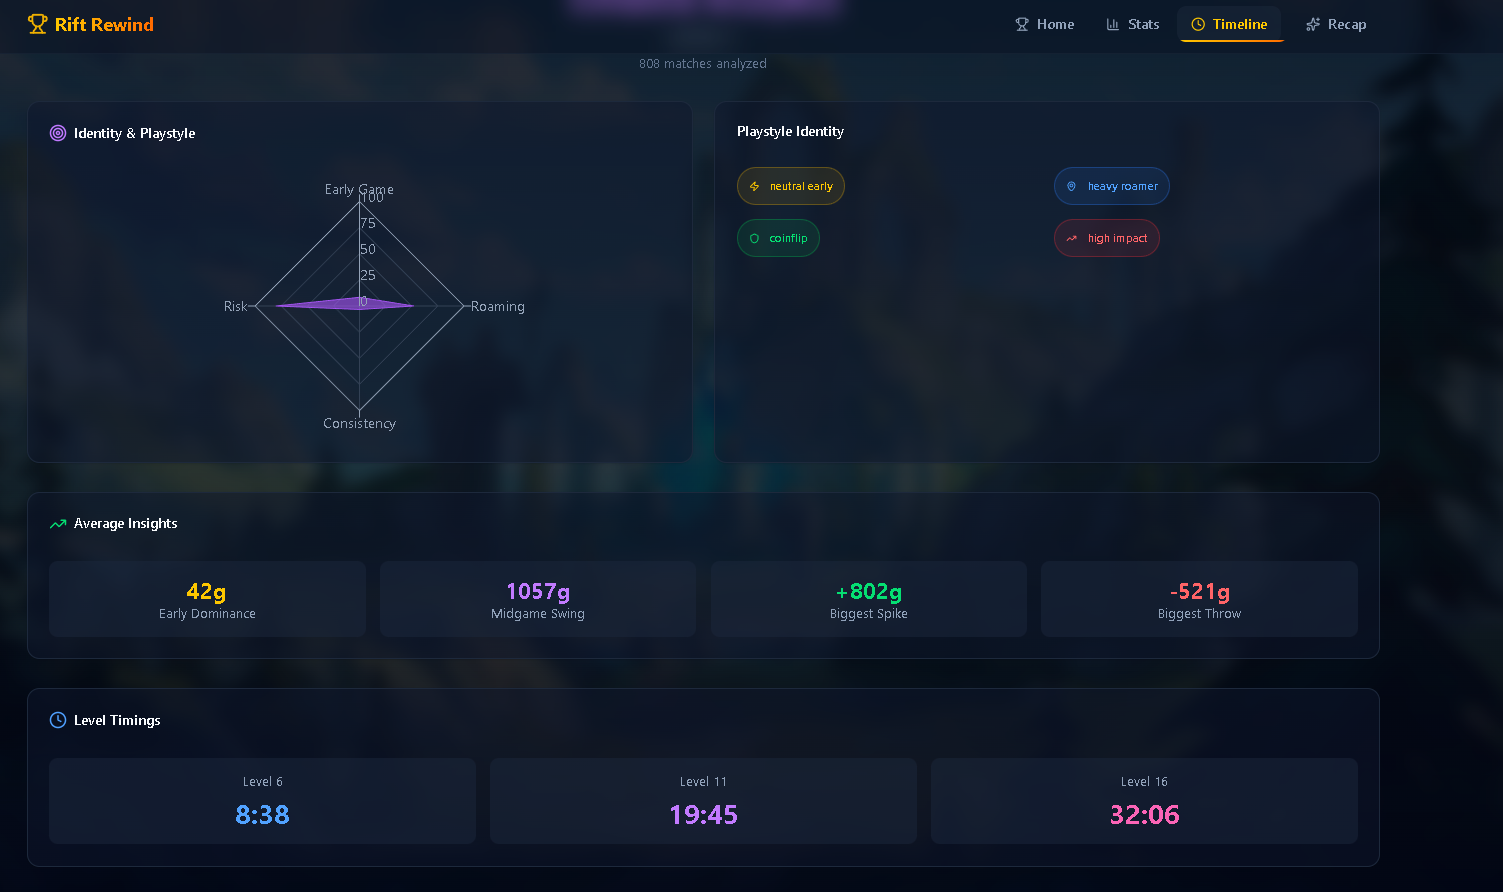
Playstyle identity visualized through radar metrics and AI-derived tags.
-
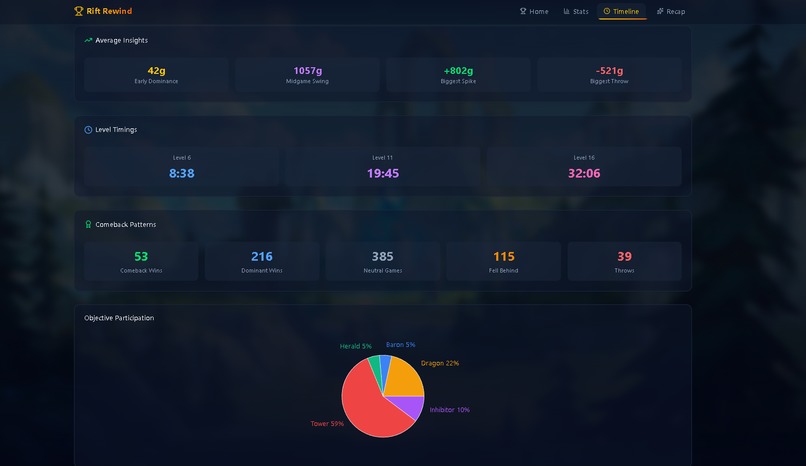
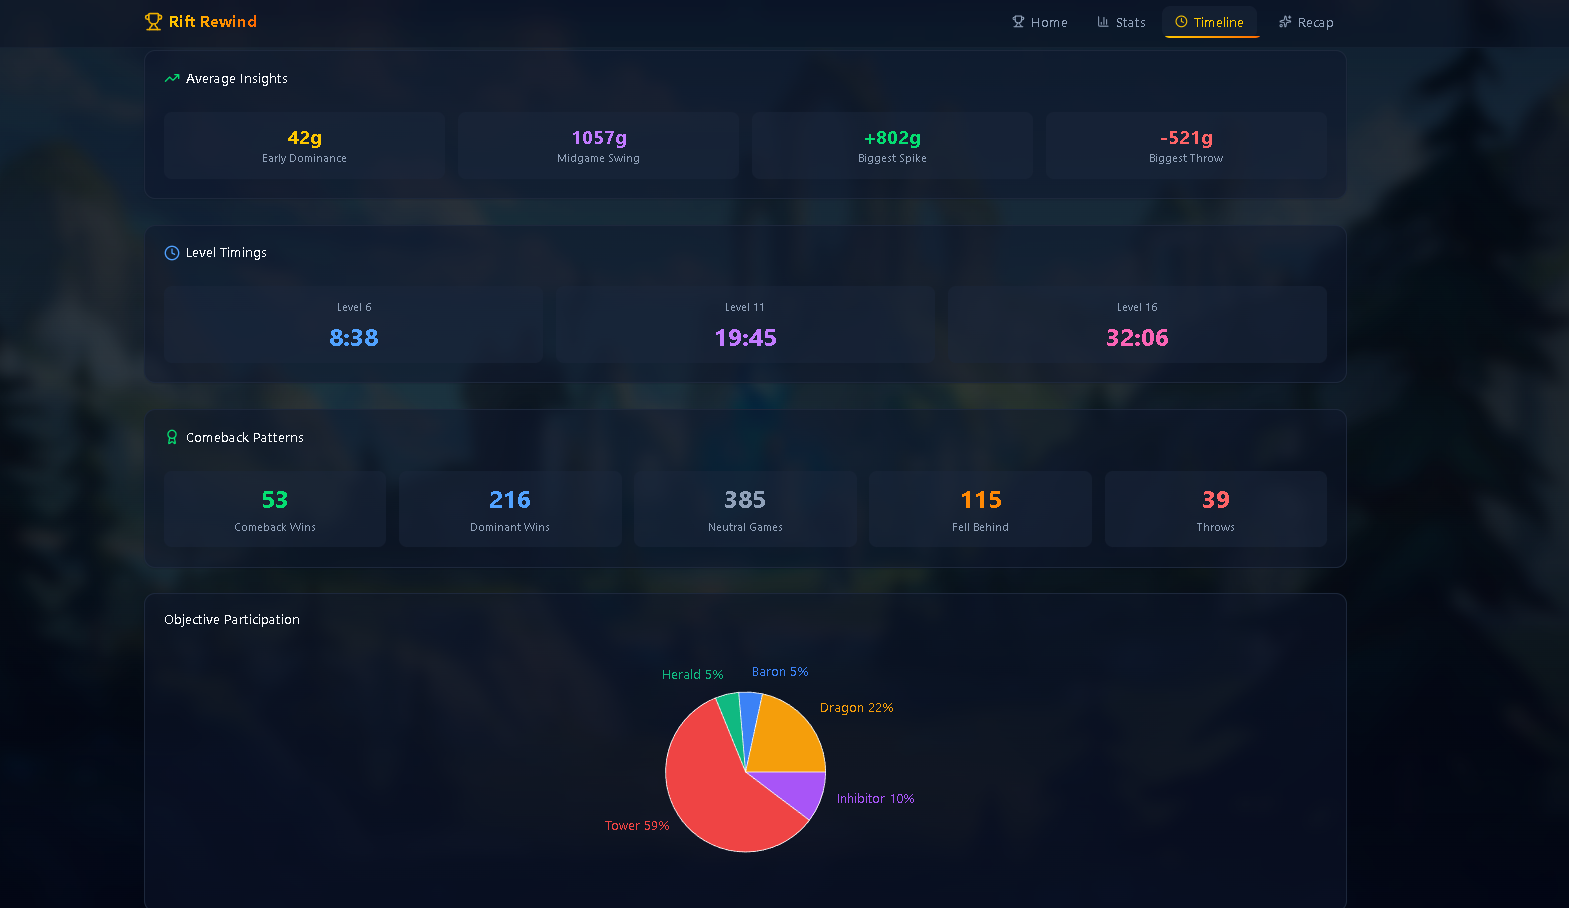
Timeline insights, power spike timings, comeback patterns, and objectives.
-
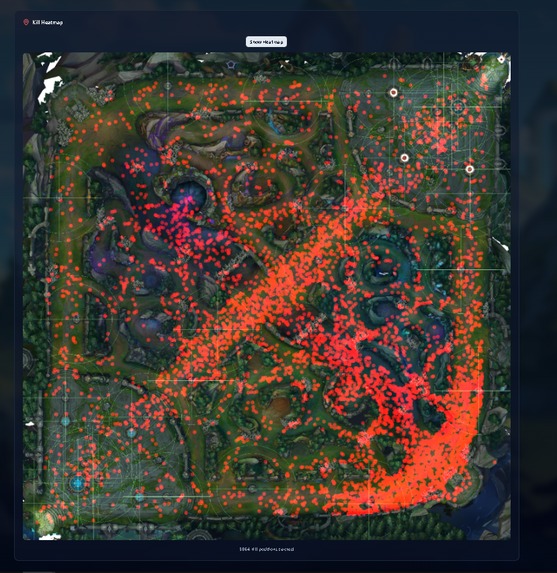
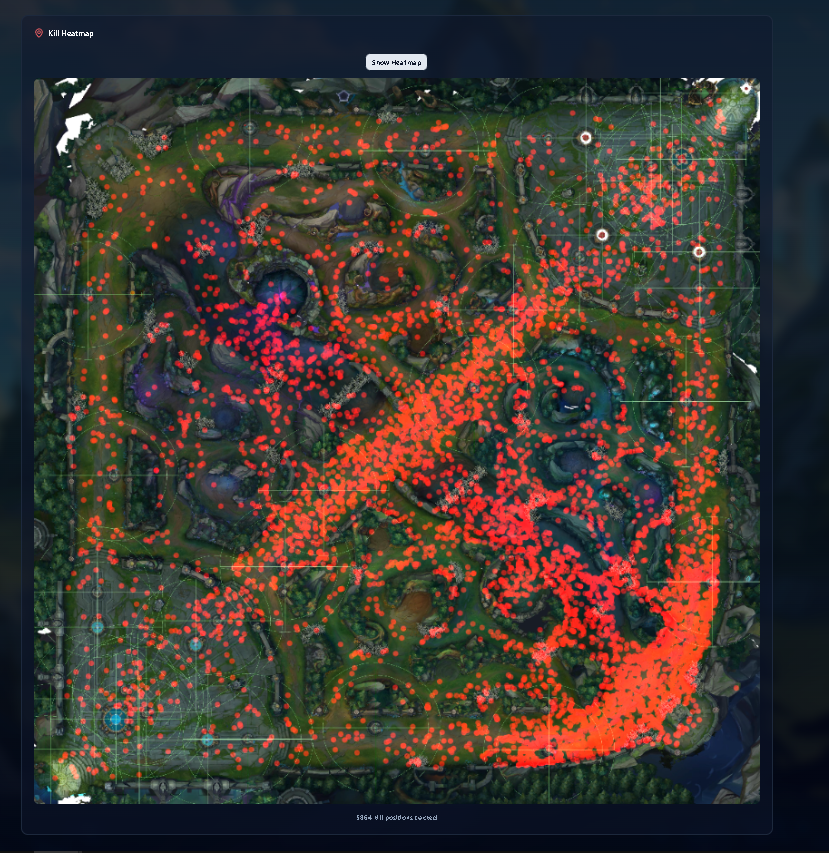
Full-season kill heatmap showing map pressure and positioning trends.
-
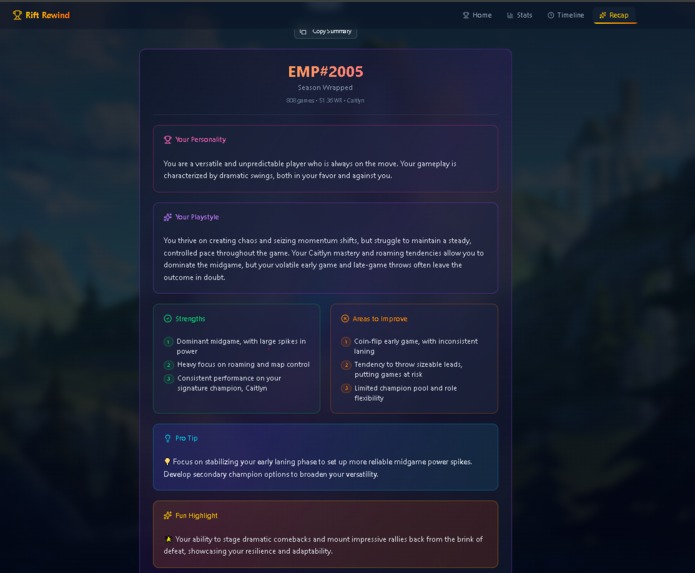
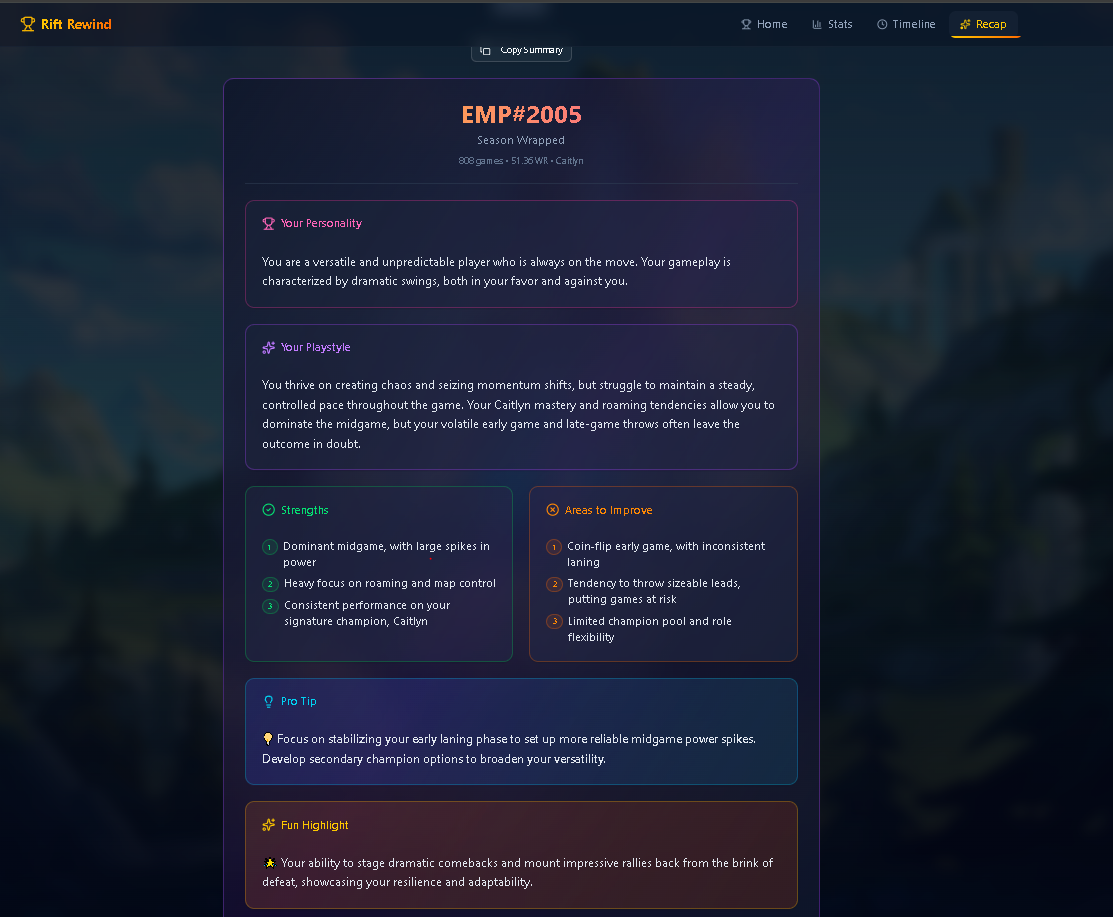
Personalized season summary powered by Amazon Bedrock, including strengths, weaknesses, playstyle analysis, and actionable improvement tips.
Inspiration
Most League stat sites are good at showing numbers, but they do not tell the full story of a player's season. They don’t explain long-term patterns, playstyle tendencies, map behavior, or how a player actually impacts games beyond isolated matches. I wanted to create a tool that analyzes an entire year of gameplay and produces insights that feel personal, meaningful, and immediately useful. That led to building Rift Rewind.
What It Does
Rift Rewind analyzes a full year of League of Legends match history and produces:
- Detailed performance statistics across hundreds of matches
- Timeline analytics including early game dominance, midgame swings, throws, and comebacks
- Role and champion trends
- Kill heatmaps across all matches played
- Monthly performance patterns and season-long trends
- A generated season recap using Amazon Bedrock that provides a personality profile, strengths, weaknesses, and a summary of your playstyle
The goal is to deliver an end-of-year experience that goes beyond traditional stat dashboards.
How It Was Built
Backend (Flask + PostgreSQL)
- Asynchronous pipeline using aiohttp to fetch and process large volumes of match data efficiently
- Riot API integration for match history, match details, and timeline data
- Database schema designed to support analytics across hundreds of matches
- Batch insertion, retry logic, region auto-detection, and rate-limit aware scheduling
- Timeline processing for gold swings, spike detection, kill positions, roaming, power spikes, and objective presence
- Amazon Bedrock used to generate personalized season recaps
Frontend (Next.js + TypeScript)
- Built with Next.js App Router and TypeScript
- Animated UI constructed with Tailwind CSS, shadcn/ui, Radix primitives, and Framer Motion
- Recharts for data visualizations (radar, line, bar, and pie charts)
- Canvas-based rendering for kill heatmaps
- Fully responsive design for desktop and mobile
Cloud and Deployment
- Frontend deployed on Vercel
- Backend deployed on a cloud platform (Render/Railway)
- PostgreSQL used for persistent storage
- Amazon Bedrock for AI model inference
Challenges
- Handling Riot API rate limits while fetching hundreds of matches
- Designing a scalable timeline processing system that stays performant
- Creating accurate heatmaps required transforming raw in-game coordinates into canvas coordinates
- Ensuring SQL inserts remained consistent under concurrency
- Prompt engineering for producing useful and consistent AI-generated recaps
What We Learned
- Building asynchronous systems that work under strict rate limits
- Database design for analytics workloads
- Advanced prompt engineering for actionable game insights
- Creating modern, animated UIs with Next.js and Framer Motion
- Integrating Amazon Bedrock into a real production workflow
What's Next
- Player vs player comparisons
- Shareable season recap cards
- Champion-specific coaching insights
- More granular timeline analysis
- Automated highlight reel generation
Built With
- 3
- aiohttp
- amazon-web-services
- api
- bedrock
- canvas
- claude
- css
- flask
- framer
- games
- haiku
- html
- motion
- next.js
- postgresql
- python
- radix
- railway
- react
- recharts
- render
- riot
- shadcn/ui
- sqlalchemy
- tailwind
- typescript
- ui
- vercel

Log in or sign up for Devpost to join the conversation.