-
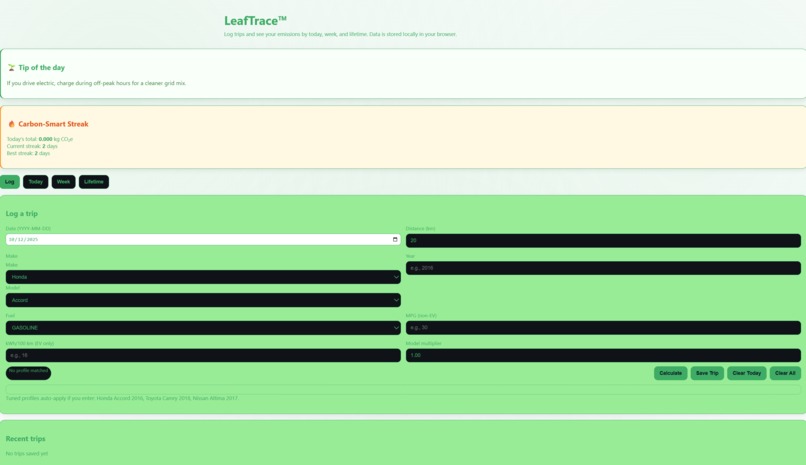
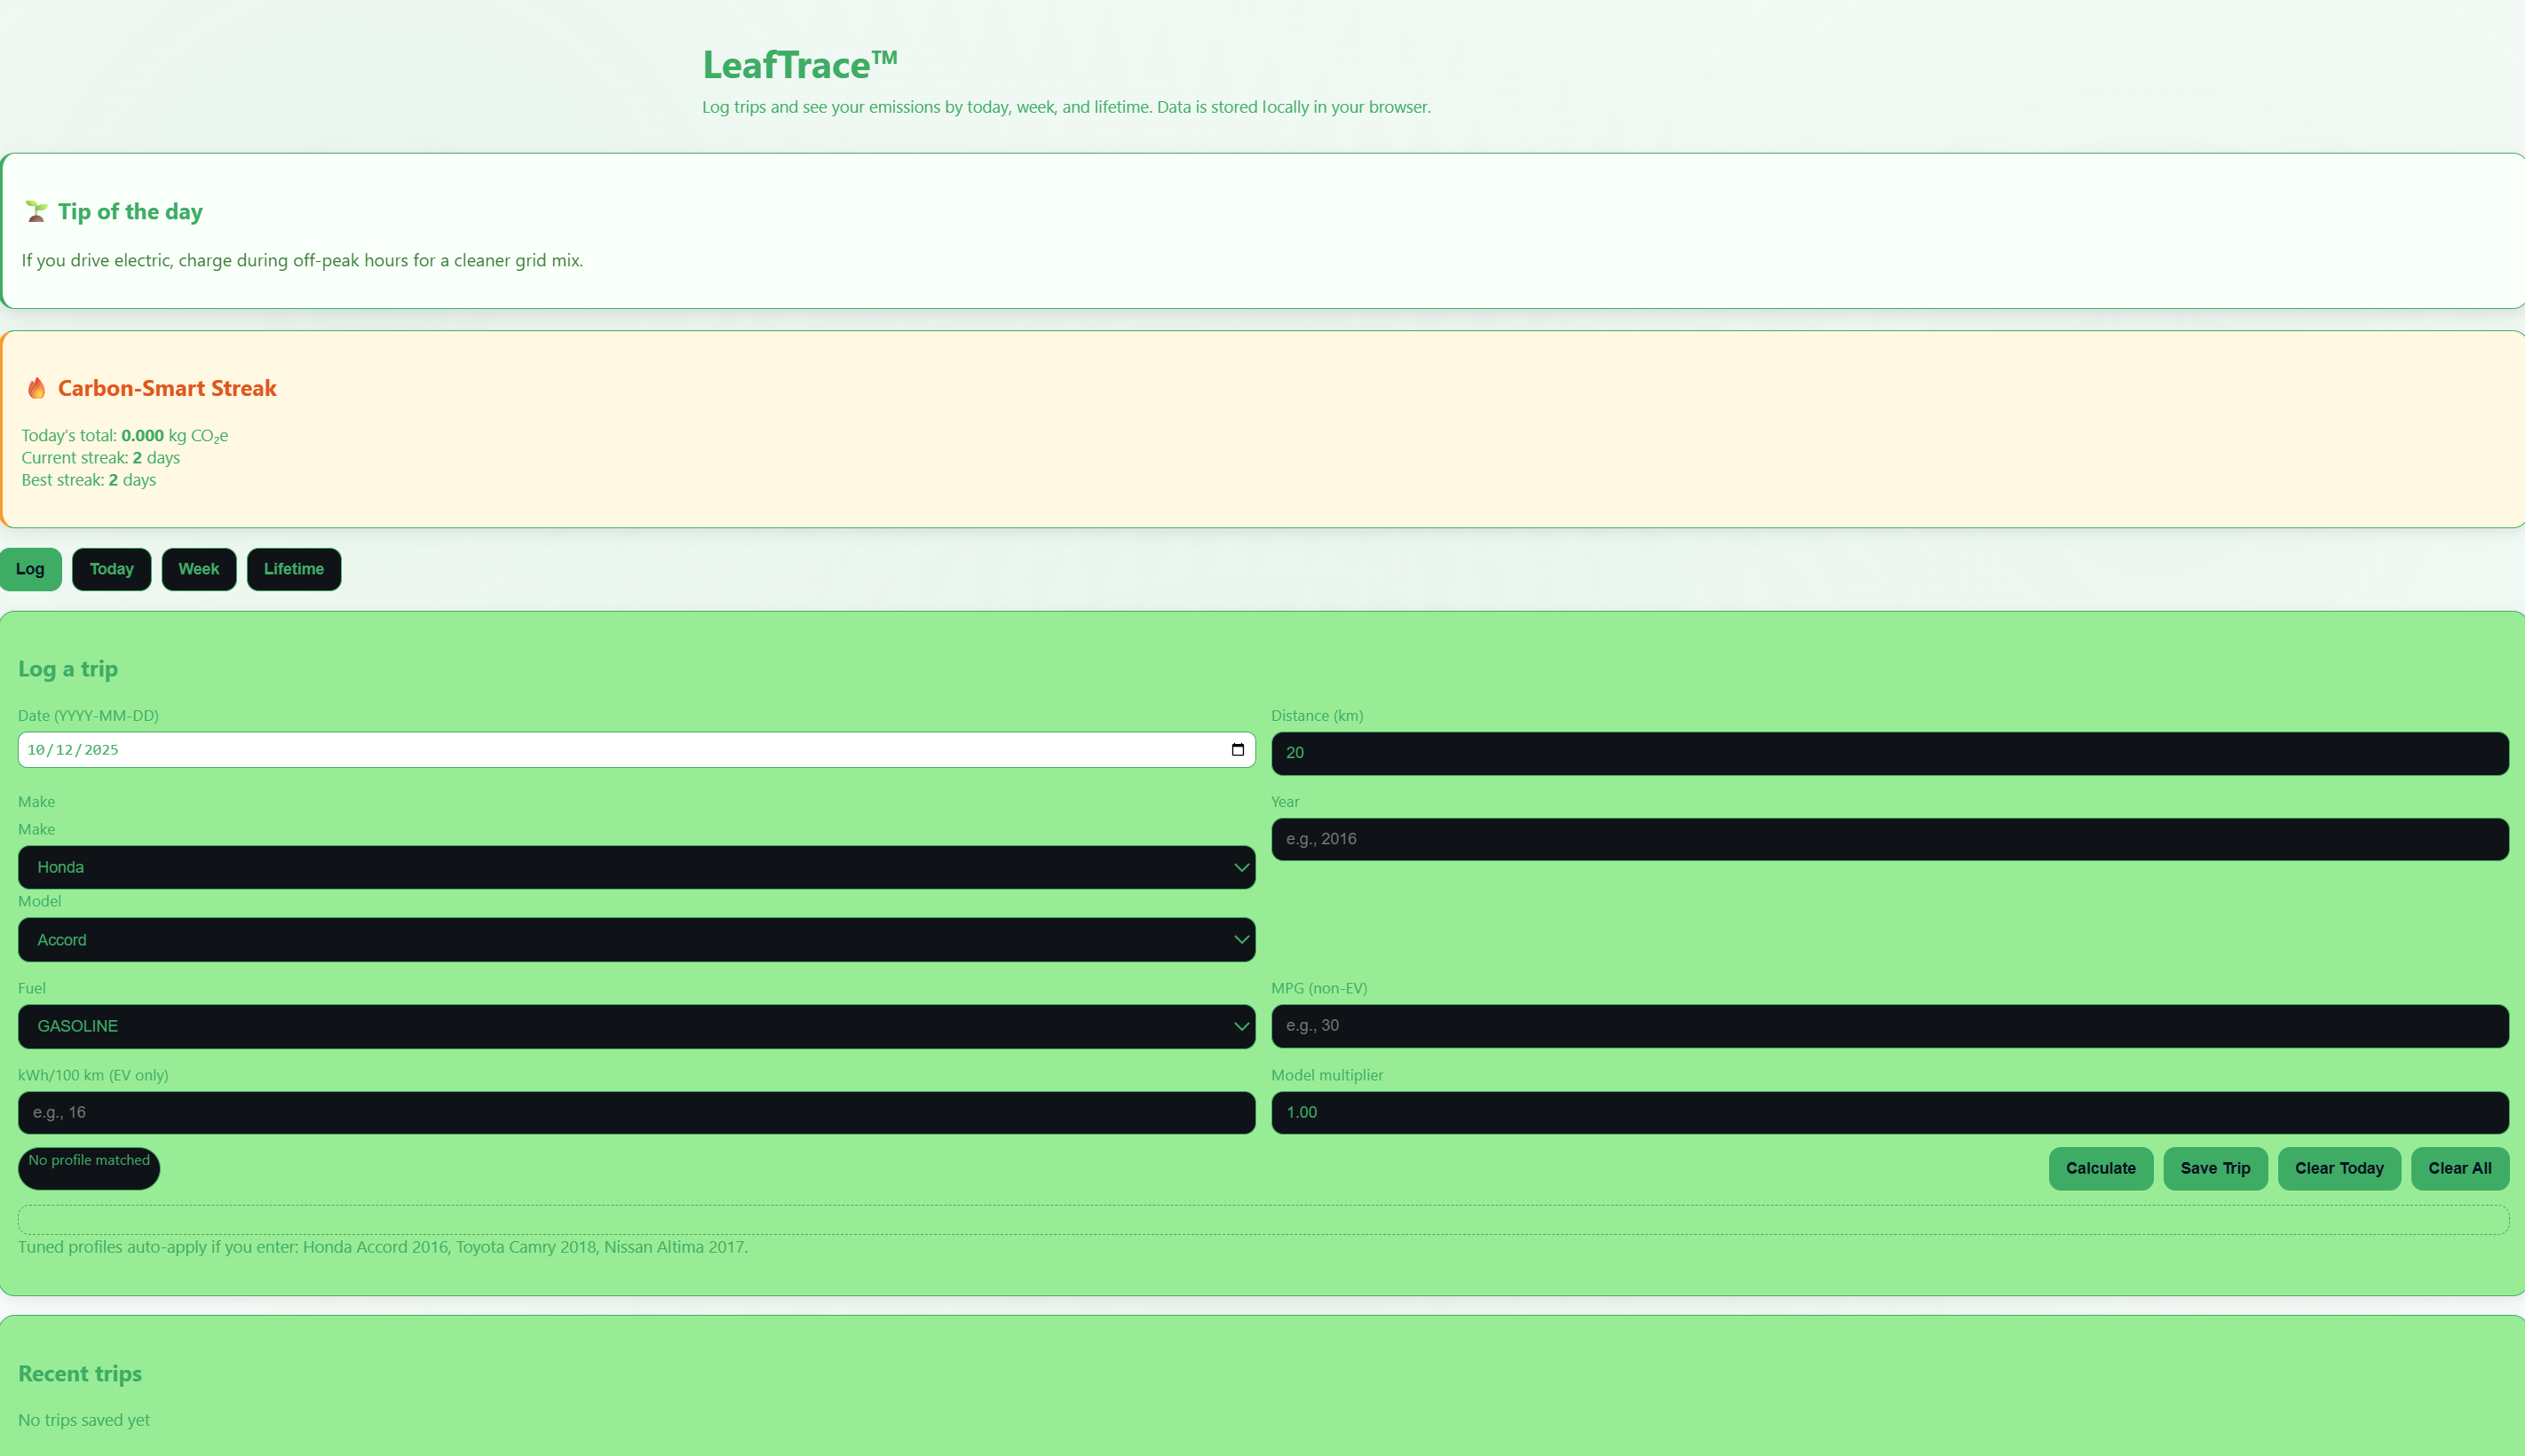
Home Page
-
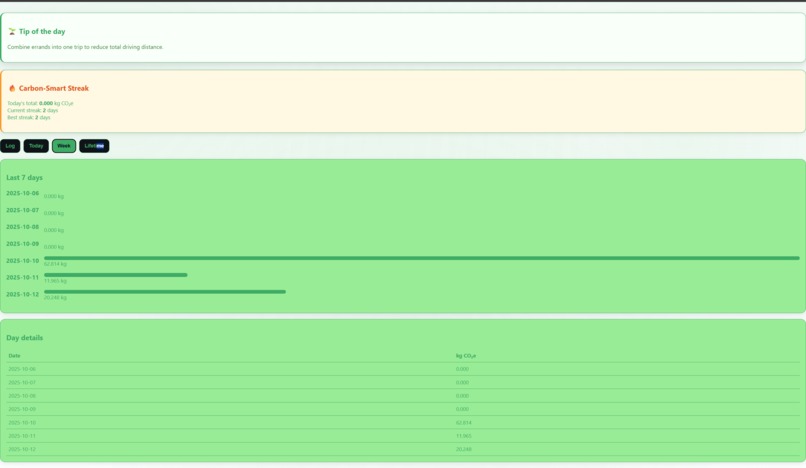
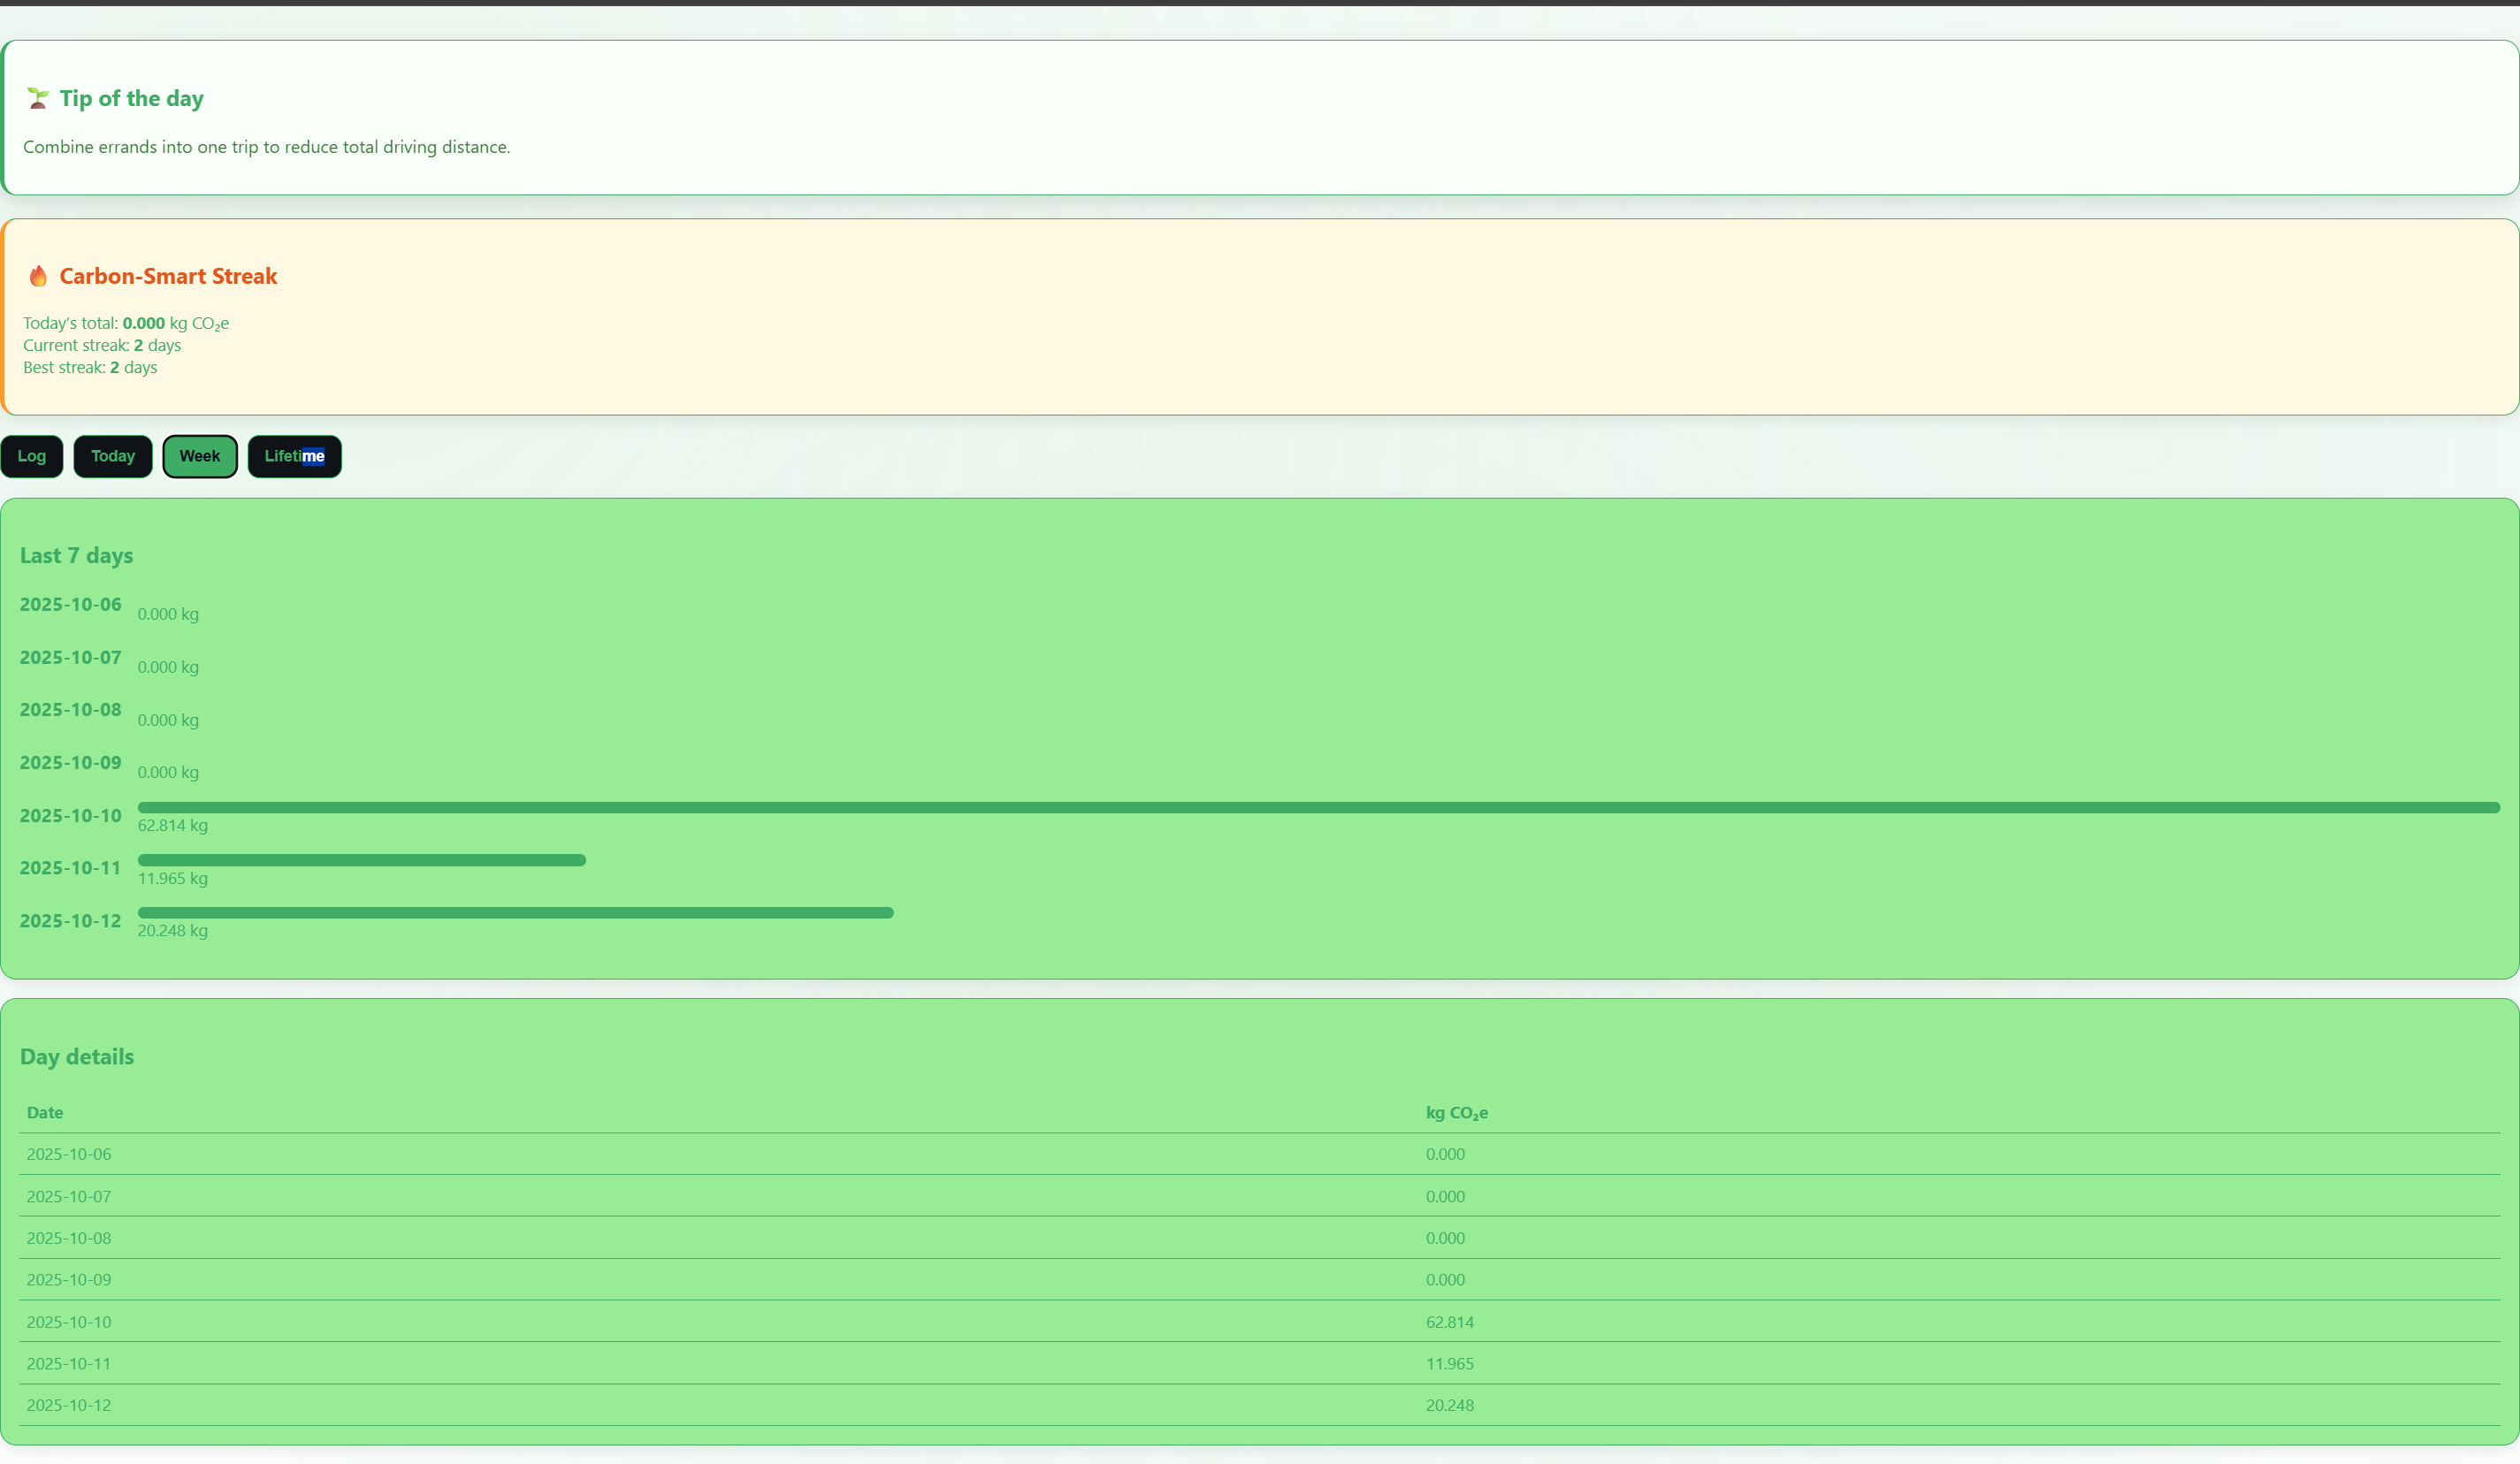
Weekly page
Inspiration
We wanted to create something that makes climate awareness personal and actionable. Most people know that transportation produces emissions, but few realize how much their daily drives contribute. Our idea was to make an accessible, no-signup carbon tracker that anyone can use even offline to visualize their impact and start improving it. LeafTrace™ was born out of a desire to combine sustainability, transparency, and good UX into one small but meaningful tool.
What it does
LeafTrace™ lets users: Log their trips by date, distance, car make/model/year, and fuel type. Calculate real-world CO₂e emissions for gas, diesel, hybrid, and electric vehicles. See analytics by today, week, and lifetime totals. Track “Carbon-Smart Streaks” — days where total emissions stay below 20 kg CO₂e. Get daily carbon-reduction tips for better driving habits. Store all data locally, ensuring privacy and zero backend dependency.
How we built it
Frontend: HTML + CSS + JavaScript Data Storage: Browser localStorage Design: Modern flat UI with green accent palette, responsive layout, and hover animated cards Logic: Emission formulas based on EPA data and average grid intensity for EVs UI Behavior: Dynamic dropdowns for car models, tabbed navigation, and live refresh for all stats
Challenges we ran into
Designing one calculation flow that handles gas, diesel, hybrid, and electric vehicles consistently Managing tab states and keeping UI synced with localStorage Making the app visually engaging without any external CSS frameworks Debugging edge cases for dates and streak tracking across different time zones Ensuring data persisted correctly after clearing or refreshing the browser
Accomplishments that we're proud of
Built a fully functional web app with no backend dependencies Achieved a smooth, responsive interface entirely in vanilla JavaScript Implemented a fun and motivating Carbon-Smart Streak system Created a privacy-by-design tool — no sign-up, no tracking, just you and your data Added eco-friendly micro-interactions like daily tips to keep users engaged
What we learned
How to design for sustainability and behavior change, not just utility How much you can accomplish with pure JavaScript and localStorage The importance of UX simplicity making green tech friendly, not intimidating That small, local tools can inspire awareness just as much as big data dashboards
What's next for LeafTrace™
Export and import trips (CSV/JSON) Integrate visual charts (e.g., Chart.js for emissions trends) Add more transportation types — flights, buses, biking, walking Option to offset emissions through verified carbon credits Convert into a Progressive Web App (PWA) for offline use and mobile install Smart notifications for daily streak reminders


Log in or sign up for Devpost to join the conversation.