


About the Project
Inspiration
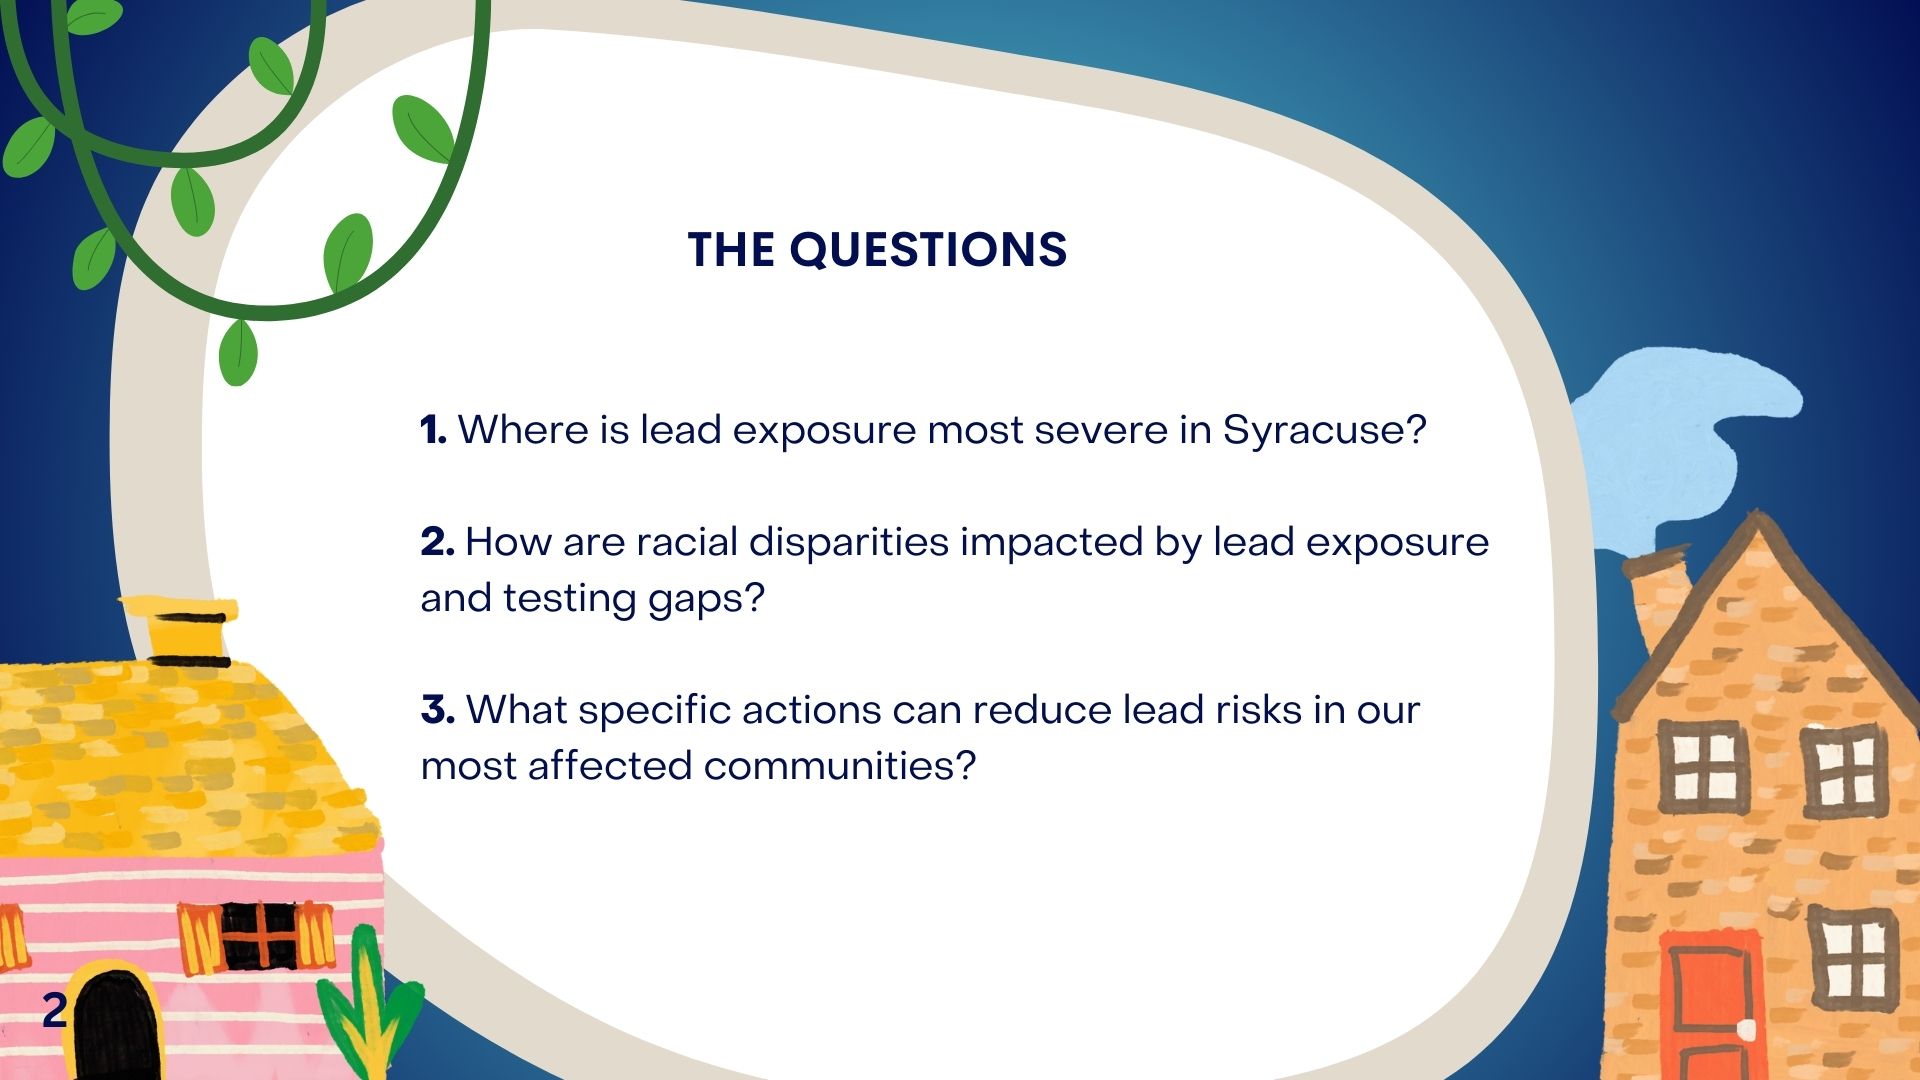
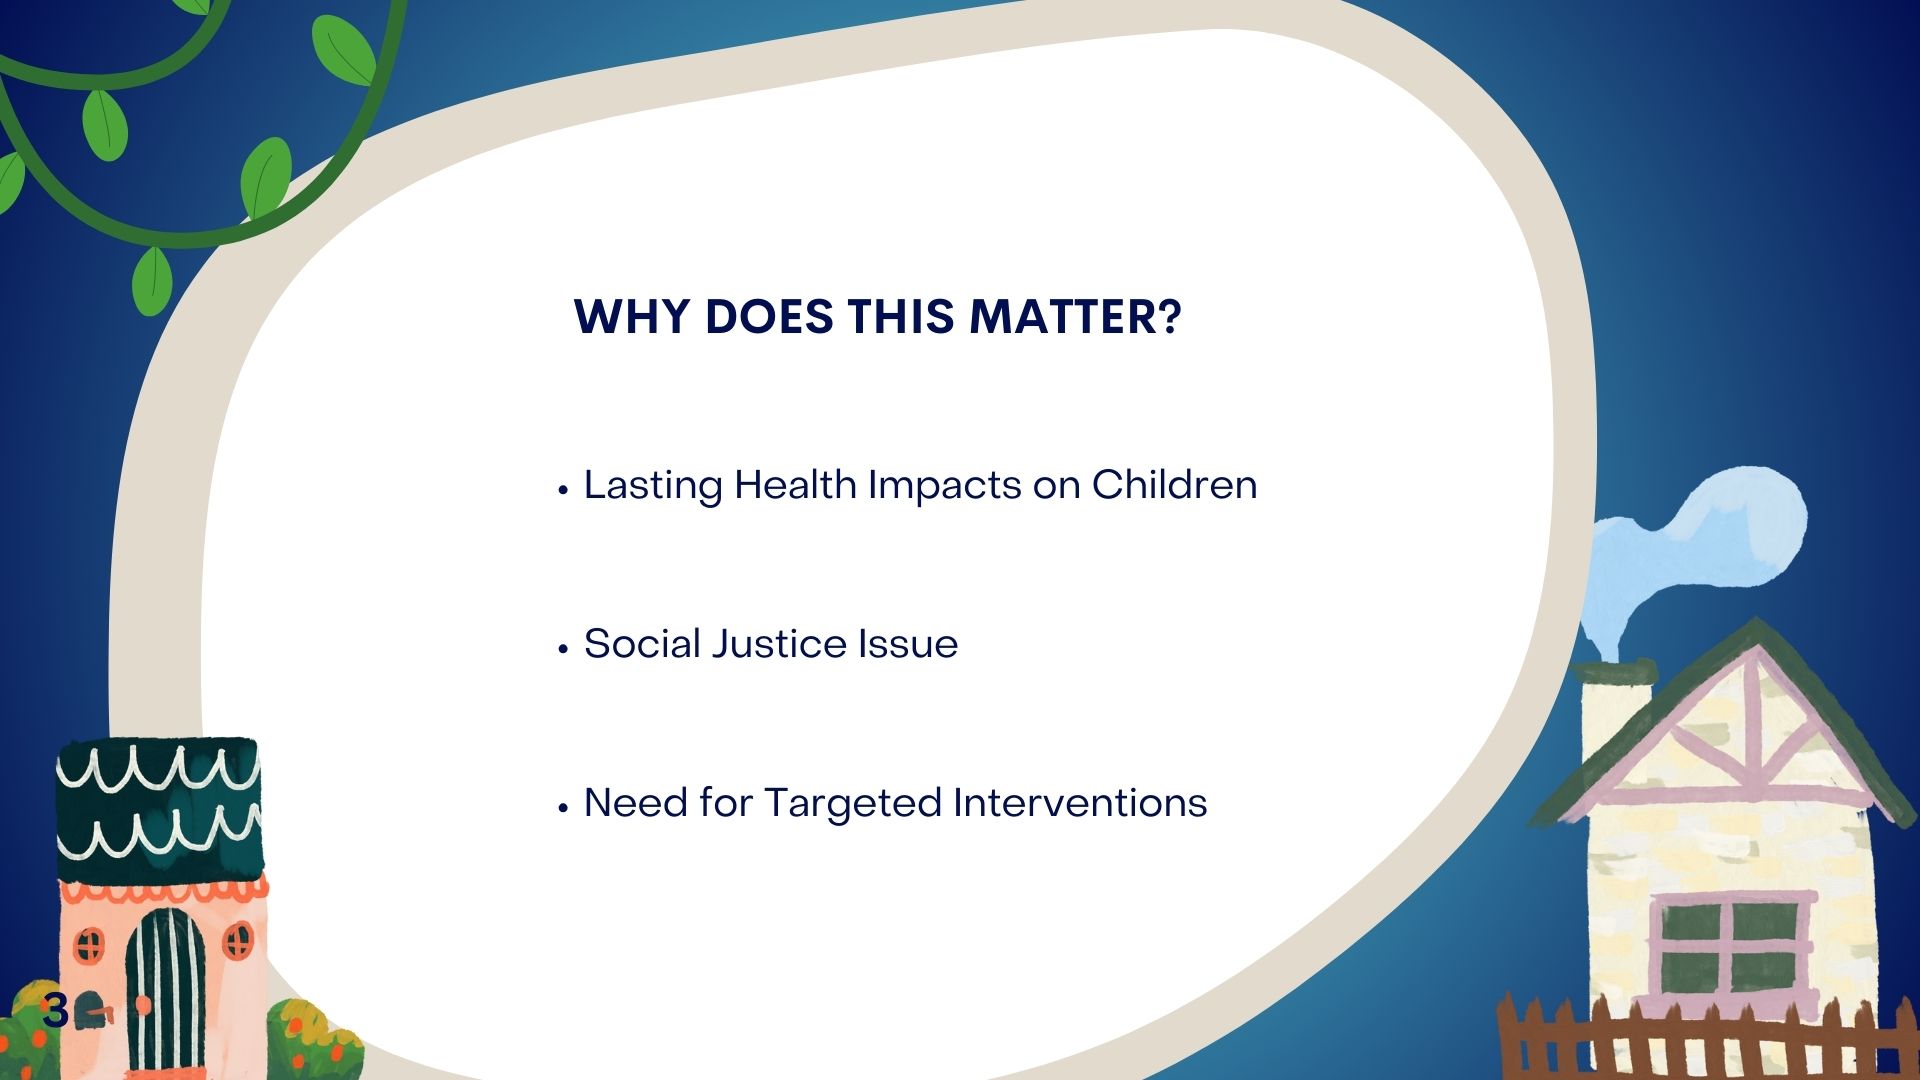
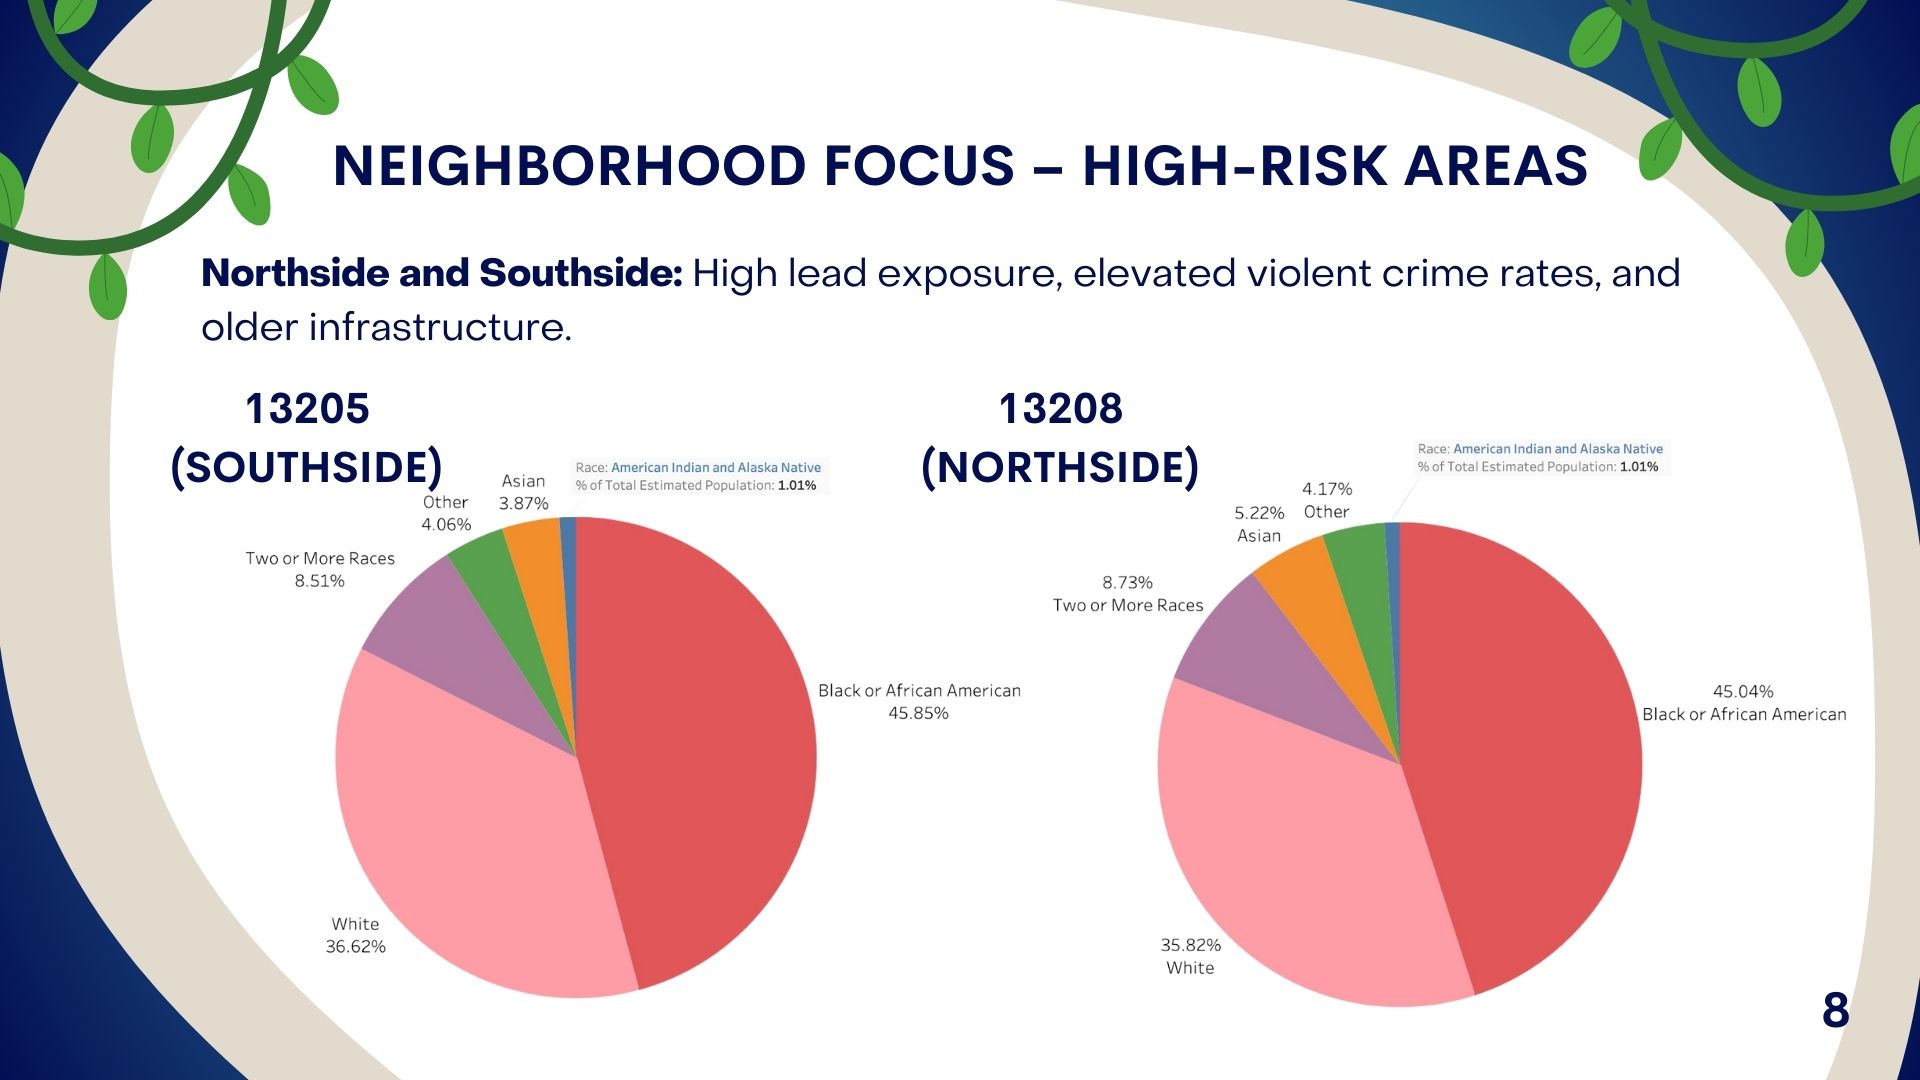
The inspiration for this project stemmed from the alarming rates of lead exposure in Syracuse’s high-risk neighborhoods, particularly among Black and Hispanic communities. Lead poisoning has severe, lifelong impacts on children's health, affecting cognitive development, learning abilities, and overall well-being. Yet, despite its preventable nature, lead exposure continues to harm vulnerable communities. Our goal was to create a data-driven approach that reveals the scale of the issue, highlights racial and geographic disparities, and proposes targeted actions to reduce lead risks in Syracuse.
What We Learned
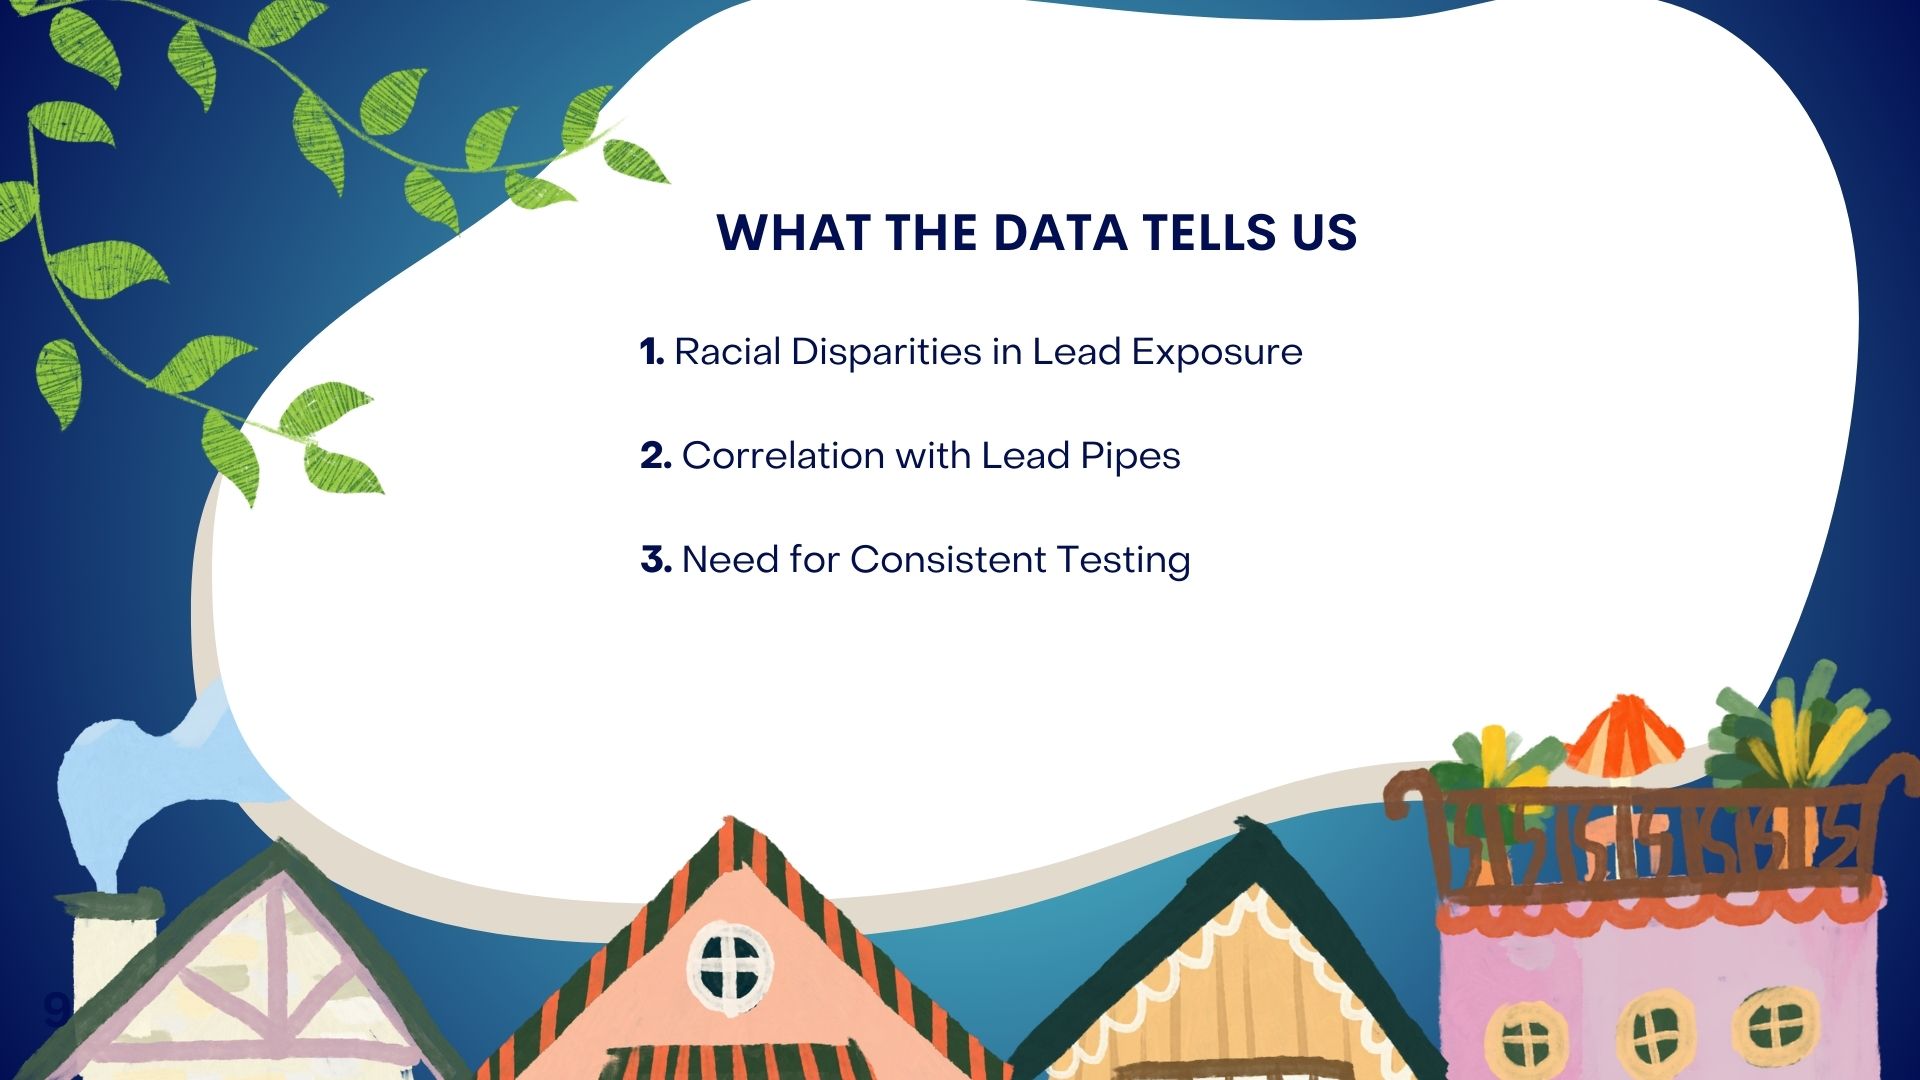
Through this project, we gained a deeper understanding of how systemic inequalities intersect with public health. We learned:
- The significant role outdated infrastructure plays in exposing minority communities to lead.
- The limitations of current testing practices, especially the lack of consistent and standardized lead testing across neighborhoods.
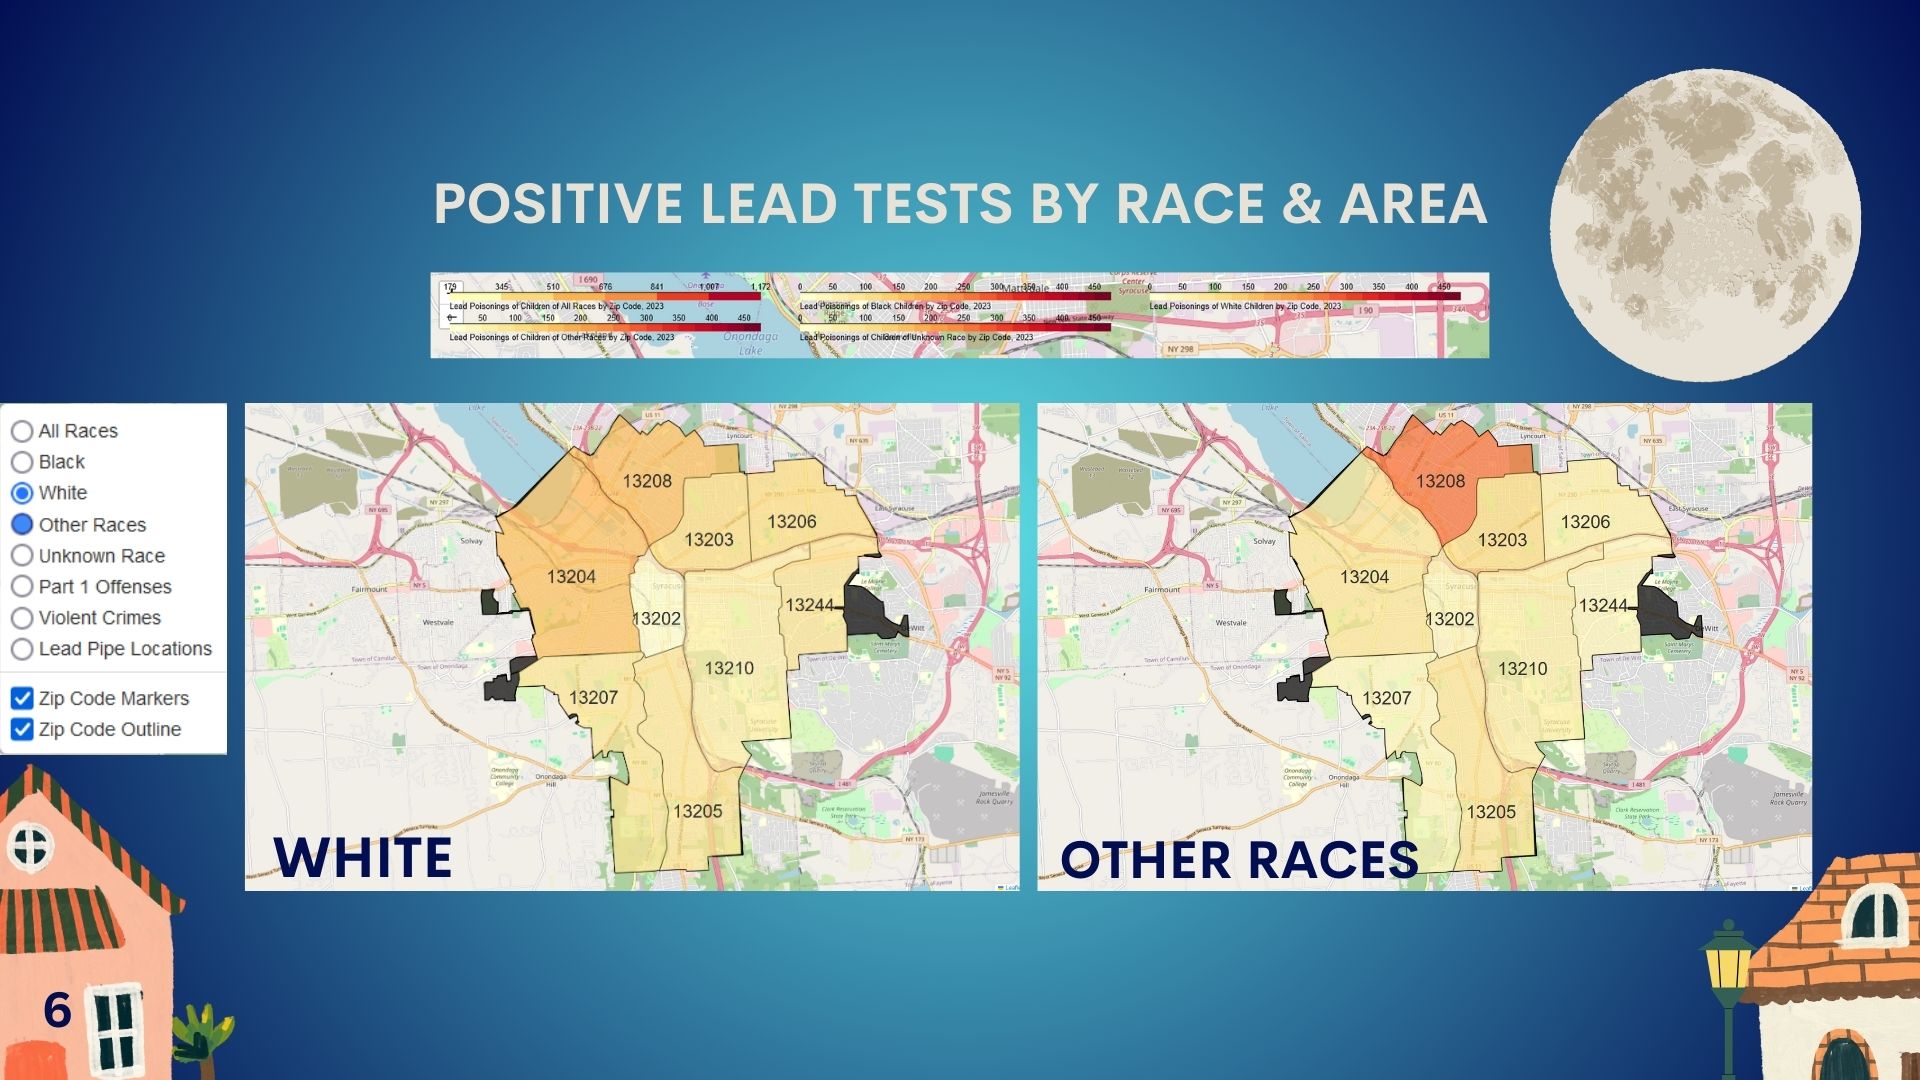
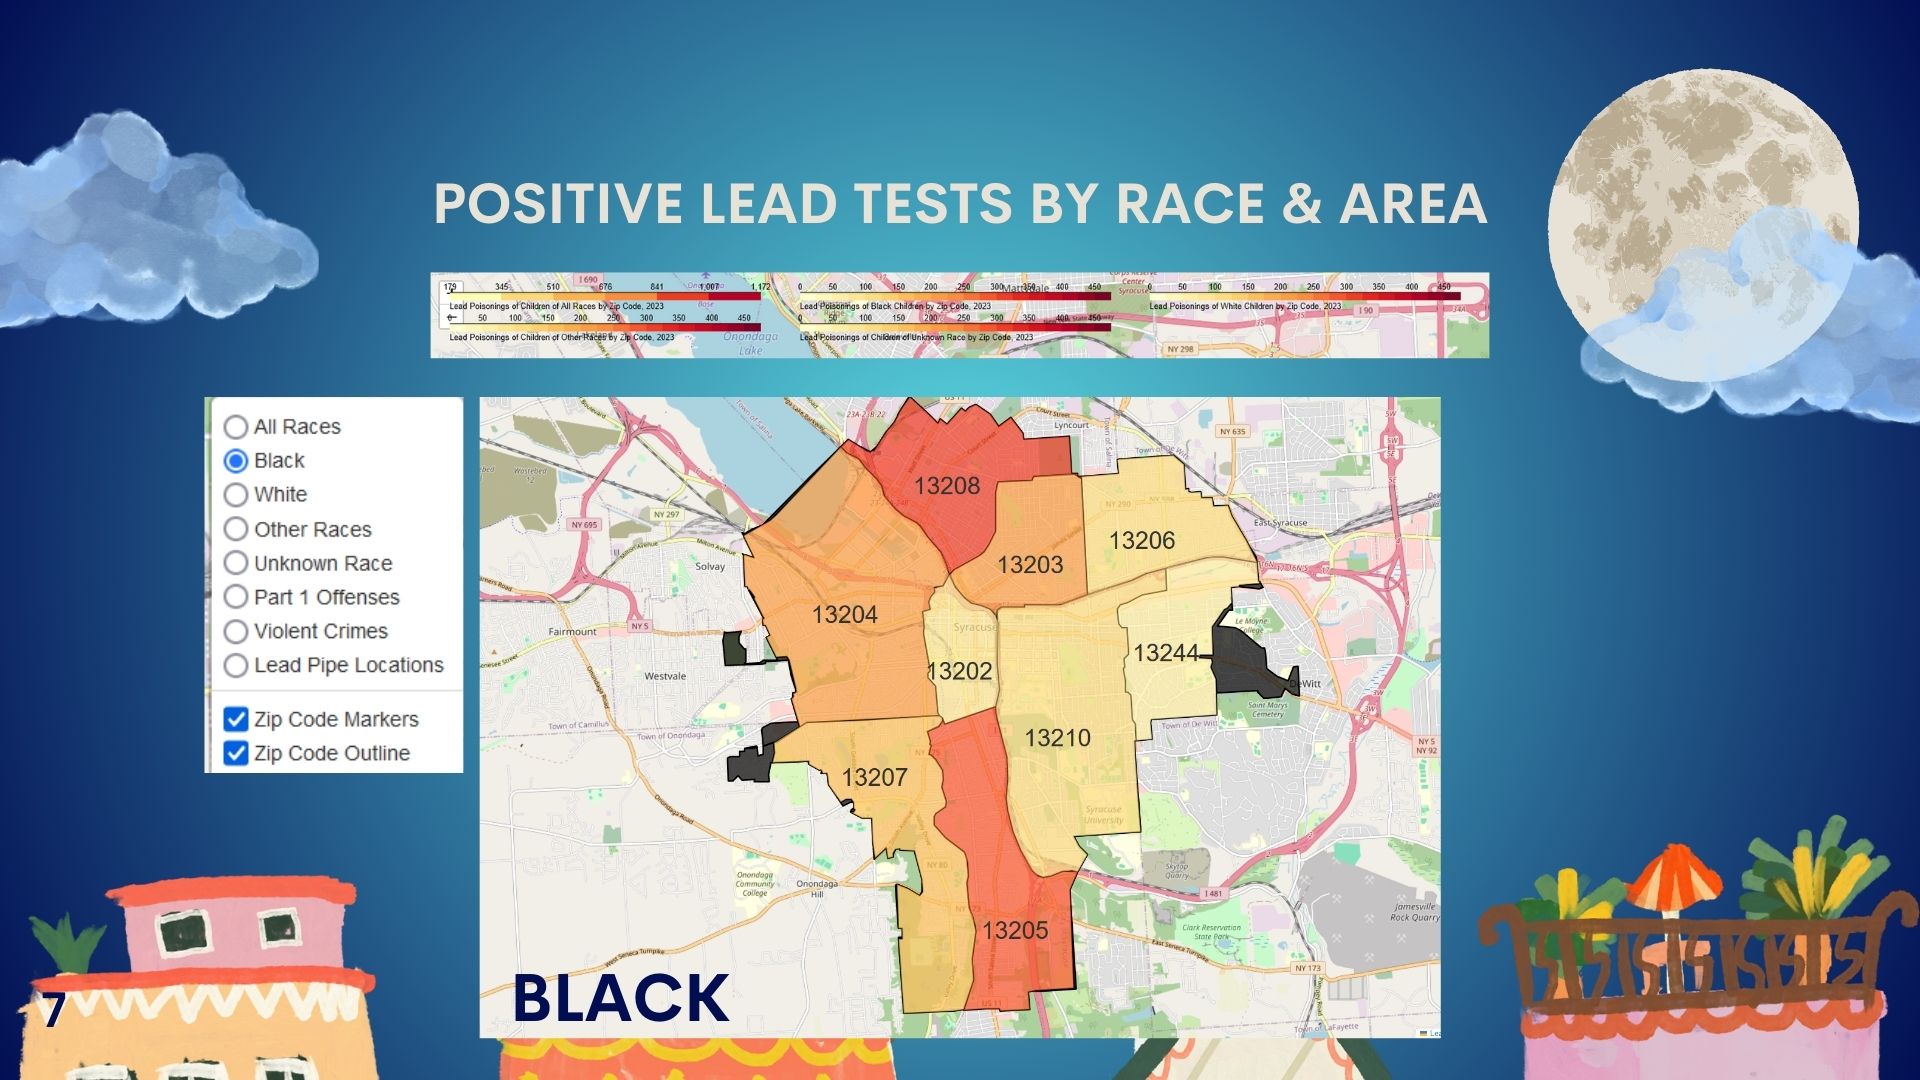
- How mapping tools and data visualization can effectively highlight disparities and drive focused policy recommendations.
How We Built the Project
We used a combination of data analysis and mapping to uncover patterns of lead exposure in Syracuse:
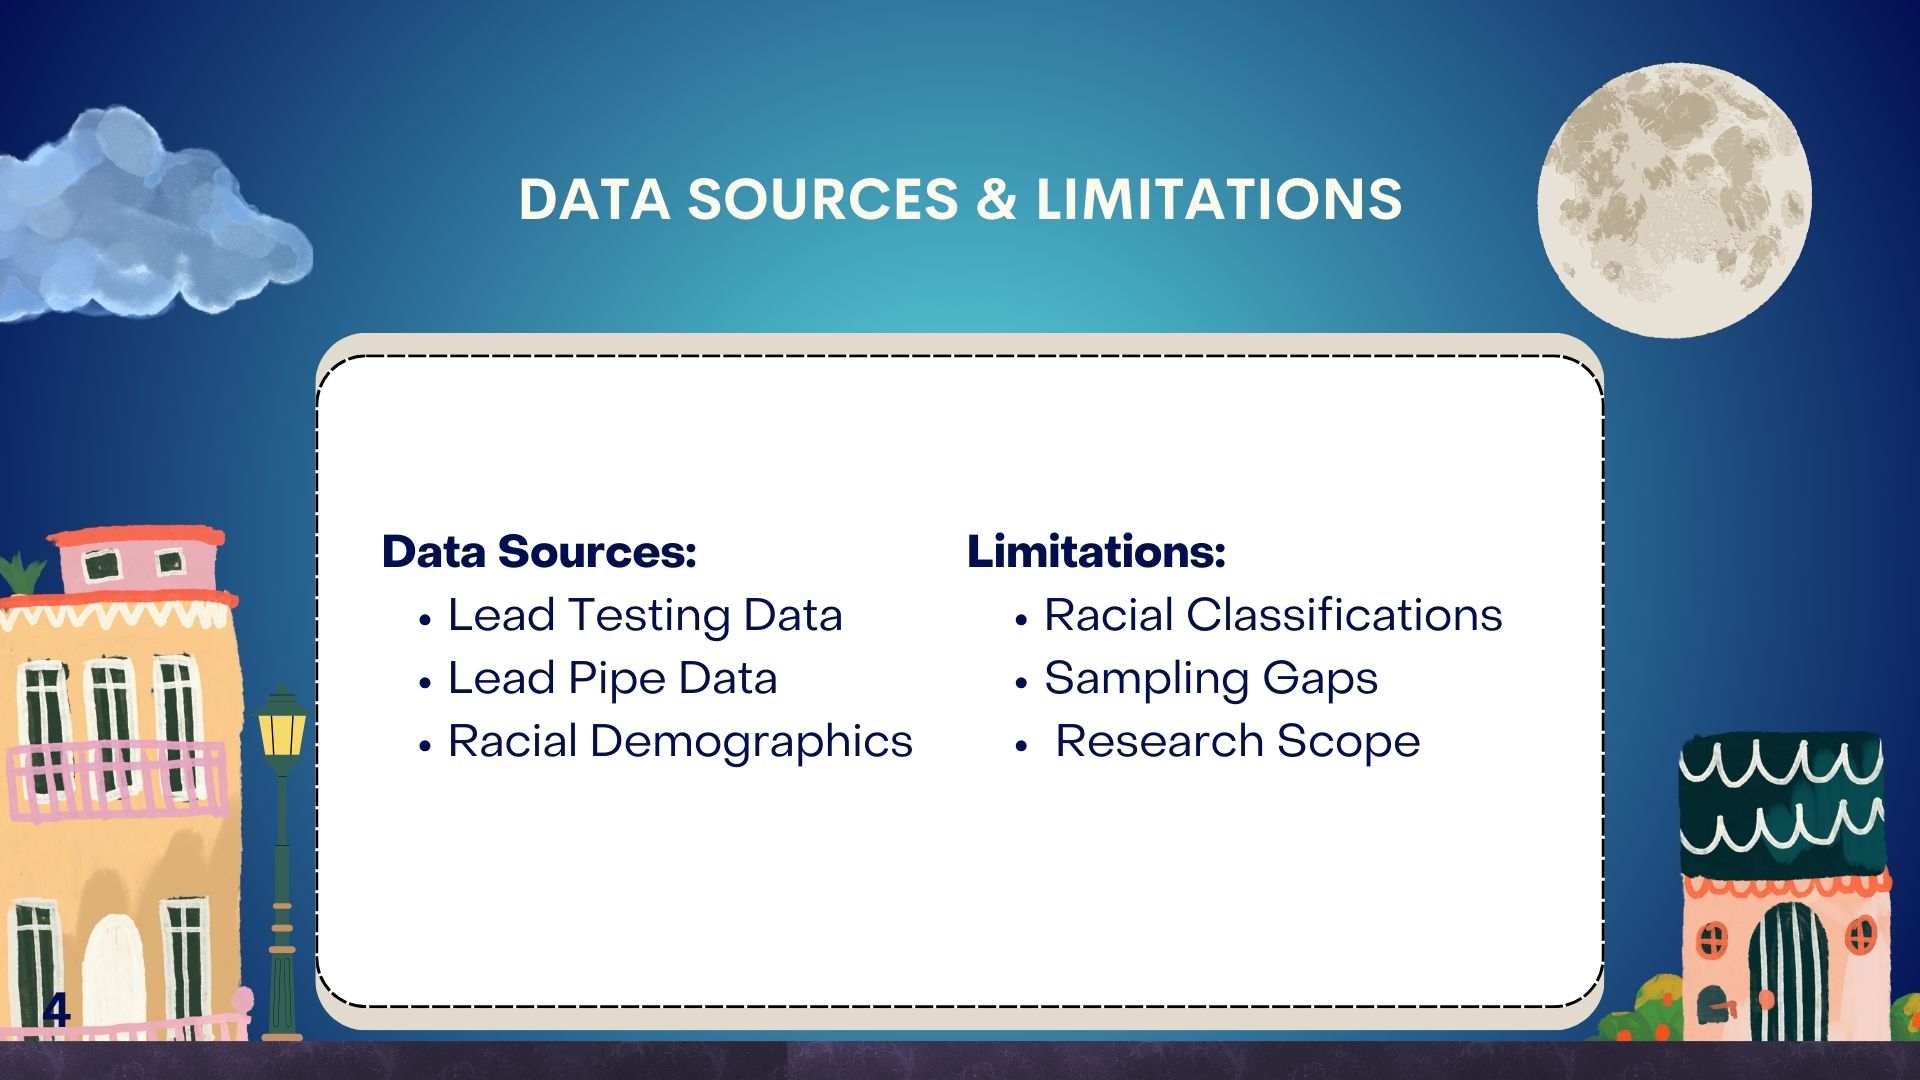
- Data Collection: We gathered data from Syracuse’s open data portal, including lead testing rates, lead pipe distribution, racial demographics, and neighborhood-level information.
- Data Cleaning & Analysis: Using Python libraries like Pandas and Geopandas, we cleaned and analyzed the data to focus on high-risk areas.
- Visualization: We utilized Folium and Matplotlib to create layered maps that show lead exposure rates alongside neighborhood demographics and lead pipe distribution, providing a clear picture of disparities.
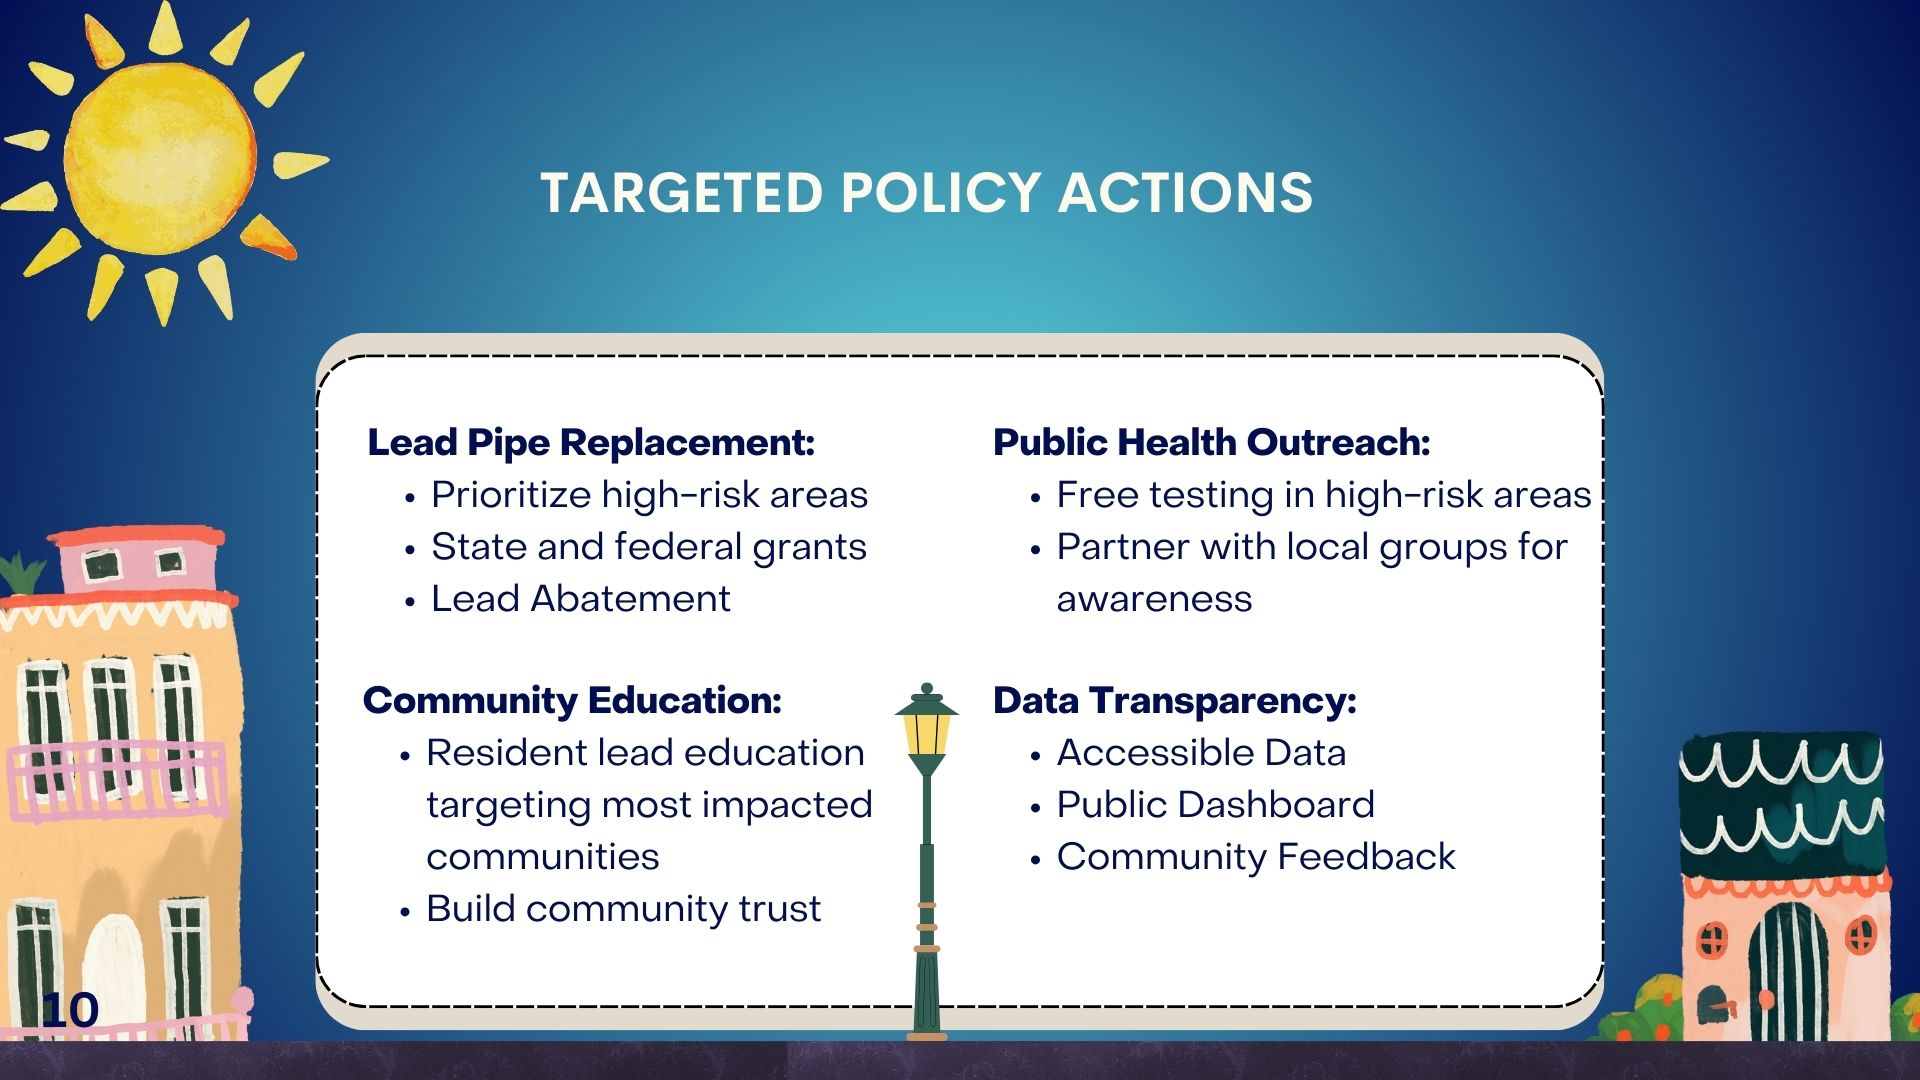
- Policy Recommendations: Based on our findings, we crafted specific policy recommendations to replace lead pipes, enhance testing, and increase public awareness in affected communities.
Challenges We Faced
We encountered several challenges throughout this project:
- Data Limitations: Incomplete and inconsistent testing data limited our ability to assess the full scope of lead exposure.
- Racial Classifications: The dataset only included broad racial categories, reducing the granularity of our analysis for specific ethnic groups.
- Mapping Complexity: Overlaying multiple data layers on maps while maintaining clarity required careful adjustments to avoid cluttered visuals.
Despite these challenges, we successfully highlighted the need for urgent, targeted actions to protect Syracuse’s most vulnerable populations from lead exposure.
Built With
- Python: For data cleaning and analysis
- Geopandas & Pandas: For geospatial and tabular data manipulation
- Folium & Matplotlib: For data visualization and mapping
- Syracuse Open Data Portal: Data source for lead testing, demographics, and infrastructure information

Log in or sign up for Devpost to join the conversation.