-
-
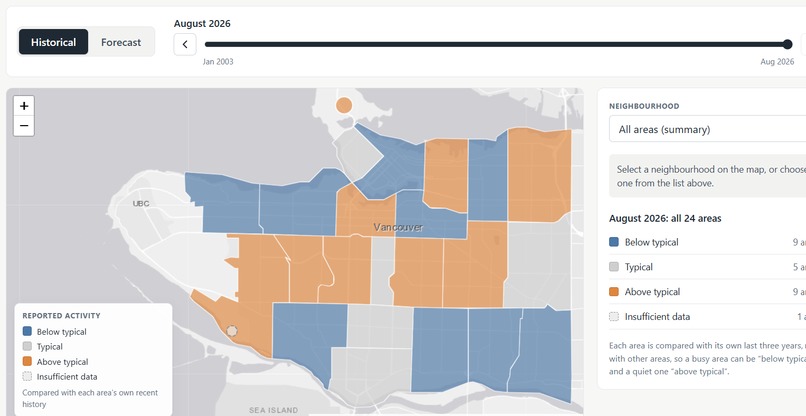
First raw version of the front end
-
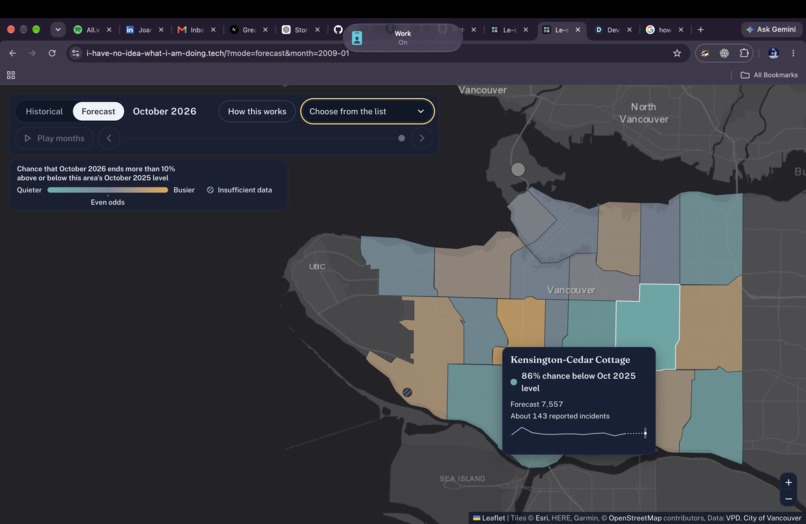
Screenshot of the final map layout in the front end
Inspiration
Moving to a new Vancouver neighbourhood, visiting somewhere unfamiliar, or planning a night out in a shady area. Le-Safety helps people explore reported-incident trends before they go in person without reducing communities or people to a “safe” or “unsafe” label.
What it does
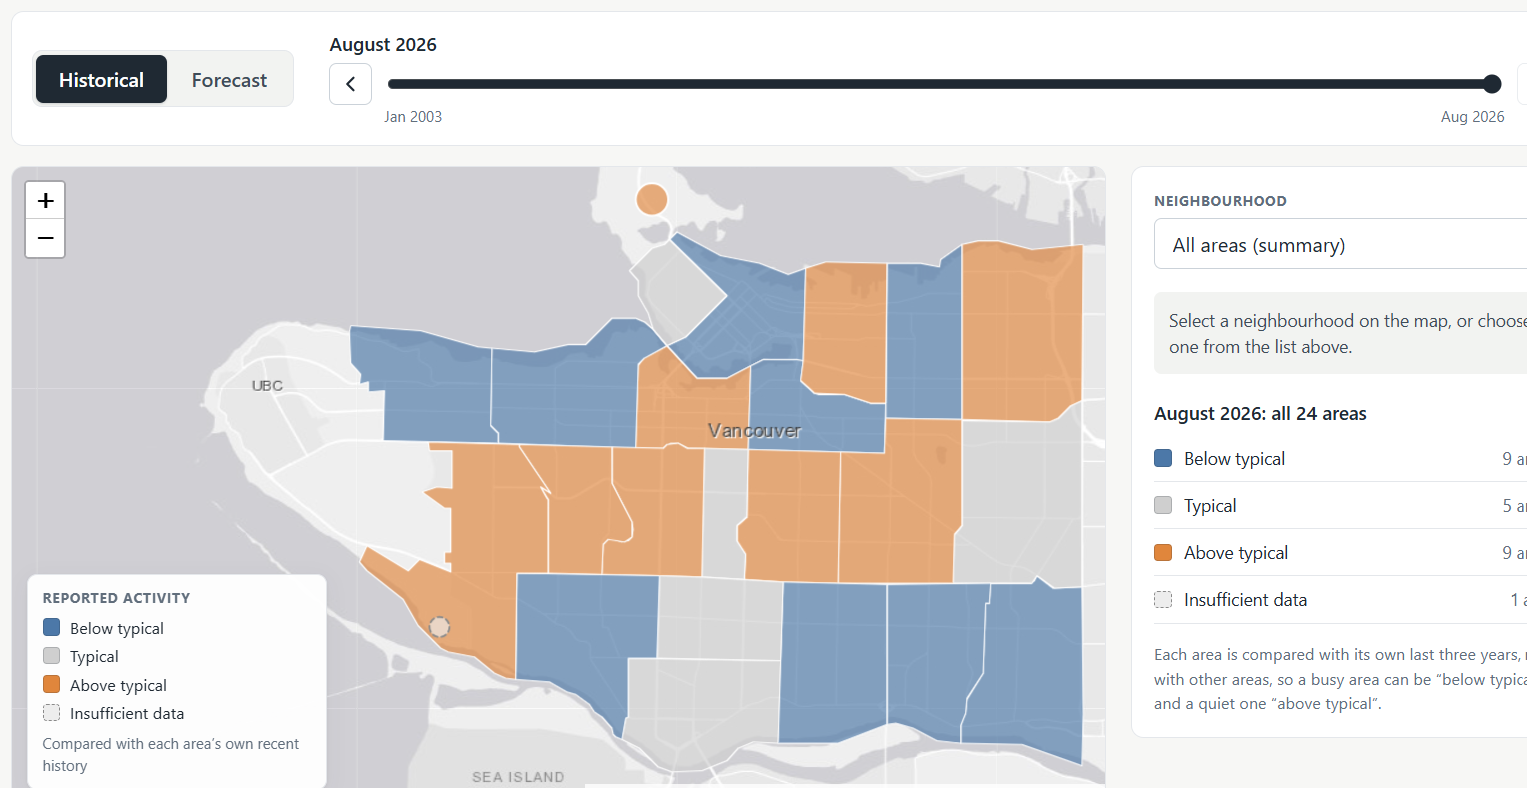
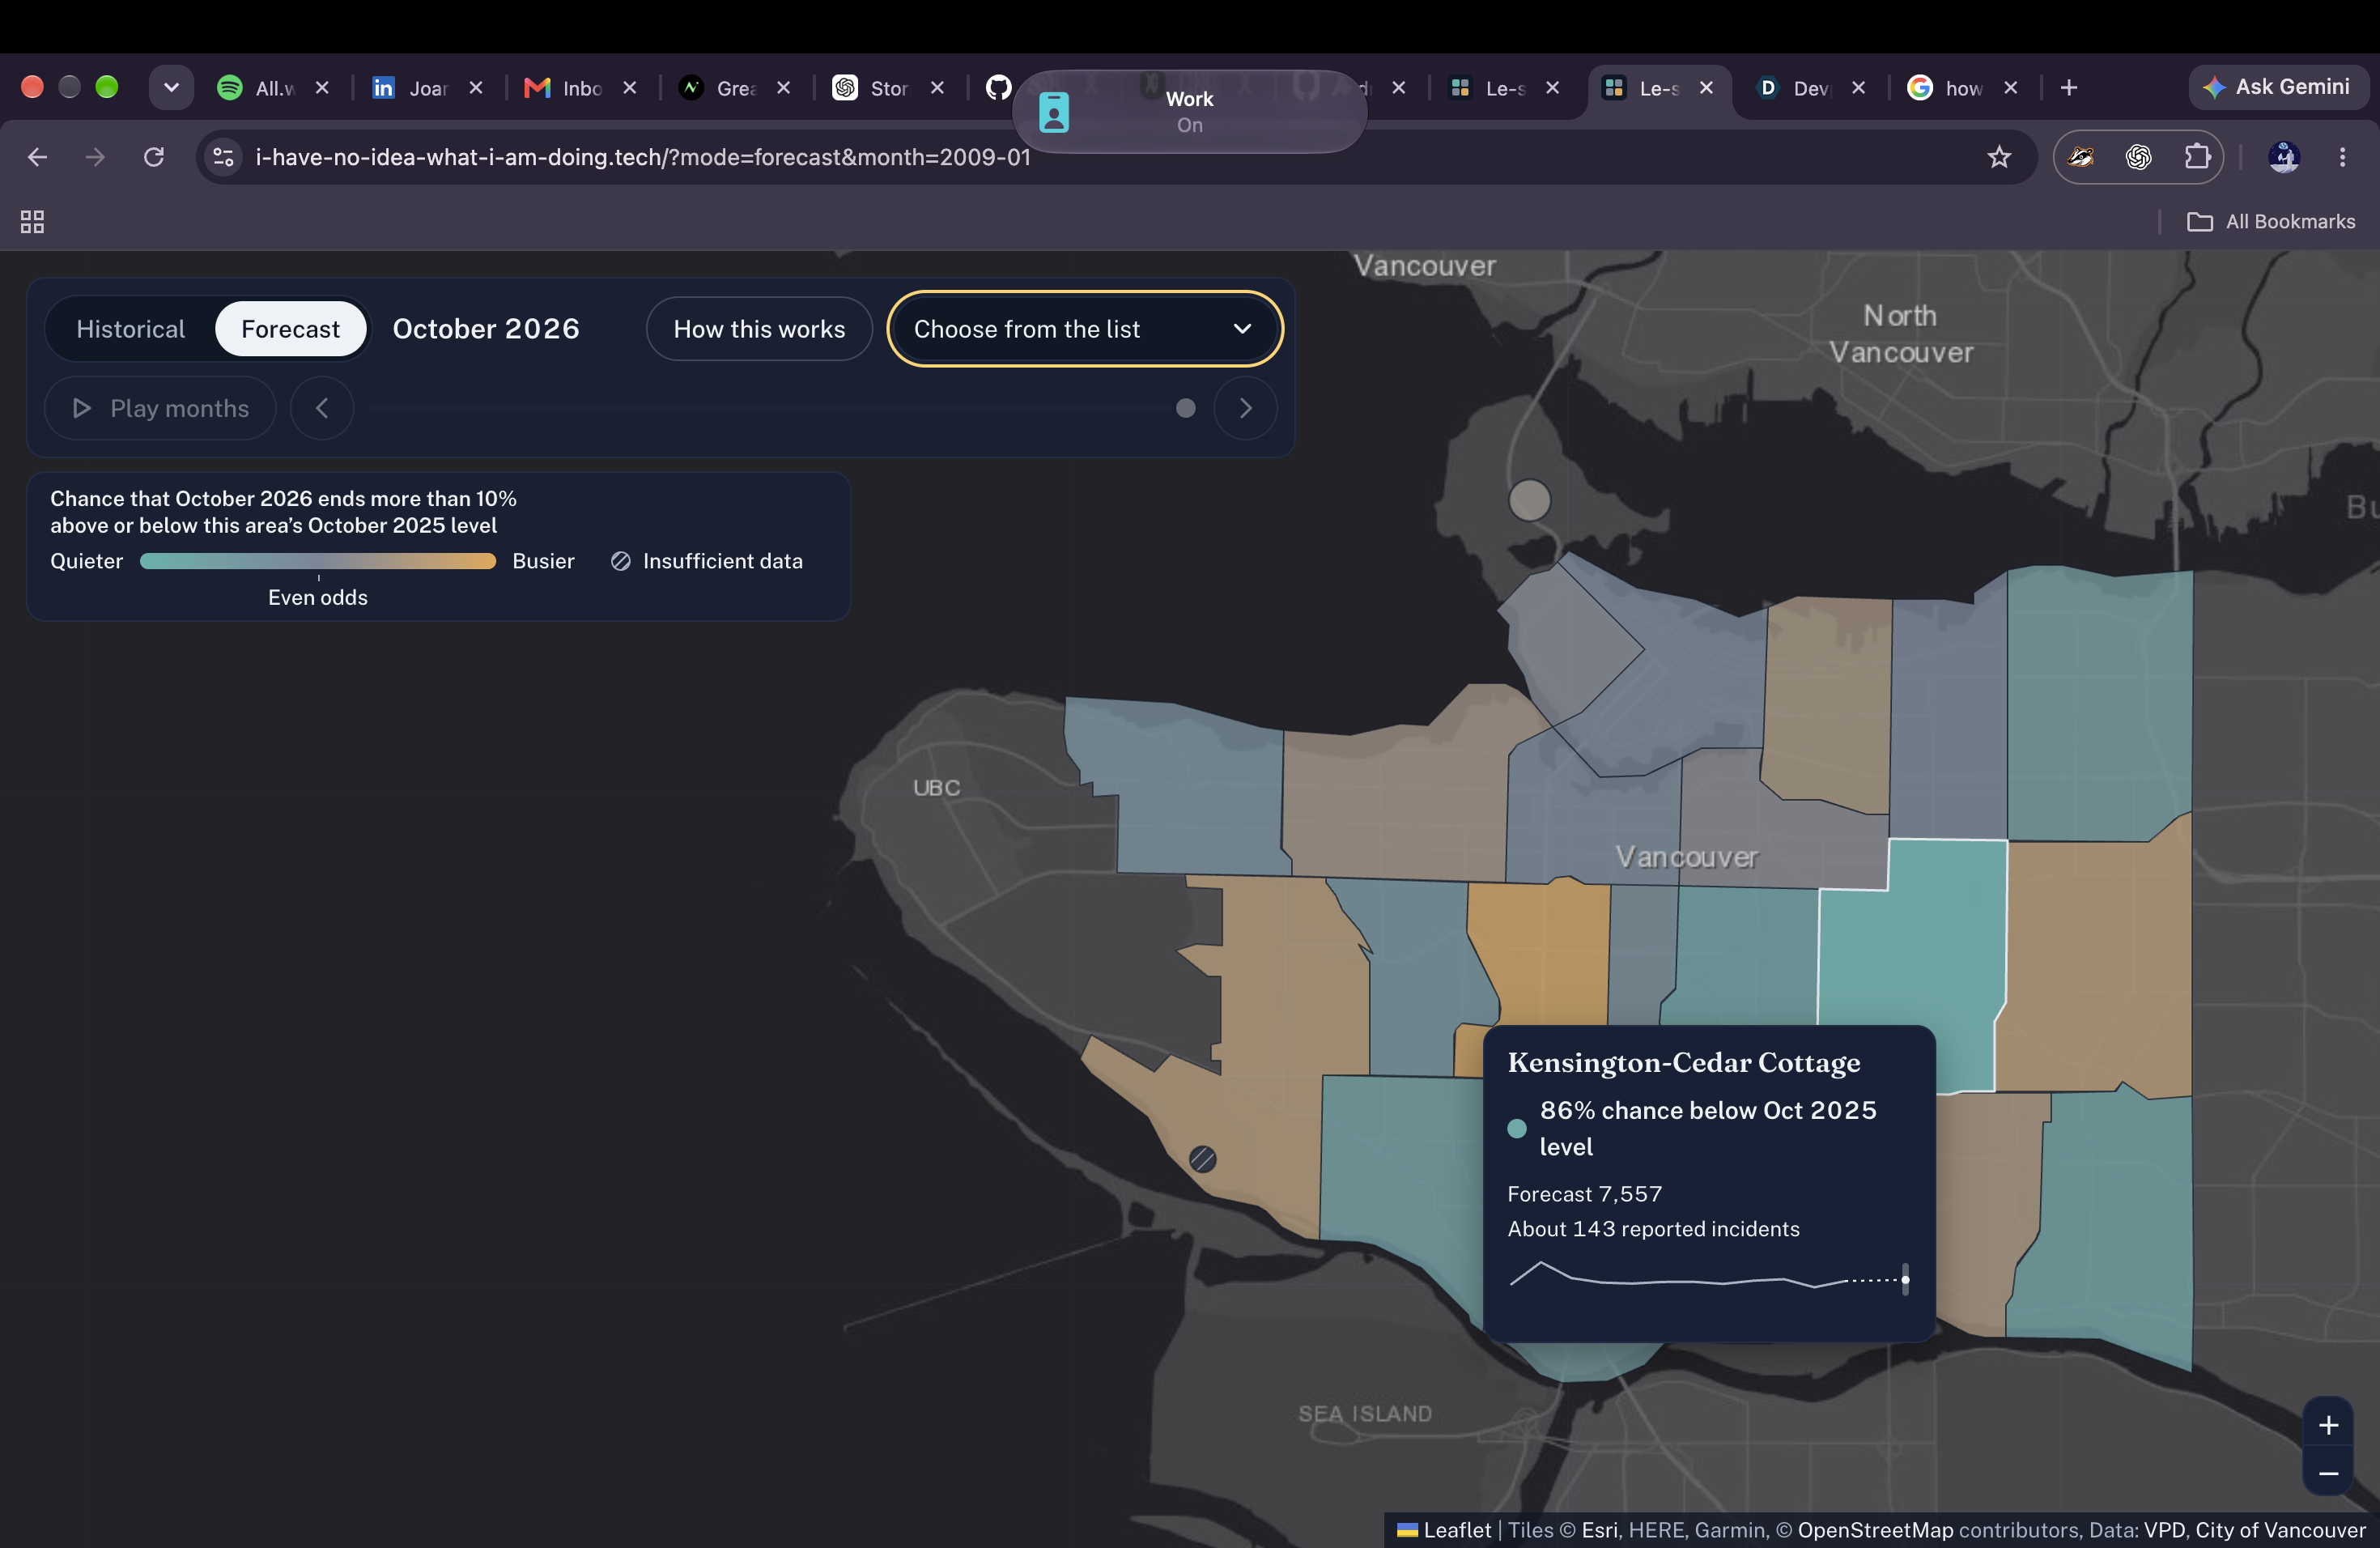
Le-Safety is an interactive Vancouver map that shows historical reported-incident activity by neighbourhood and forecasts next-month severity-weighted activity. Users can explore trends, compare neighbourhoods, view uncertainty ranges, and understand how an area’s forecast compares with its own history.
How we built it
We used Vancouver Police Department GeoDASH open data, aggregated by neighbourhood and month. We created a CSI-inspired weighted index from eight incident categories, then built forecasting models (based on the Poisson GLM) using historical trends, seasonality, and recent activity.
Our web app combines a React/Next.js map interface with a FastAPI backend that serves precomputed forecast and history data.
James worked on the Front end, the interactive map layout and integrating the FastAPI from Andrew. Andrew worked on the Backend API implementation and helped with the model as well Humberto worked on the data cleaning and feature engineering for the model Chibueze focused mainly on the development of the model and the optimization of its performance.
Challenges we ran into
We had a lot of trouble deciding the features to use and how to format the data for optimum results.
Our project directions quickly diverged way too often and we had to restart entire portions of the project.
We also had to carefully validate forecasts using time-based backtesting rather than random splits.
Additionally, we ran into merge conflicts, challenges developing the front end of the model
Accomplishments that we're proud of
We turned a large public dataset into an understandable, interactive tool with historical context, forecast uncertainty, and neighbourhood-relative activity tiers. The webapp we developed is something we would actually use on a day to day basis, so being able to develop something that useful and practical is really empowering. [Chibueze] I deployed my first web app on the internet! I am excited because it opened up to me a whole new world of cloud service providers and domains. feel free to check out my domain at the not so subtly named, www.i-have-no-idea-what-i-am-doing.tech. ;)
What we learned
A lot of work goes into data analysis and machine learning than is immediately apparent. Picking features for the model is an art and is done via trial and error mostly. Most of us had minimal experience developing full stack software and working with these new tools, and frankly, we had to use AI assisted coding to assist us materialize our ideas and teach us various libraires and frameworks.
What's next for Le-Safety
Next, we need to make the model way more reliable and accurate. Right now, we are posting nigh 60-70% accuracy and a 0.41 F1-score, showing that our model is still undercapable for the task and could benefit from better feature engineering, model selection, or simply richer data in general. Eventually, we want to expand beyond Vancouver, add carefully validated data sources such as transit and weather context, improve long-term forecasting, and gather feedback from travellers, newcomers, and community organizations.
Built With
- javascript
- next.js
- python
- pytorch
- react
- scikit


Log in or sign up for Devpost to join the conversation.