Layout Map Maker
Inspiration
I am a student developer from India, and while learning about the practical work involved in Census 2027, I noticed how much time an enumerator can spend preparing an HLO or HLB layout map before the actual survey begins. Roads, buildings, landmarks, block boundaries, and house numbers often have to be sketched or assembled manually. That process can be slow, difficult to correct, and heavily dependent on local knowledge and memory.
I wanted to build a tool that gives enumerators a useful digital starting point instead of a blank sheet of paper. The goal was not to create another general-purpose map viewer. It was to make a focused workspace for the specific steps involved in preparing a clear, editable, and printable census layout map.
The project also had to be realistic for the people it was meant to help. Enumerators may use phones, tablets, shared computers, or low-cost devices, and connectivity may not always be reliable. I therefore focused on a practical interface, low-friction onboarding, structured map data, and workflows that can support both automatic map context and manual correction.
What it does
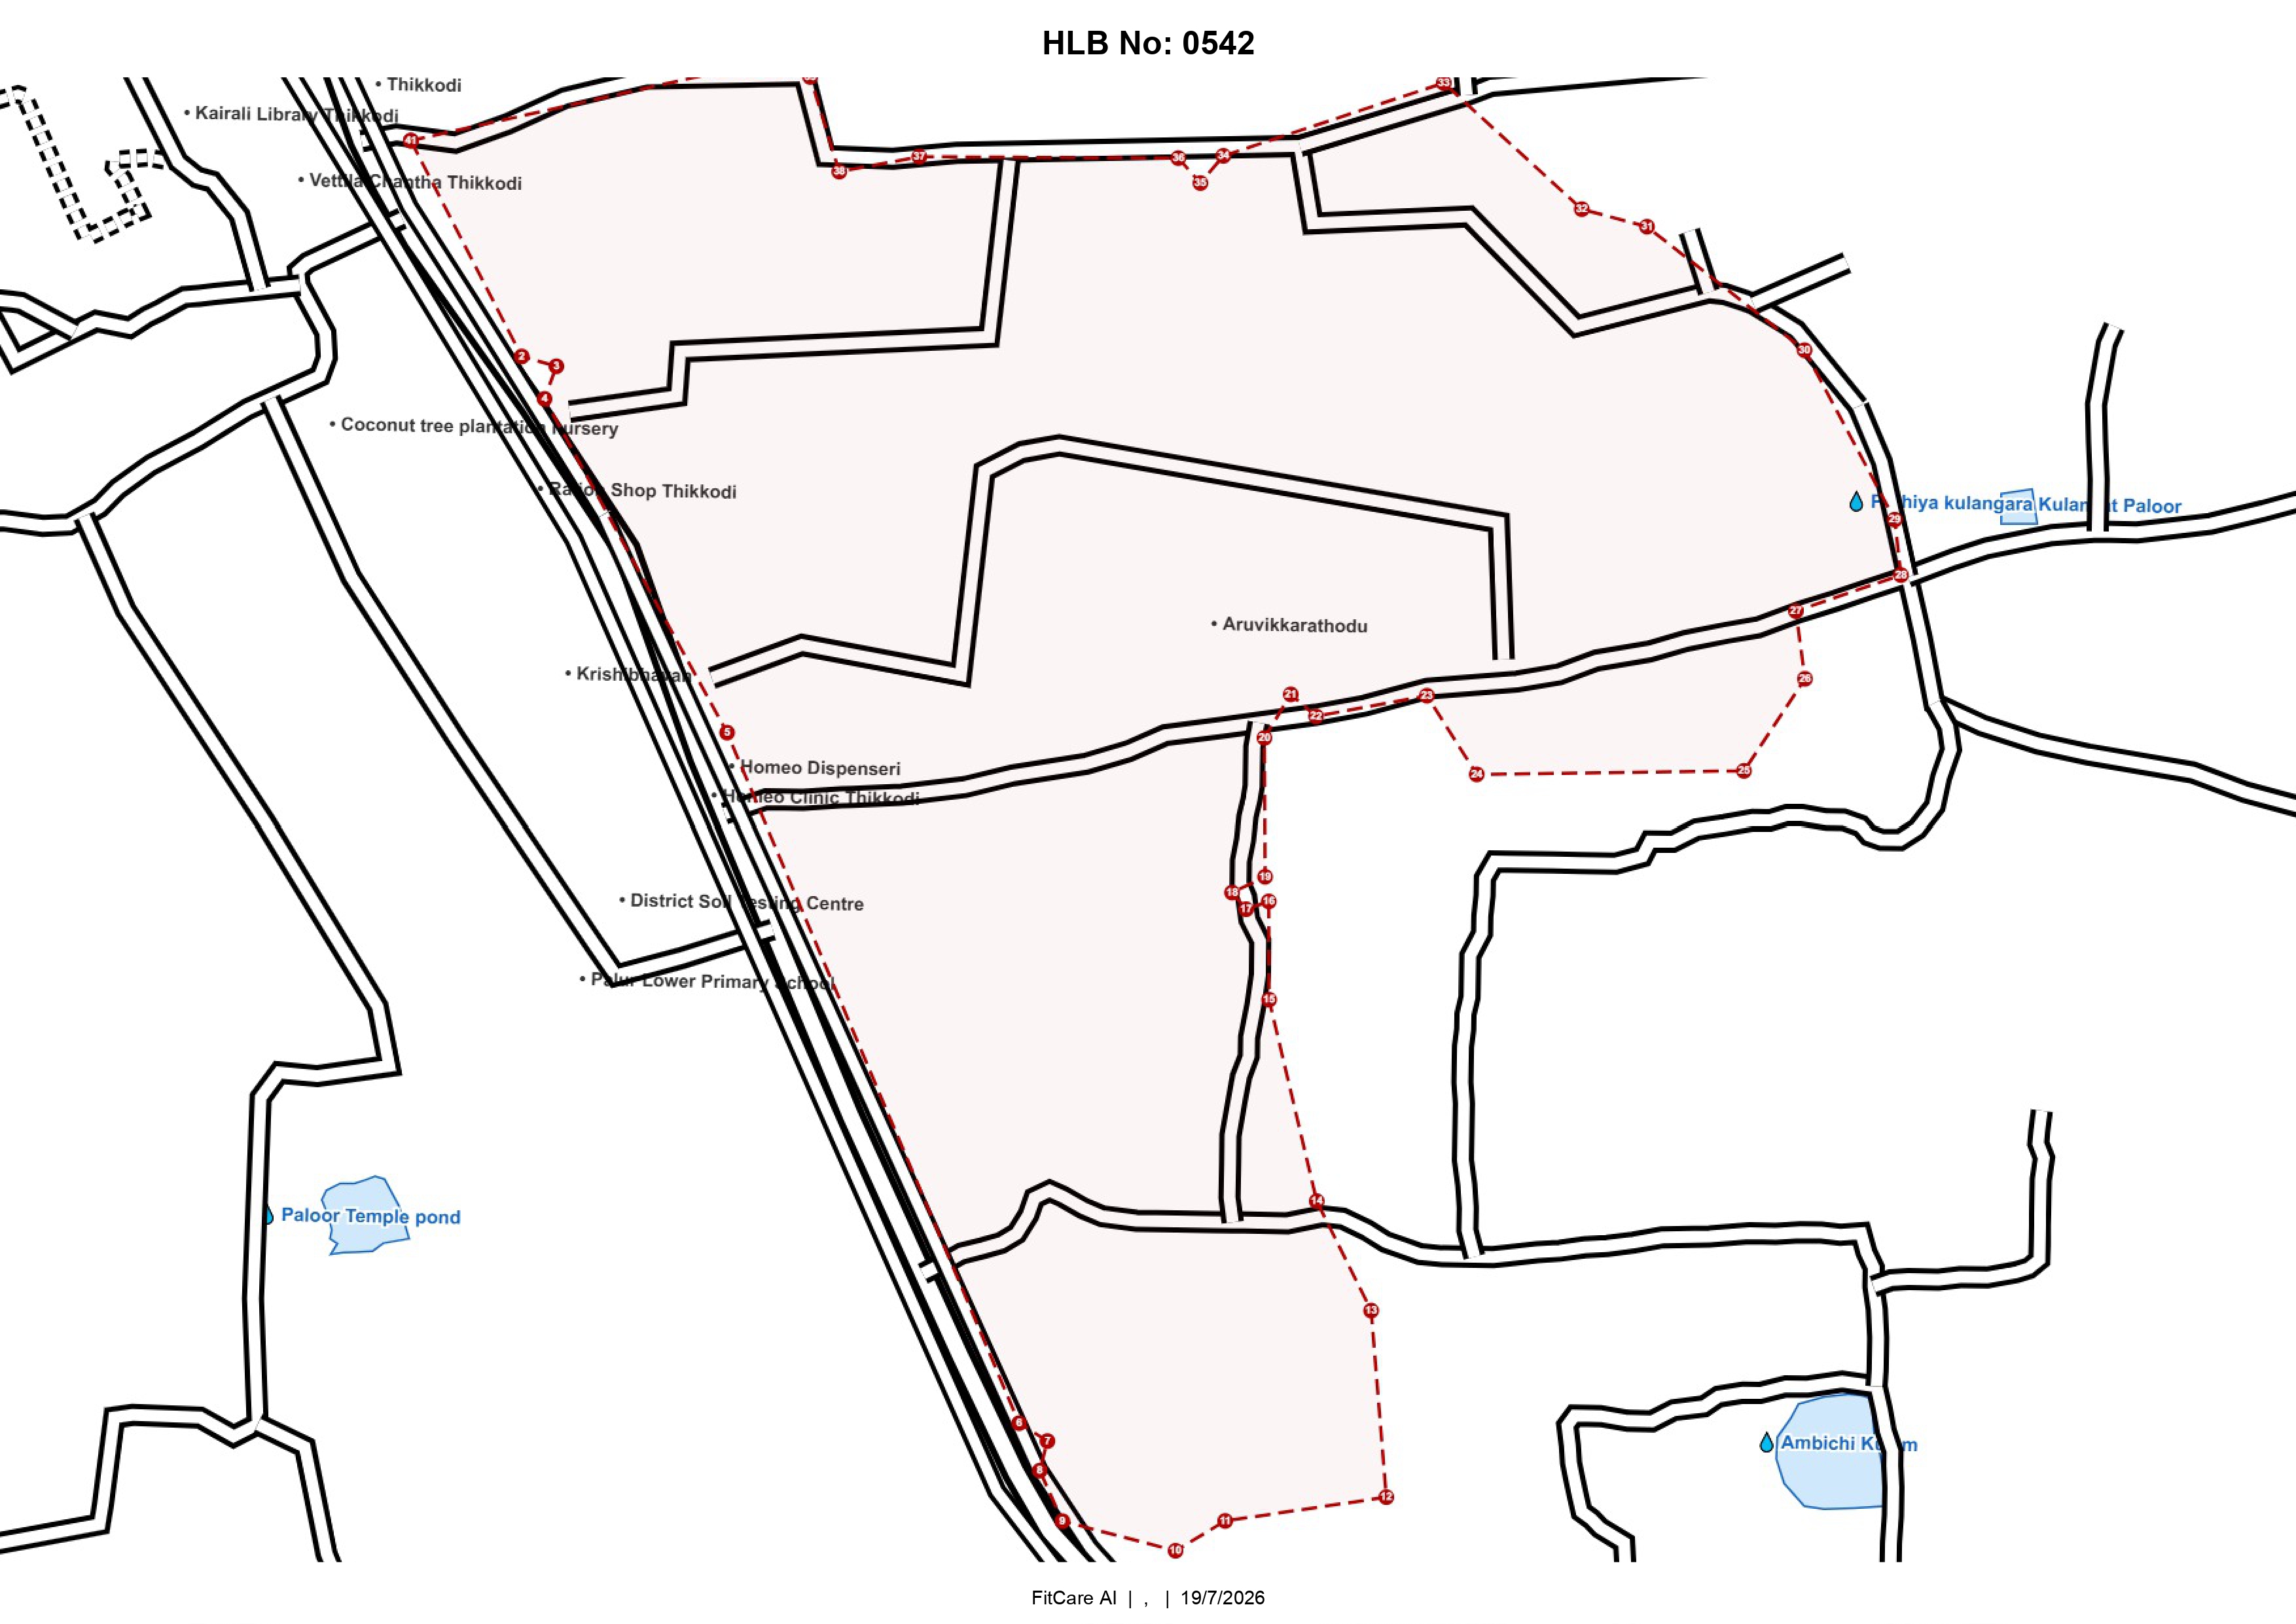
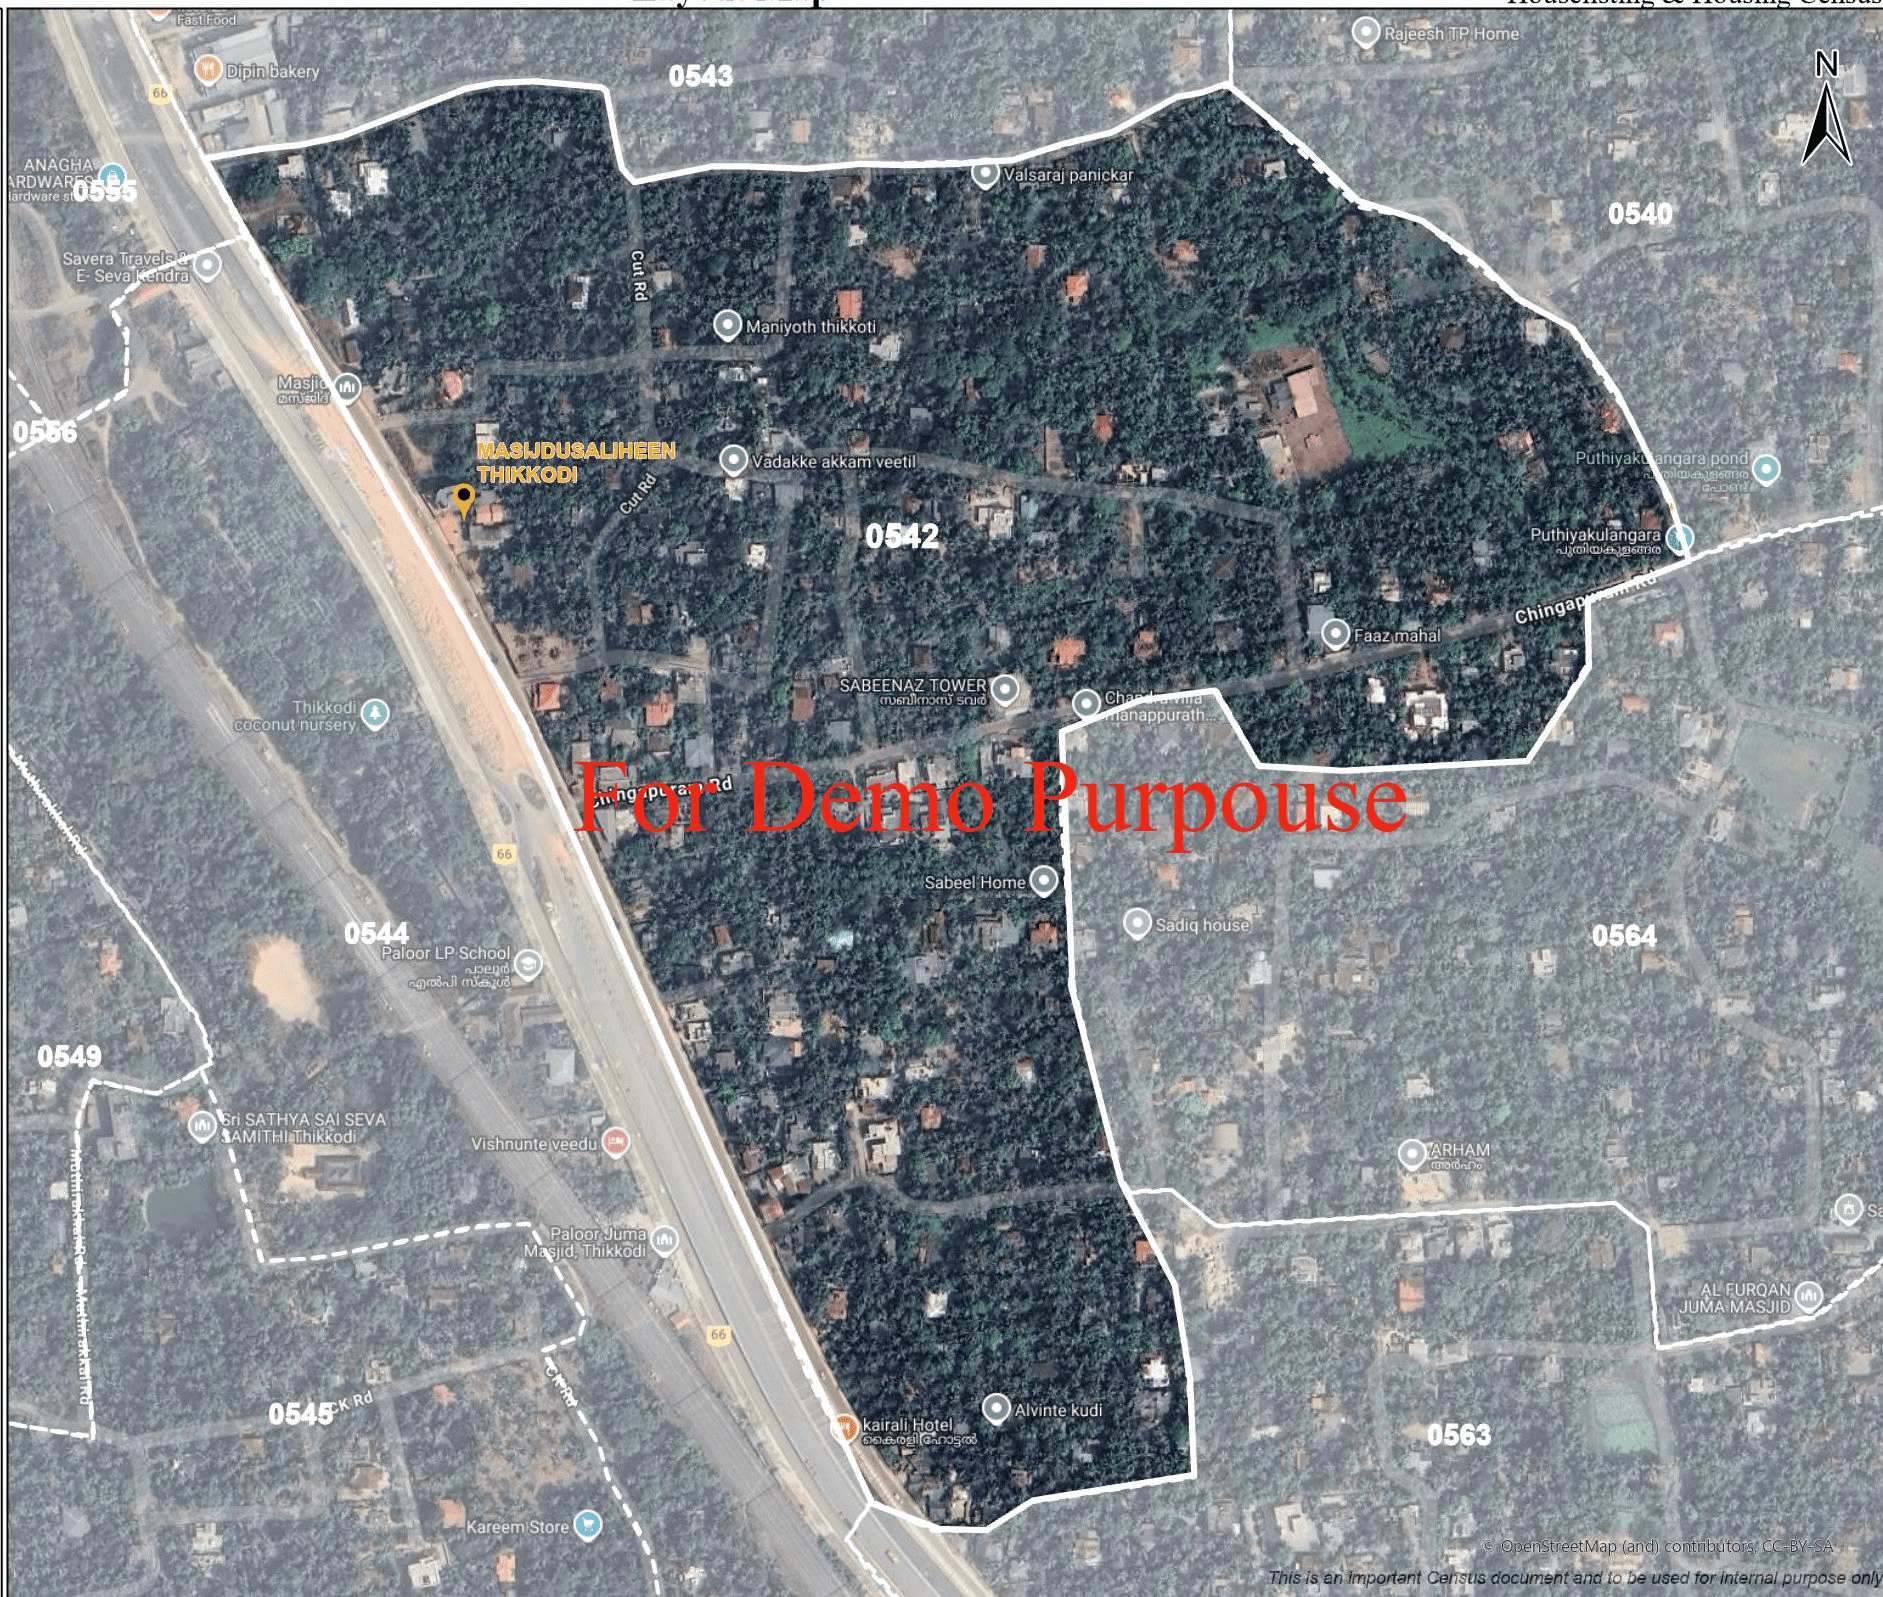
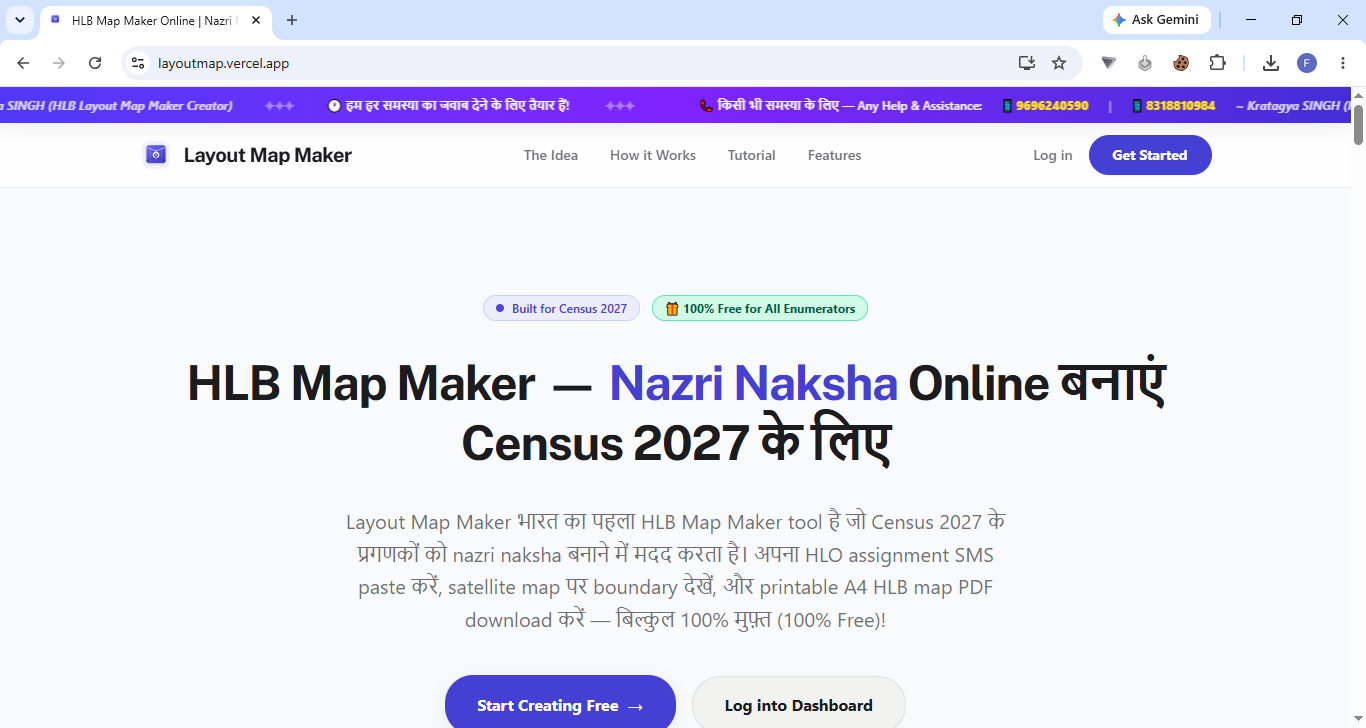
Layout Map Maker helps census enumerators create and prepare HLO and HLB layout maps for Census 2027. A user can start a map project, define an enumeration block, work with map or satellite context, add roads and landmarks, place structure symbols, organize blocks and fields, number buildings, and prepare the result for export or printing.
The application supports multiple working styles. Users can work in a guided map workspace, edit a project manually when automatic data is incomplete, add custom place labels, and use canvas-style tools for more detailed layout work. The product is designed to keep the map editable instead of reducing the entire workflow to a single screenshot.
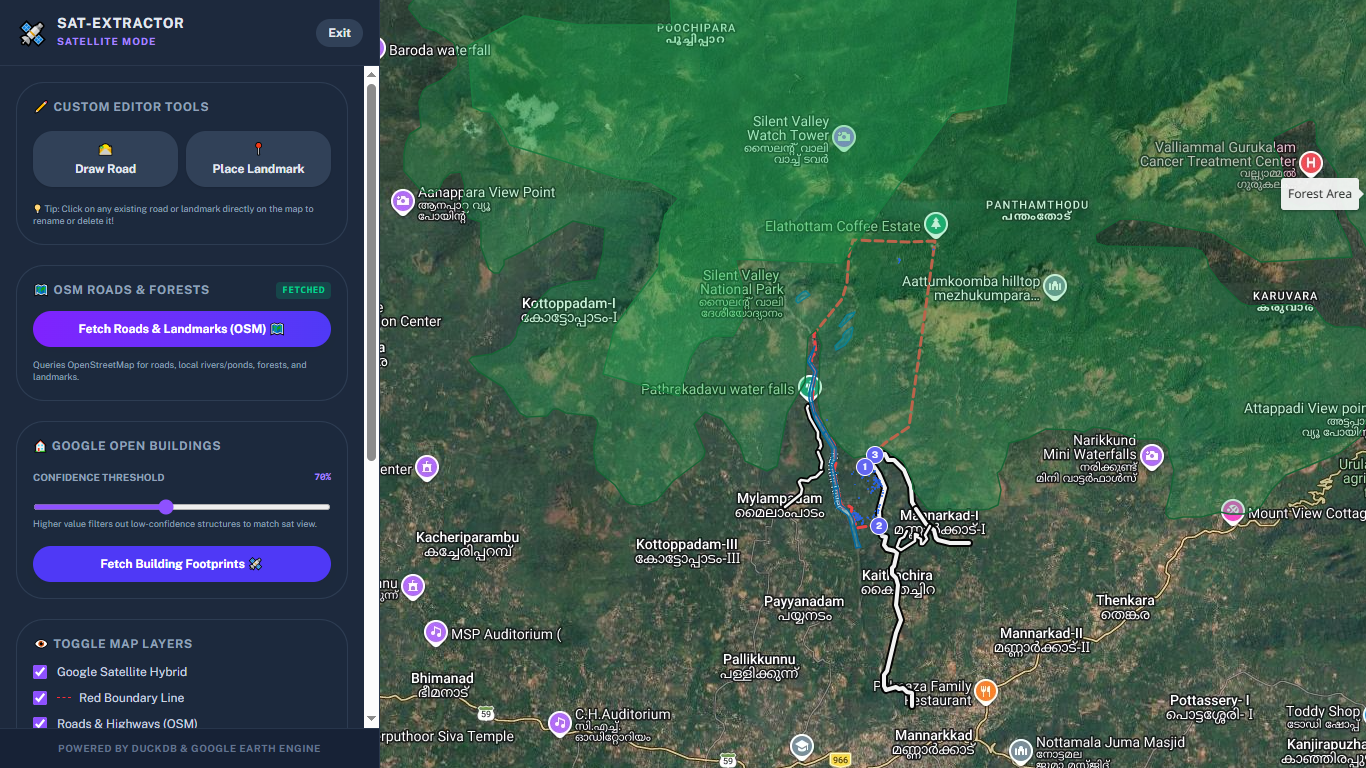
For urban areas, available road and building context can provide a useful starting point. For rural areas, where map coverage may be incomplete or settlement patterns are irregular, the user can supplement the automatically loaded information with manually placed roads, symbols, boundaries, and landmarks.
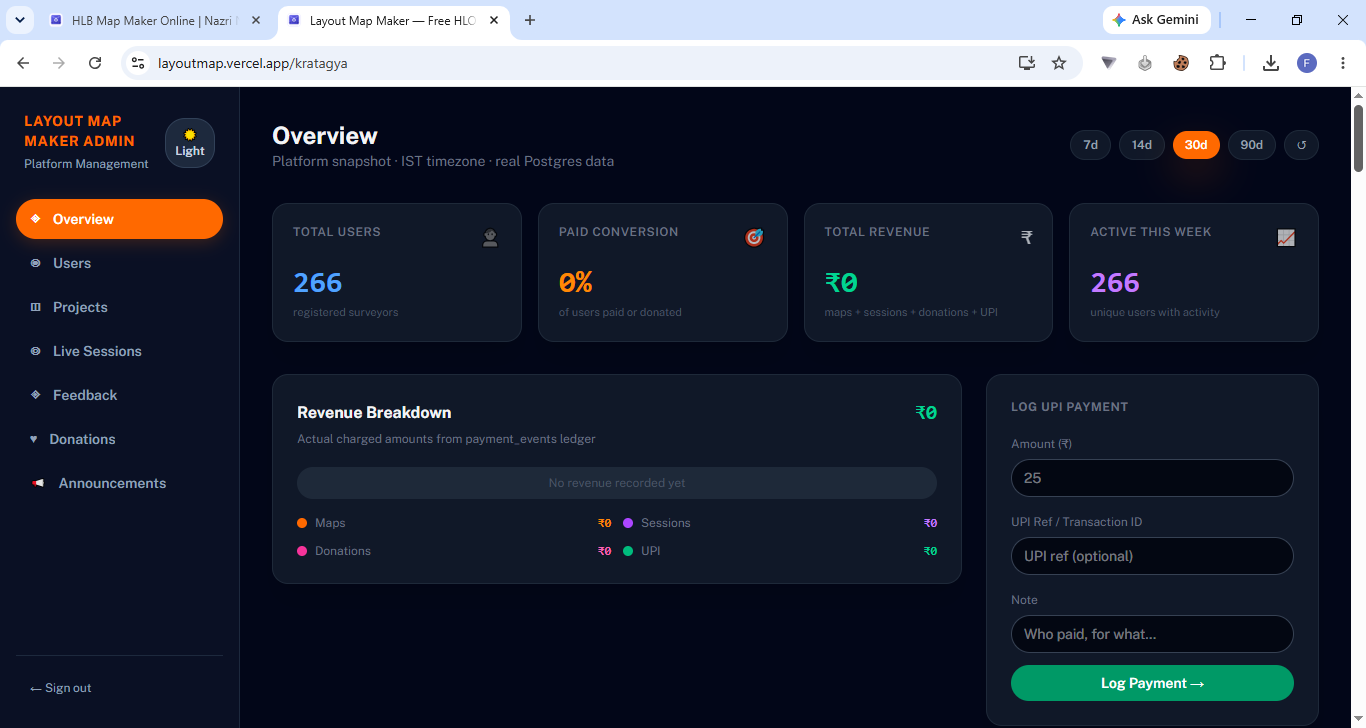
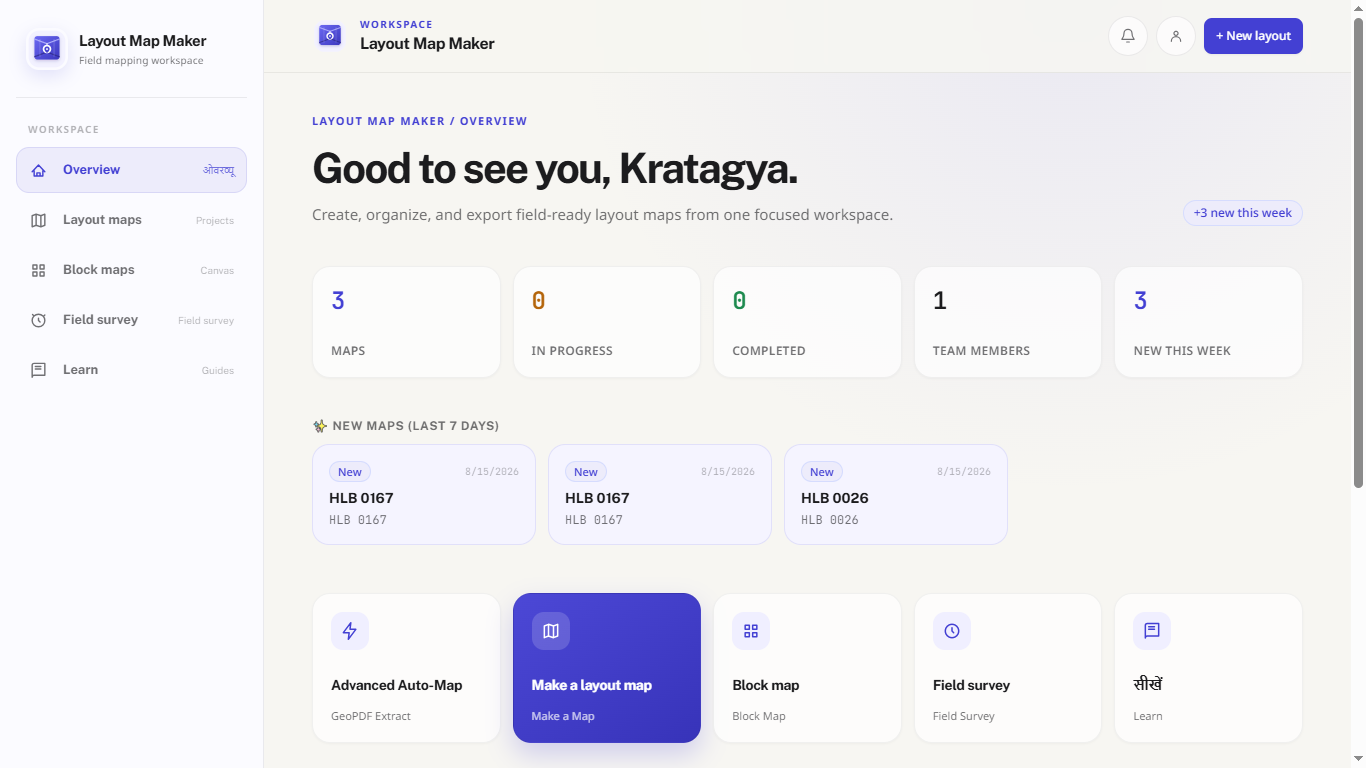
The finished project can be reviewed, updated, and prepared for a clean printable output. The application also includes project persistence, user accounts, responsive layouts, guidance pages, and an administrative workspace for monitoring active data and project activity.
How we built it
The frontend is built with React, TypeScript, Vite, and Tailwind CSS. Interactive map behavior is implemented through a browser-based mapping layer, while the application stores map information as structured data: boundaries, roads, symbols, blocks, fields, landmarks, labels, and project metadata.
The project uses Supabase for authentication and database-backed storage. It supports users, map projects, assignments, announcements, feedback, sessions, donations, and administrative access.
The map workflow is supported by structured UI components for project creation, dashboard navigation, responsive editing, previews, search, filters, empty states, and error handling. Export-related workflows use the project’s map data rather than requiring the user to redraw the map from scratch.
Challenges we ran into
The first challenge was turning a specialized census process into an interface that feels understandable to someone who is not a GIS professional. The user needs precise mapping tools, but should not need to learn complex GIS terminology before starting. I addressed this by organizing the workflow into clear stages and keeping common actions visible while moving advanced actions into focused panels.
The second challenge was handling the difference between dense urban areas and scattered rural settlements. A workflow that assumes a regular street grid does not work equally well everywhere in India. In places where automatic map information is incomplete, manual editing and custom labels become essential. The application therefore combines automatic geographic context with direct user correction.
The third challenge was maintaining reliable data behavior across many screens. A project can be opened from the dashboard, restored from local state, accessed through an assignment, or viewed from an administrative path. Each path must respect the same data boundary. I introduced shared response-level filtering so that older records cannot appear simply because they came through a different query.
The fourth challenge was building a complete product instead of only a map canvas. Authentication, project persistence, responsive navigation, empty states, metadata, exports, admin screens, and error handling all became part of the work. Making these pieces feel like one coherent tool required as much product design as coding.
The fifth challenge was working with limited resources. The project was built with a strong focus on accessible tools and low operating cost, using open mapping concepts and managed services where appropriate. That constraint influenced the architecture and kept the product focused on solving the enumerator’s main problem rather than adding expensive infrastructure.
Accomplishments that we're proud of
The accomplishment I am most proud of is that Layout Map Maker reached real users instead of remaining only a prototype. Approximately 250 users used the project within its first two days. That early adoption gave me practical validation that enumerators and other users could understand the purpose of the tool and find value in a focused census mapping workflow.
I am also proud that the project covers the full journey from starting a map to managing and revisiting it. Users can create a project, work with map context, add and correct information, save their progress, and prepare a final layout. The product is not limited to displaying geographic data; it is designed around the work an enumerator actually needs to complete.
Other accomplishments include:
Building a responsive mapping workspace for desktop, tablet, and mobile use.
Adding structured map editing for boundaries, roads, symbols, blocks, fields, and landmarks.
Supporting authenticated project persistence through Supabase.
Creating a dedicated dashboard and an administrative data workspace.
What we learned
Building for a real field-oriented problem taught me that the most important feature is often not the most technically impressive one. Enumerators need speed, clarity, forgiving editing, and confidence that their work will not disappear. A simple correction tool can be more valuable than an advanced automation feature if the underlying map data is incomplete.
I also learned that different geographic contexts require different levels of automation. Urban areas may benefit from automatic roads and building context, while rural areas often require human knowledge to correct missing or irregular information. The best workflow is therefore not fully automatic or fully manual; it combines both.
The project also taught me the importance of consistent data rules. When several screens and database paths use the same records, filtering and validation cannot be implemented in only one place. Shared utilities and response-level checks make the application more predictable and easier to reason about.
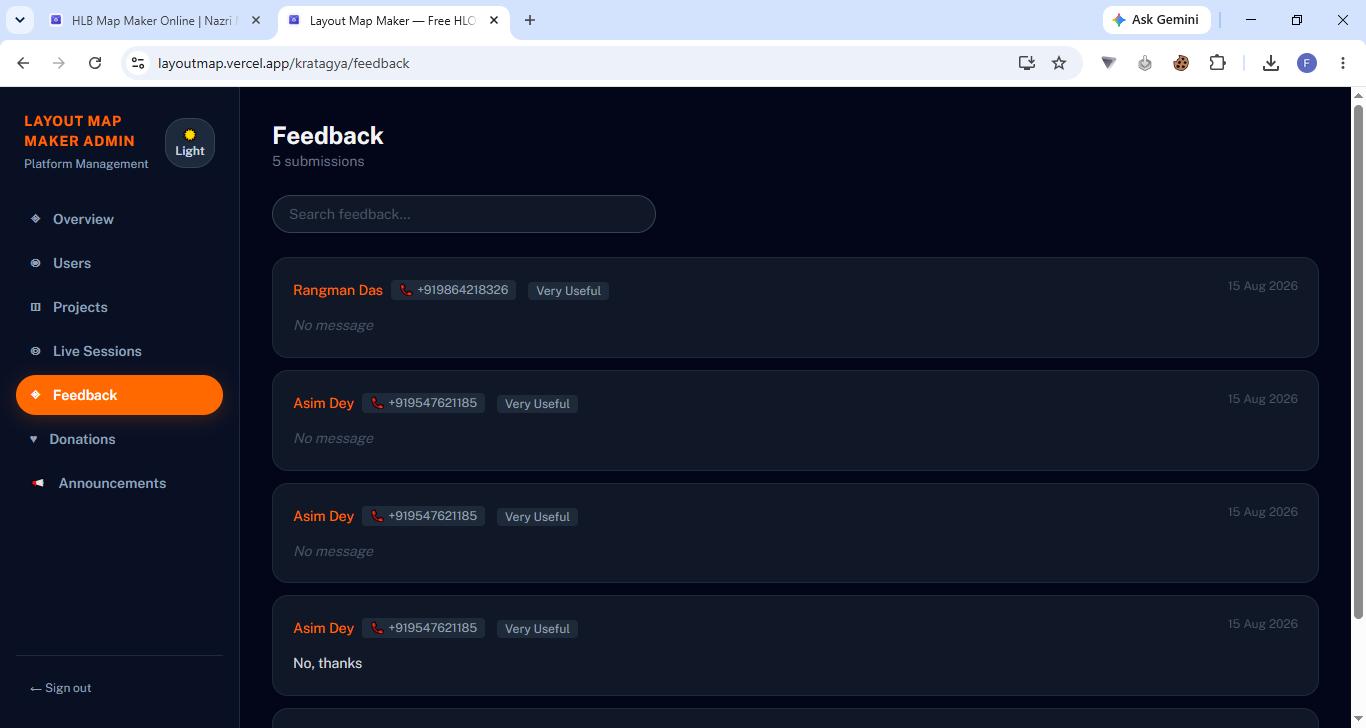
Finally, the first 250 users taught me that early adoption is useful feedback in itself. It encouraged me to prioritize onboarding, readable controls, responsive design, and a workflow that communicates its purpose quickly.
What's next for Layout Map Maker
The next priority is to improve reliability in low-connectivity environments and continue making the mapping workflow practical for field use. I want to strengthen local persistence, improve recovery when a network request fails, and make it easier to continue work across devices.
I also plan to improve map validation, expand import and export options, add more tools for supervisors and administrators, and support broader regional guidance for enumerators across India. Further user feedback will help determine which mapping tools should become more automated and which should remain under direct human control.
The longer-term goal is to make Layout Map Maker a dependable workspace that helps enumerators spend less time preparing maps and more time completing accurate census fieldwork.
Datasets and Geographic Sources
OpenStreetMap data for open geographic context, roads, places, and building information.
Overpass API for querying OpenStreetMap road, building, and place geometries within a selected area. The application includes multiple Overpass endpoints as fallbacks for availability.
Microsoft Global ML Building Footprints dataset for building-footprint data in areas where OpenStreetMap coverage is incomplete.
Google Earth Engine for optional land-cover and geographic context enrichment through the server-side mapping functions.
Google satellite imagery tile services and ArcGIS World Imagery for satellite and imagery layers used as map context.
User-provided Census GeoPDF files as an important project input. The boundary extraction service reads the official GeoPDF rather than asking the enumerator to retrace the boundary manually.
APIs and Services
Nominatim for OpenStreetMap-based location search and geocoding.
Google Maps Places API as an optional nearby-place enrichment path when configured.
OSRM Map Matching API for matching recorded paths to road geometry where applicable.
LocationIQ for optional routing, reverse geocoding, and map-matching workflows when configured.
Supabase APIs for authentication, database access, row-level security, Edge Function calls, and project data persistence.
Cashfree Payments API for donation and payment workflows; the project supports the Cashfree sandbox flow during development.
ipapi.co for region detection used to select a suitable language for the donation interface.
WhatsApp share links for optional sharing of project and donation information.
GeoPDF Extraction and Supporting Services
FastAPI for the boundary-extraction microservice.
Python for the extraction and enrichment backend.
PyMuPDF for reading PDF structure and text layers.
OpenCV, NumPy, Pillow, and Tesseract OCR/Tesseract.js for image and text-processing fallbacks.
Requests for backend HTTP integrations.
Google Earth Engine authentication and APIs for optional server-side geographic enrichment.
AI Development Tools
Manus AI
Claude AI
Antigravity
Some integrations are optional or fallback-based and require their respective API keys or service credentials. The primary mapping workflow is designed to remain useful with open geographic data, user-provided information, and manual editing when an external service is unavailable.
Built With
- antigravity
- claude
- google-buiilding
- manmus
- openstreet
- overleaf
- react
- vercel
