Launch Footprint
Inspiration
As the space industry grows rapidly, the environmental impacts of rocket launches are often overlooked. While innovations are celebrated, their carbon cost isn’t always tracked or visualized. We were inspired to explore this gap — especially with sustainability and climate change at the forefront of global concerns. Our goal was to make the carbon footprint of rocket launches visible, informative, and interactive.
What it does
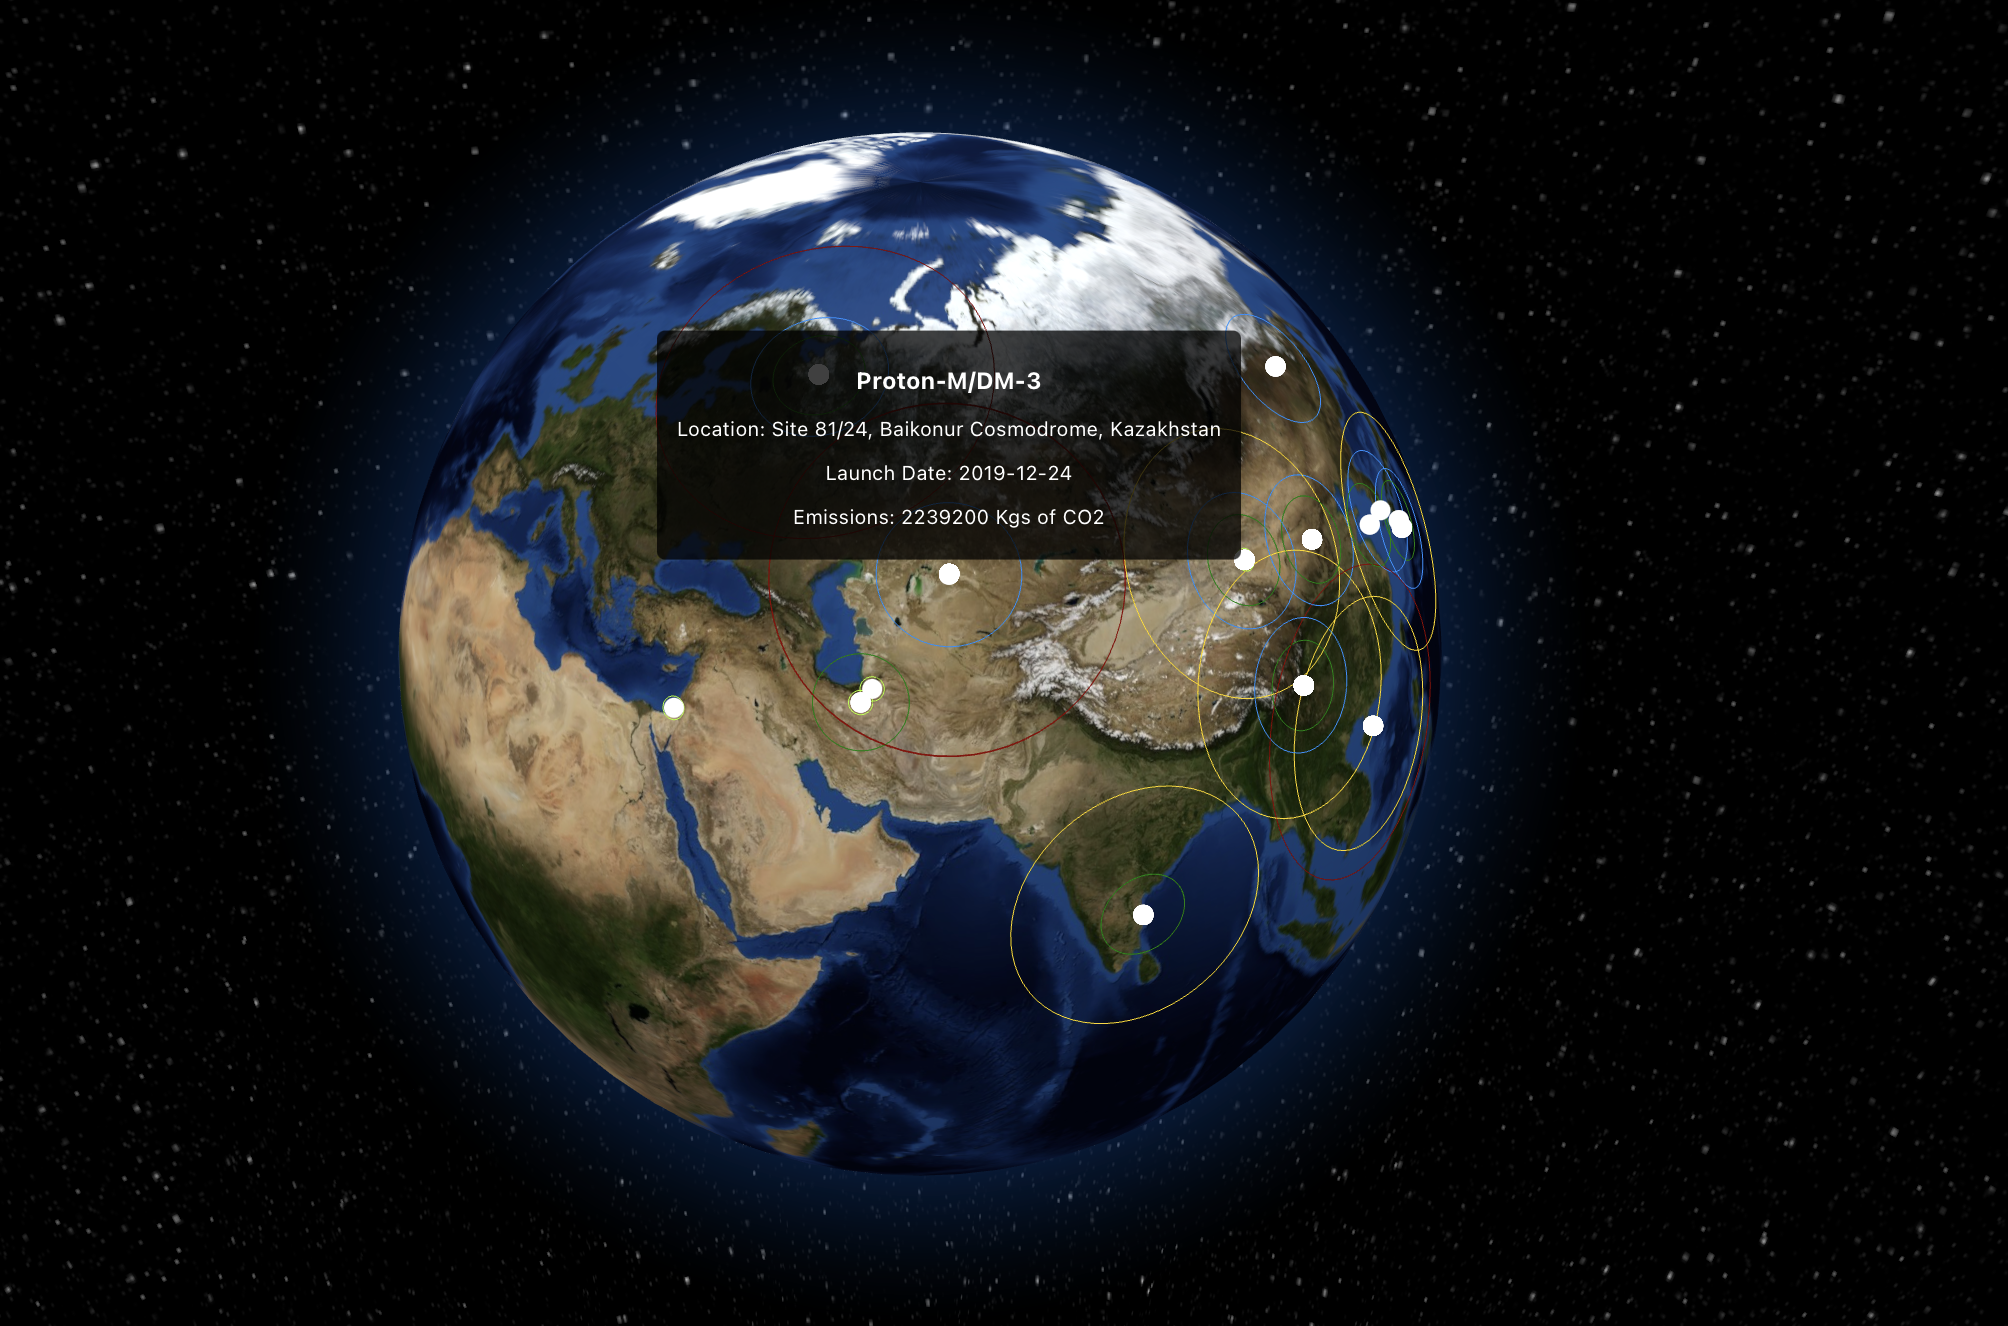
Launch Footprint is a globe-based web visualization that maps historical rocket launches and displays their estimated greenhouse gas emissions. Each launch is represented as a color-coded ring, with the size and color reflecting the emission levels. The data includes location, time, rocket name, and CO₂ equivalent emissions.
Users can:
- View launches around the globe
- Understand their relative emission levels
- Get a visual sense of the climate cost of space missions
How we built it
- Frontend: Built with React and
react-globe.glfor the 3D globe visualization. - Backend: Flask REST API hosted with Render, serving filtered launch data and enriched emission estimates.
- Data Processing: A CSV file of launches was parsed and mapped to geolocations. Emission values were categorized into levels and matched with colors and ring sizes.
- Visualization: Rings on the globe and labels represent various launch information.
Challenges we ran into
- CORS errors: Deploying the backend to a public URL and dealing with browser restrictions required proper headers and testing across browsers.
- Safari rendering issues: The globe rendered fine in Chrome but not Safari due to differences in WebGL support.
- Data mapping: Matching launch site names to precise lat/lng coordinates took manual effort and validation.
- Ring customization: The default ring visualizations didn’t support fill colors, so we had to dive into Three.js and create custom layers.
Accomplishments that we're proud of
- A smooth, animated, and interactive globe that runs in the browser.
- Real-time data-driven visuals with emissions categorized and color-coded.
- Full-stack integration with a live API, custom visualization layer, and styled UI.
- Clear storytelling through visuals — a user can immediately "feel" the weight of each launch.
What we learned
- How to combine geospatial visualization with real environmental data.
- The intricacies of 3D rendering using Three.js and
react-globe.gl. - Handling cross-origin issues and hosting Flask APIs on free platforms.
- Collaborating effectively under tight hackathon deadlines to bring both backend and frontend together seamlessly.
What's next for Launch Footprint
- Add filtering by country, agency, and time range.
- Include environmental comparisons like "this launch = X cars/year."
- Add charts to complement the visual globe.
- Educate users on the types of fuels used and their respective impact.
- Expand to include real-time or upcoming launches using live APIs.
We’re excited about the potential to make space exploration more sustainable and transparent — one launch at a time.


Log in or sign up for Devpost to join the conversation.