Inspiration
Nobody in my family has ever gone without a medicine because it ran out. I have no story here, and I would rather say so than borrow one. This started because Health Canada publishes its whole drug database as a download with no key and no account, and I wanted to see what was in it.
The first thing I found was that my idea was not mine. I counted how many marketed molecules have exactly one company behind them, got 1,203 of 2,044, and then found that the regulator's own economists had published essentially the same figure years earlier with a thirteen-year series behind it. That was the right time to stop and ask what was actually left.
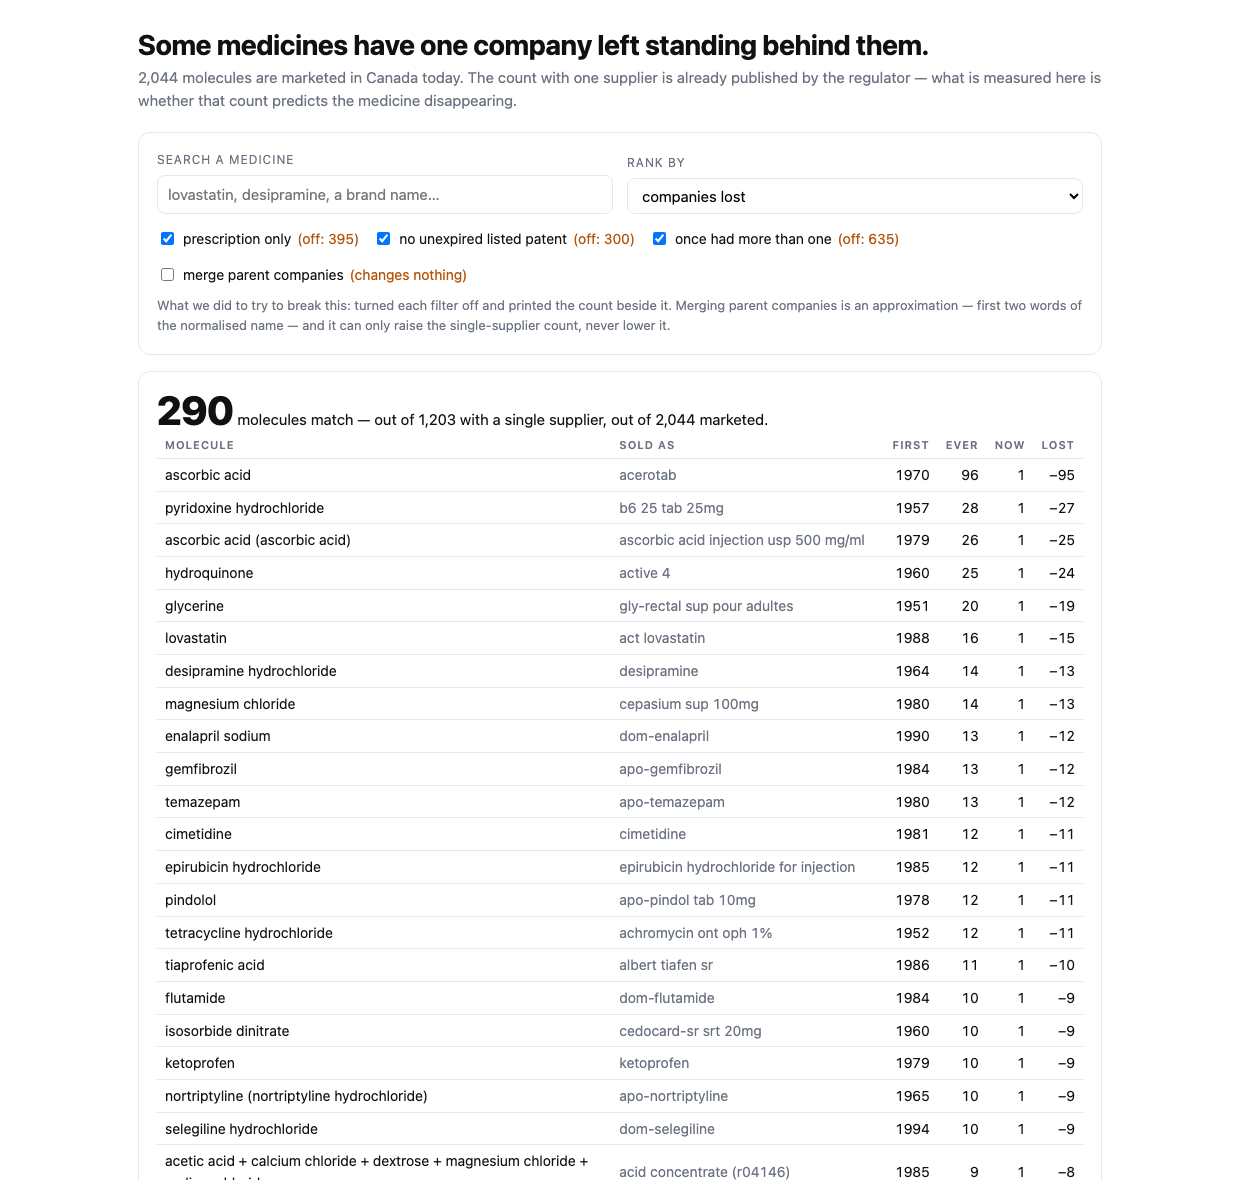
What was left turned out to be a question the snapshot cannot answer. A molecule with one supplier today might have had one all along, or it might have had six. Those are different situations wearing the same number. Health Canada keeps every product it has ever authorised, including the discontinued ones, so the history is sitting right there. Reconstructing it gave 407 molecules that used to have competition and now have one company. That count is measured rather than modelled, and no null hypothesis takes it away.
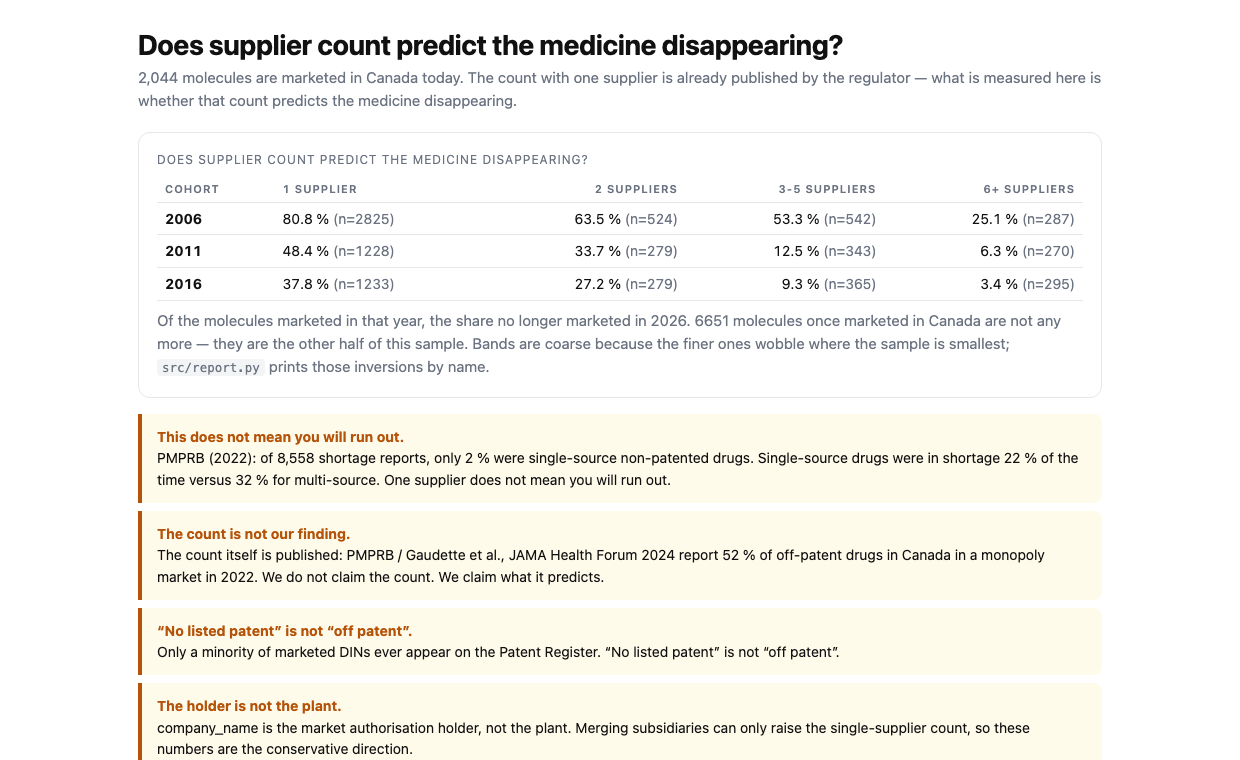
The part I did not plan was watching my best-looking result die. Molecules with more suppliers disappear less often, and the gradient is clean across three cohorts. It held up so well that I wrote the headline before I checked it. Then I worked out what the gradient would look like if suppliers simply left at random and independently, which turns the whole thing into p to the power of k and produces the same shape with no signal in it at all. Measuring that rate from the cohort itself, eight cells sit above the null and six below, and in two of the three cohorts the single-supplier cell lands well under what the null predicts. The opposite of the story I was about to tell, and in the third cohort it sits on the null instead.
That script is in the repository. It is the most useful thing I wrote, and all it does is take something away.
The one-page summary
The rules ask for a one-page PDF alongside this write-up, and Devpost's form takes images but not documents, so it lives in the repository:
https://github.com/Ketchio-dev/last-one-standing/blob/main/submission/onepager.pdf
It is one page, built from submission/onepager.html by the command in the checklist, and it
carries the count, the null that deleted our first headline, the model, and the finished versus
planned section. Nothing on it is typed by hand; the figures come from the same script output
the checks verify.
What it does
It answers one question about Canada's drug supply with counting, and then it shows its own best-looking answer being wrong.
The count. 1,203 of 2,044 currently marketed molecules have exactly one market authorisation holder. Of those, 407 once had two or more and now have one. That second number is the project: not "how concentrated is the market today" but "how much of it thinned while nobody was counting." It is reconstructed from every product Health Canada has ever authorised, not inferred from a snapshot.
Everything else the count says.
| molecules currently marketed (active-ingredient sets) | 2,044 |
| with exactly one supplier | 1,203 (58.9 %) |
| of those, once had two or more | 407 (33.8 %) |
| single-supplier with an unexpired listed patent | 343 |
| single-supplier ever on the Patent Register at all | 513 |
| prescription-only, no unexpired patent, first marketed before 2006, one supplier | 382 |
| once marketed in Canada and no longer | 6,651 |
The 690 single-supplier molecules with no listed patent are not "off patent." Most never appeared on the Register at all: old drugs and biologics. The page says "no listed patent" everywhere and never "off patent."
The part we took away from ourselves. Molecules with more suppliers disappear less often. That gradient holds in all three cohorts and it looks like a finding. It is not. A molecule leaves the market only when every supplier leaves, so if companies depart independently at rate p, the disappearance rate falls as p^k with no signal at all. Measuring p from the 2016 cohort itself gives 0.486:
| suppliers in 2016 | molecules | observed gone | arithmetic null p^k | difference |
|---|---|---|---|---|
| 1 | 1,233 | 37.8 % | 48.6 % | -10.8 pp |
| 2 | 279 | 27.2 % | 23.6 % | +3.7 pp |
| 3 | 175 | 11.4 % | 11.4 % | -0.0 pp |
| 4 | 106 | 5.7 % | 5.6 % | +0.1 pp |
| 5 | 84 | 9.5 % | 2.7 % | +6.8 pp |
| 6+ | 295 | 3.4 % | 1.3 % | +2.1 pp |
Counting cells that miss the null by more than a point, across all three cohorts, 8 sit above it
and 6 below. Not one direction. In 2011 and 2016 the single-supplier cell lands well better
than the null, which is the opposite of the story the raw gradient tells; in 2006 it sits on the
null. So it is not consistent either. src/null.py is the script that took our headline away, and it ships in the repo.
The interface. Click a molecule and you get its 1996-2026 supplier band and the cohort row it belongs to. The page opens from the filesystem. No server, no account, no key.
Why we do not headline 58.9 %
Because it is not ours and it is not new. PMPRB / Gaudette et al. (JAMA Health Forum, 2024)
report 52 % of off-patent drugs in a monopoly market in 2022, with a thirteen-year series.
Zhang et al. (CMAJ Open, 2020) reach about 51 % from the same public database. Our 58.9 %
differs because we count active-ingredient sets rather than their unit, and because
company_name is the market authorisation holder, not the plant, so subsidiaries count
separately. Merging them can only raise the single-supplier count, never lower it, and with
the approximation the page ships it raises it by zero. We say this on the page.
Does anything beat counting?
A logistic regression in pure Python — no numpy, no scikit-learn — fit on the 2006 cohort and tested on later ones, with features restricted to what was knowable in the cohort year.
| cohort | molecules | gone | supplier count alone | model | difference |
|---|---|---|---|---|---|
| 2011 | 2,120 | 748 | 0.690 | 0.754 | +0.064 |
| 2016 | 2,172 | 586 | 0.681 | 0.758 | +0.078 |
+0.071 AUC on average. The most useful feature is not how many companies a molecule has:
| feature | weight |
|---|---|
rx |
-1.376 |
holders |
-0.908 |
products_by_then |
-0.670 |
lost_already |
+0.813 |
age_years |
+0.164 |
lost_already — companies a molecule has already shed — is the only feature that pushes
toward disappearing, and it comes within a tenth of holders (0.813 against 0.908) while
measuring something the supplier count cannot see. Thinning carries nearly as much as thinness.
What is finished versus planned
The judging criteria ask this directly, so here it is without softening.
Finished and verified:
- The full pipeline: fetch, join, report, model, null, web export. Runs from a clean clone.
- 27 checks at a fixed denominator, and 28 planted defects that prove the checks can fail (27 of 27 caught, 0 missed).
- Every figure quoted here is re-derived from the data by a check, not typed by hand.
Not done:
- No shortage data. healthproductshortages.ca requires a free account, which we did not create. So we never test whether single-supplier molecules actually go short.
- No point-in-time prescription status. The database carries only today's value, so the
rxfeature reads the present.src/check.pyfails if any other feature starts doing that, andsrc/sabotage.pyre-introduces the leak to prove the check works. - One endpoint, three views. All cohorts are scored against "is this marketed today," and they overlap heavily in membership. That is not three independent replications.
- No therapeutic substitution check. We do not test whether a same-class survivor exists, so we cannot tell obsolescence from loss.
What this does not claim
- One supplier is not a shortage warning. PMPRB's own 2022 shortage study found that of 8,558 shortage reports only 2 % were single-source non-patented drugs, and single-source drugs were in shortage 22 % of the time against 32 % for multi-source. Santhireswaran et al. (JAMA Netw Open, 2026) found drugs with more than 25 products available had the higher shortage intensity. If this page implied a supply warning the regulator would contradict it. It does not.
- "No unexpired patent" is not "off patent." Only a minority of marketed DINs ever appear on the Patent Register; biologics and pre-1993 drugs often never listed one. The page says "no listed patent" everywhere.
- Disappearing is usually obsolescence, not crisis.
How I built it
Pure Python, standard library only. Health Canada's Drug Product Database bulk JSON (no key,
no account) plus the Patent Register zip. The patent dates arrive as MM/DD/YYYY while
everything else is ISO — comparing them unconverted produced a perfectly plausible 0
patent-protected molecules, which is why there is now a check that fails when that count is zero.
src/fetch_data.py   ~50 MB, no key, no account
src/build.py        join -> data/molecules.json
src/report.py       every number quoted above
src/model.py        logistic regression, pure Python
src/null.py         the arithmetic null that killed our headline
src/export_web.py   web/index.html, opens from the filesystem
src/check.py        27 checks, at a denominator that cannot shrink
src/sabotage.py     break 28 things on purpose; do the checks notice?
What I learned
A passing count is not a quality signal. An early suite reported 15/15 while three
deliberate defects walked through it. Turning off date parsing passed because the format check
had nothing to check — a check that cannot fail is not a check. Skipping the page injection
passed because the check graded a stale index.html instead of regenerating it.
The most valuable script is the one that killed the headline. null.py exists because
"more suppliers, fewer disappearances" was going to be the pitch. Writing down the arithmetic
null took an afternoon and cost us the best-looking claim we had. The count that survived it is
worth more than the gradient that did not.
Built with
Python 3, standard library only. Health Canada Drug Product Database and Patent Register. No packages, no API keys, no accounts.
Built With
- health-canada
- logistic-regression
- no-dependencies
- python

Log in or sign up for Devpost to join the conversation.