-
-
Logo
-
Top of Dashboard
-
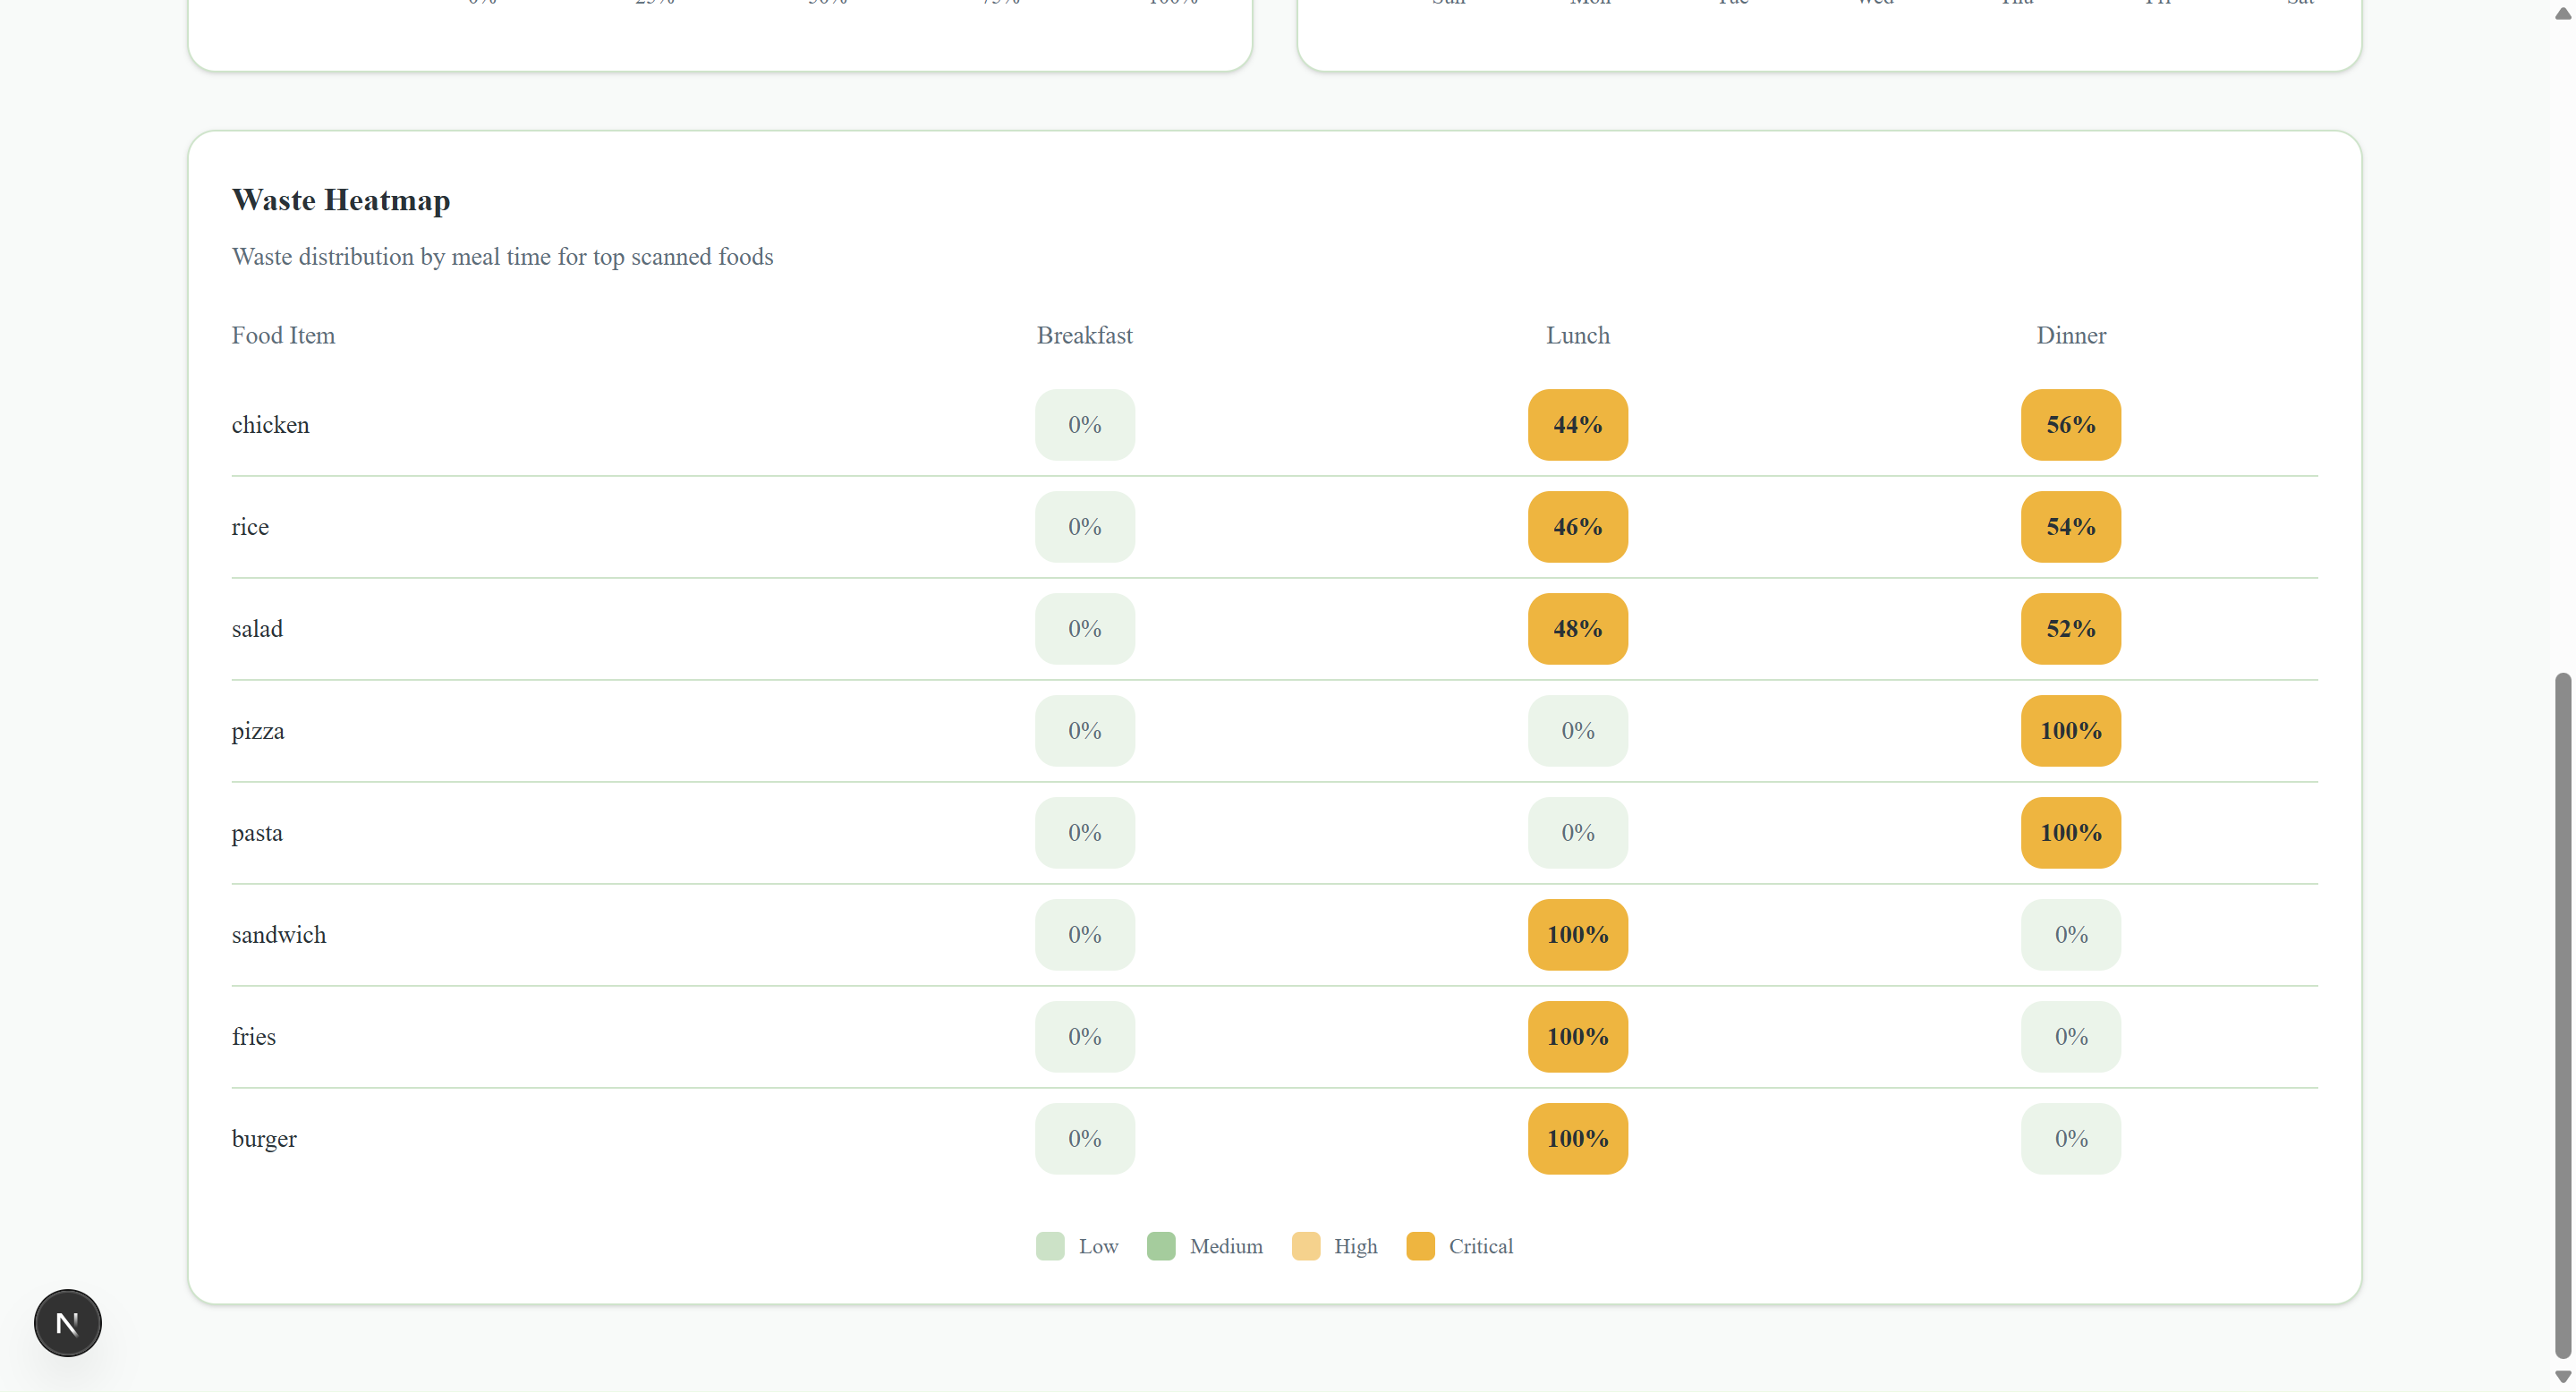
Lower Dashboard Widget
-
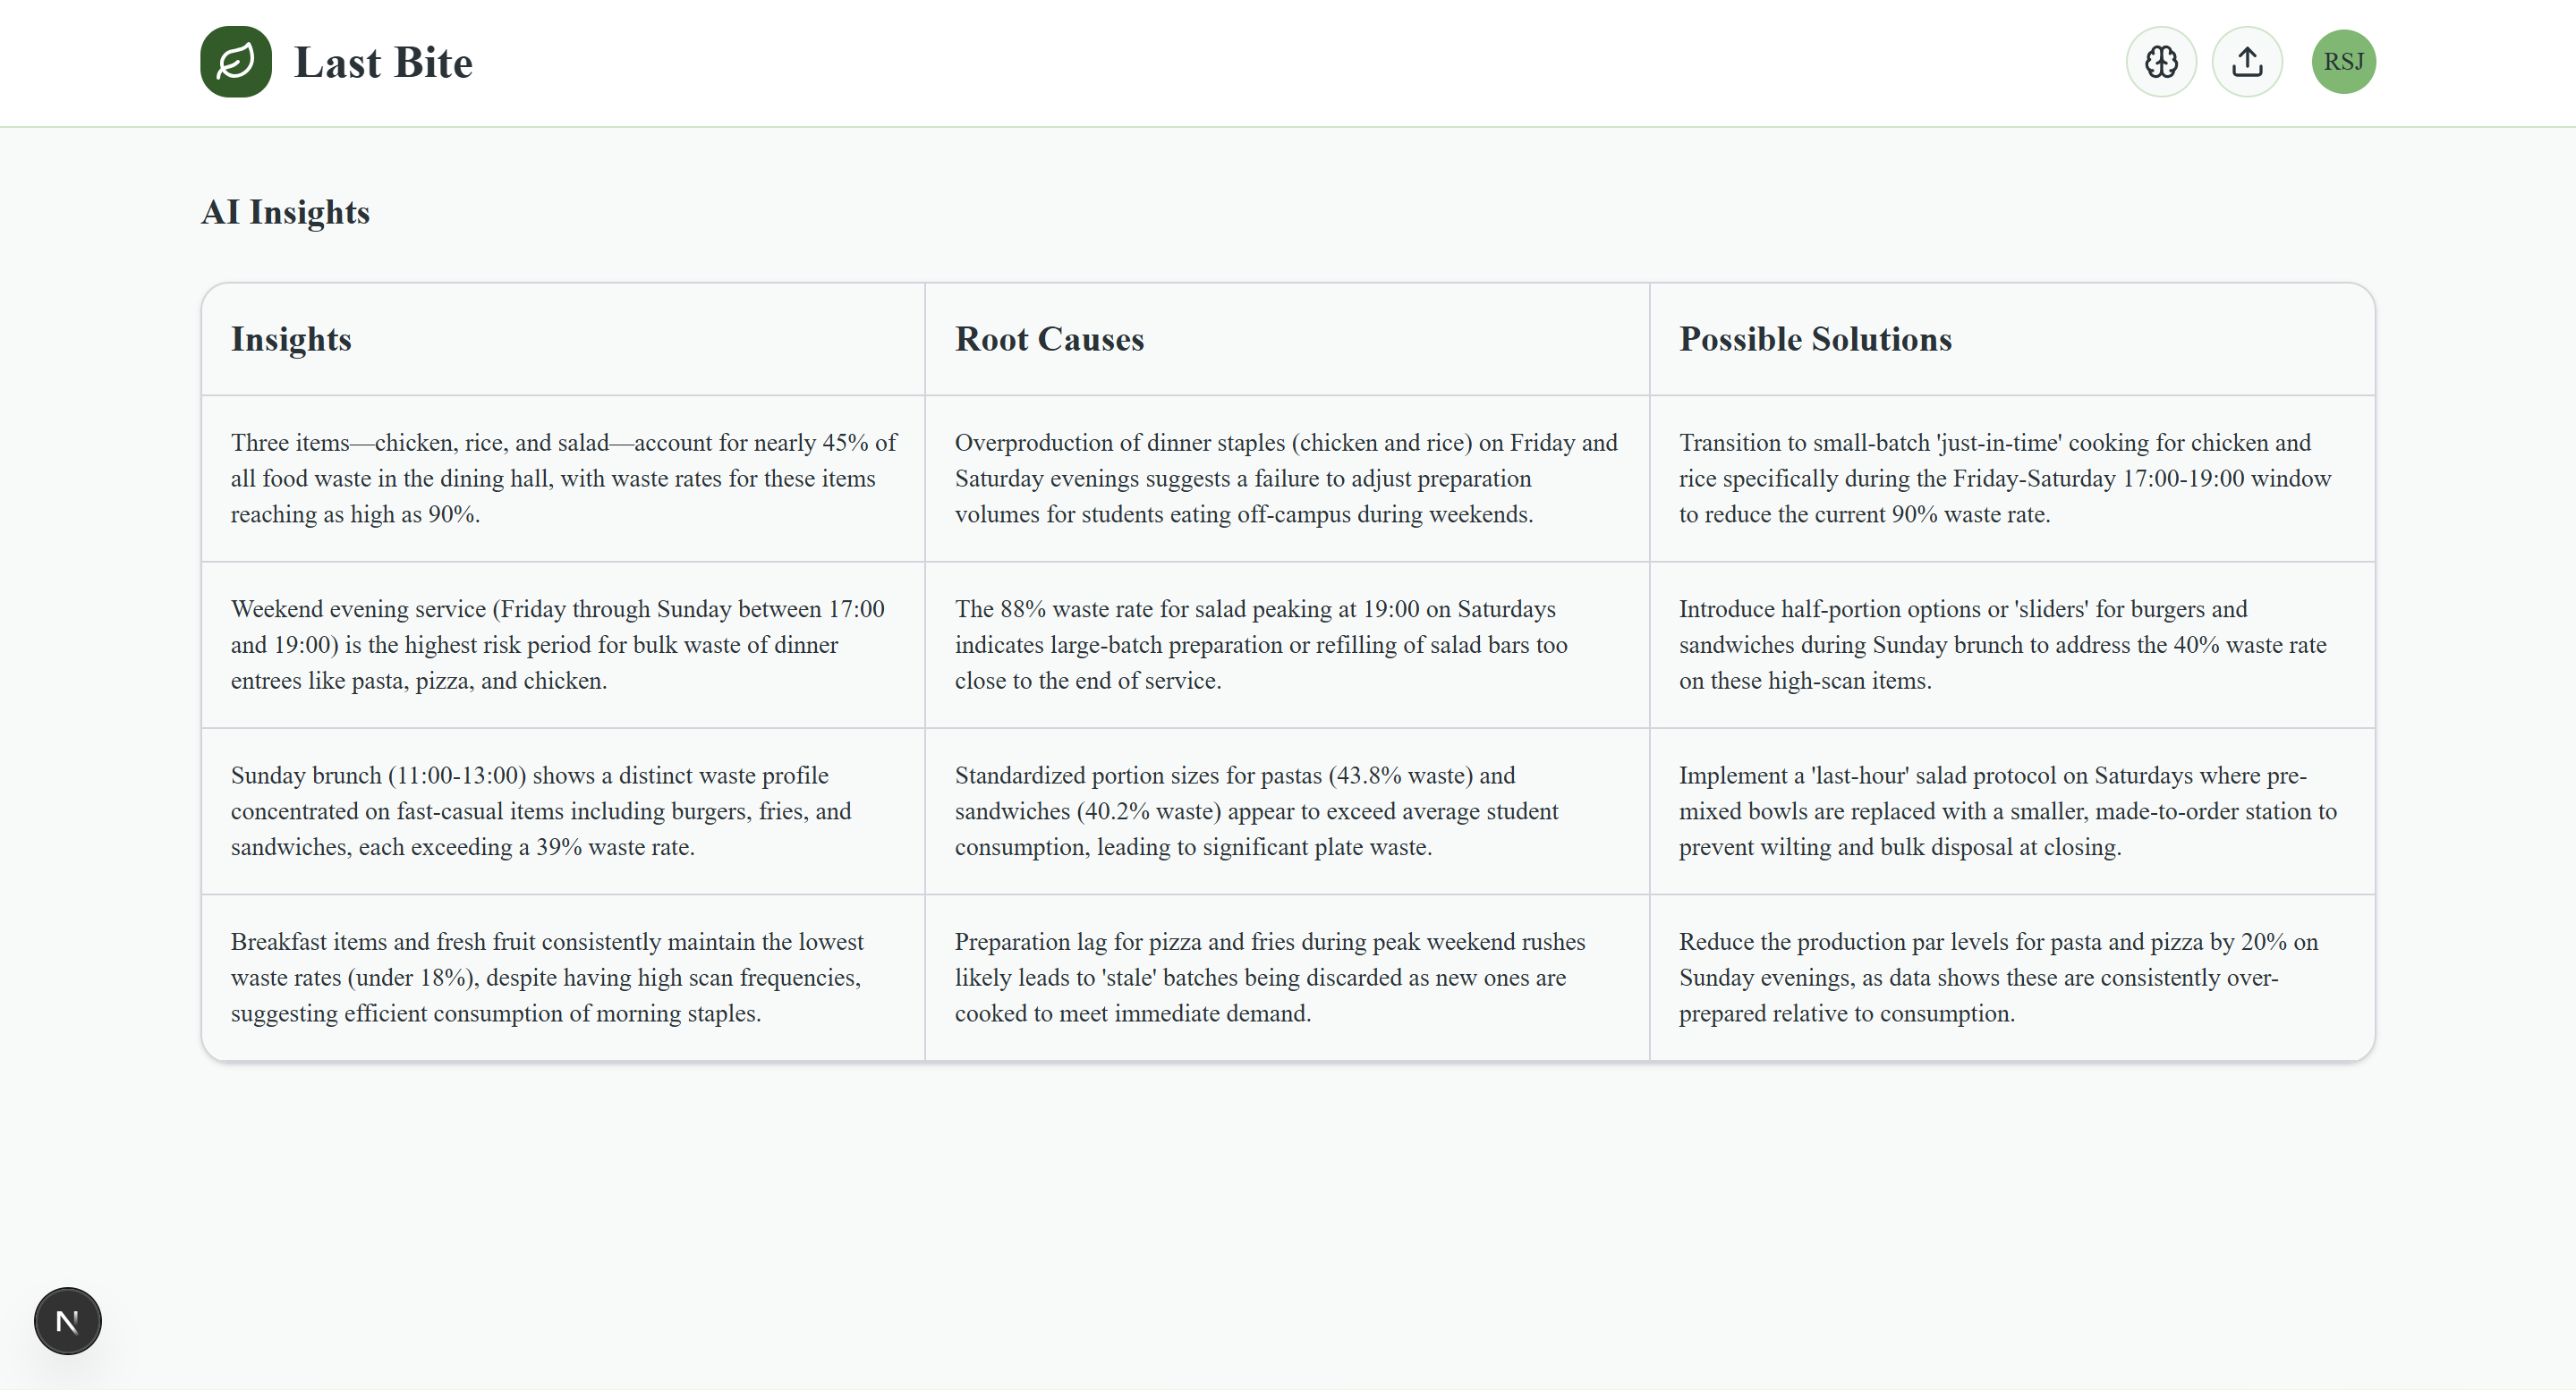
AI Insights Page
-

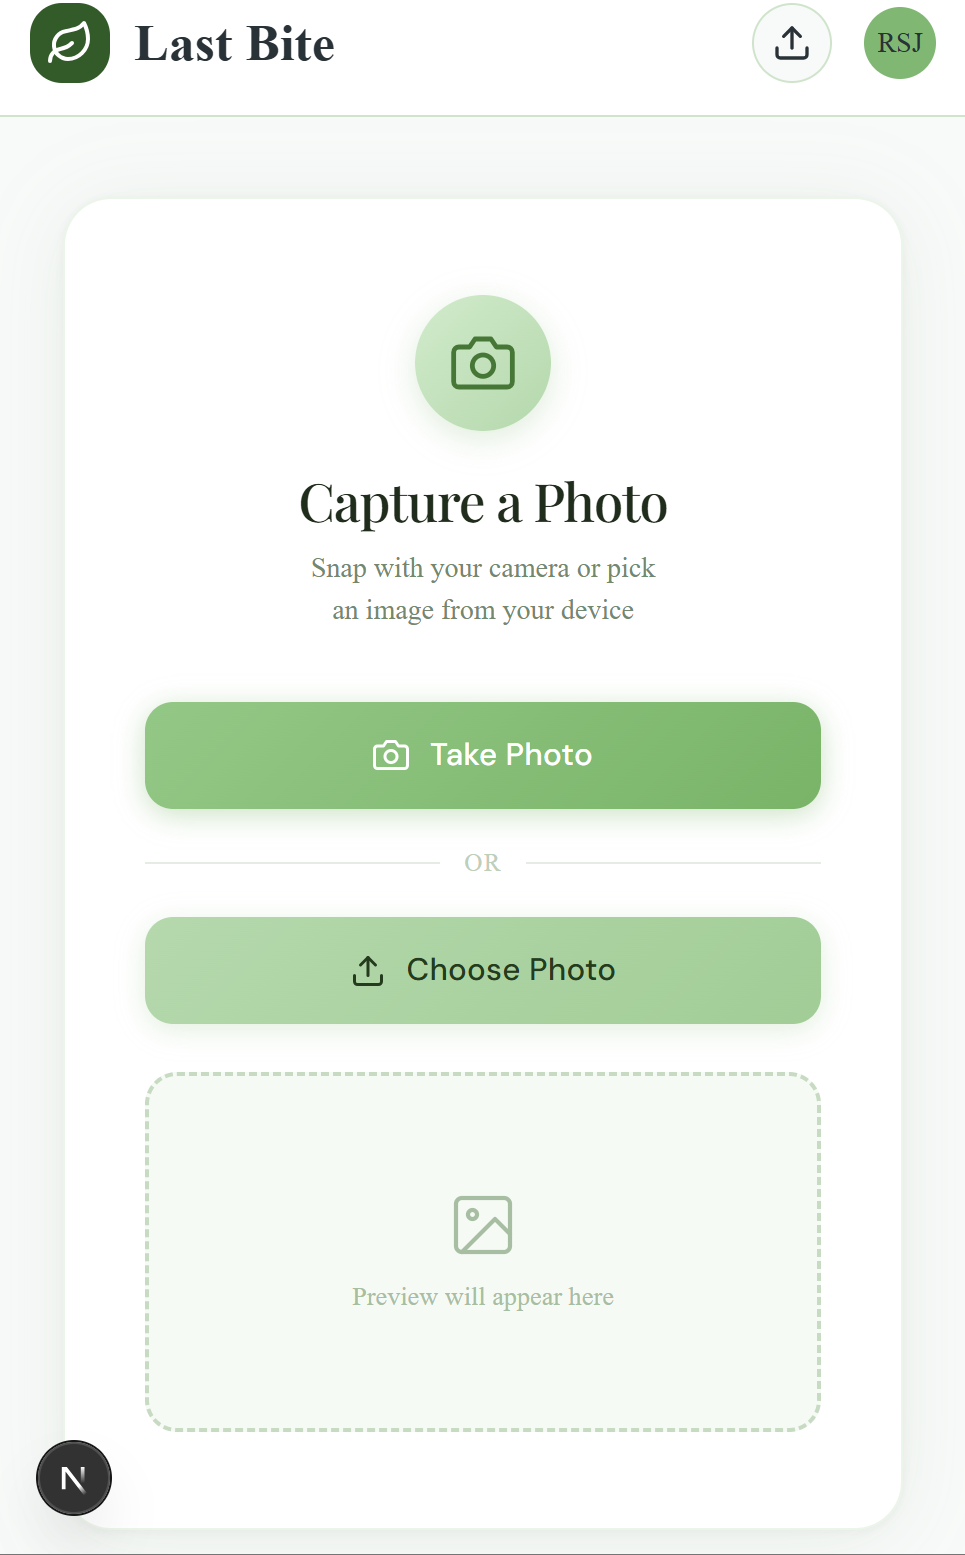
Demo Camera Scanner

Inspiration
Food waste in dining halls is a massive but invisible problem: staff can estimate what gets thrown away, but they rarely have concrete, item-level data. We realized that every leftover plate is an untapped source of insight. If we could capture and analyze that data at scale, dining services could make smarter decisions about portions, menus, and preparation timing. That idea became Last Bite.## What it does
What it does
Last Bite captures images of plates at the point of return, extracts the food items that remain, and logs each item with a timestamp. Each detection becomes a structured record that contributes to aggregate waste metrics.
For the hackathon demo, we simulate the fixed camera system using a browser-based capture interface. This allows us to demonstrate the full pipeline while keeping the capture mechanism flexible. Any device with a camera can act as the input source.
Once data is collected, the system aggregates it along three dimensions:
- Food item frequency
- Share of total waste per item
- Time distribution of waste events
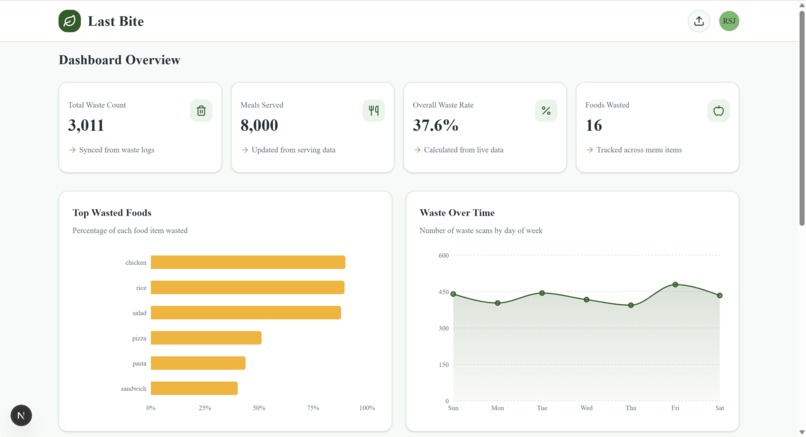
These aggregates are exposed through a dashboard that includes:
- Top wasted foods ranked by frequency and share
- Waste over time using timestamped scan data
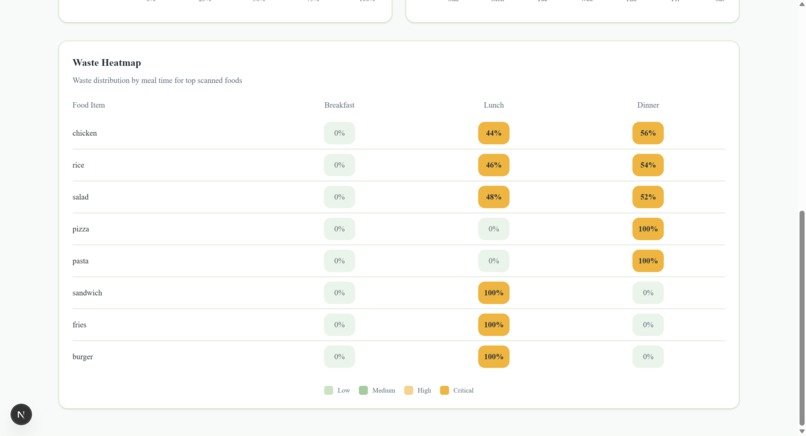
- A heatmap mapping food items to time buckets
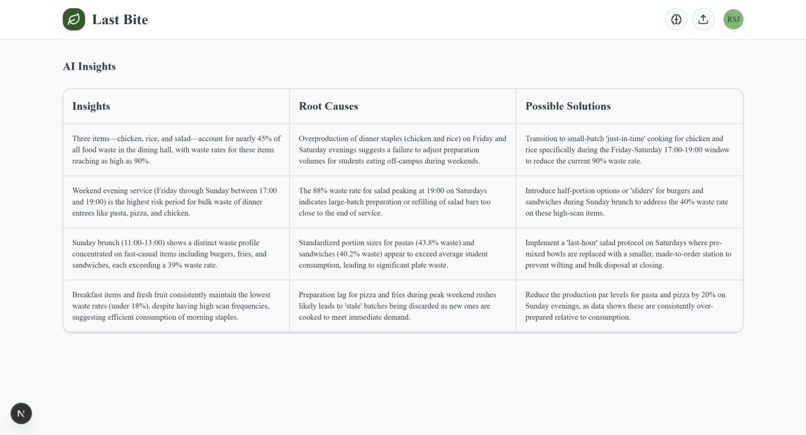
On top of this, a rule-based recommendation layer generates specific actions. For example, if a food item consistently exceeds a waste threshold, the system recommends reducing portion size or adjusting preparation volume.
How we built it
We structured Last Bite as a modular pipeline that mirrors a real dining hall workflow: capture → detection → ingestion → processing → analytics → visualization.
Capture Layer:
We simulate a stationary overhead camera using a web interface that captures or uploads plate images. This demonstrates how any camera-enabled device can act as a passive collection point with zero user interaction.
Image Detection:
Images are sent to a Python service that identifies food items using a multimodal model. Outputs are normalized into structured detections so they can be consistently processed downstream.
Data Ingestion and Logging:
Each discrete detected food item is treated as an individual event and recorded with a timestamp. This creates a granular event stream of “waste occurrences” rather than just storing images. This allows us to analyze patterns at the food level, time level, and frequency level without needing to reprocess images.
Backend API Layer:
The .NET API acts as the core procedural layer, converting detections into structured, timestamped scan records and updating metrics in real time. When detections are received, the API:
- logs each detected food item as an individual event
- assigns a unique identifier and timestamp to each record
- writes those records into the scans table
- updates total waste frequency per item
- recalculates each item’s share of total waste
- computes item-level waste rates relative to servings
Database Design:
We use a schema with two primary tables:
- scans table: stores event-level data (timestamped food detections)
- metrics table: stores aggregated food-level statistics
This separation enables efficient querying for both raw data and dashboard summaries.
Analytics and Insight Generation:
The computed metrics are then passed into a language model (Gemini) that generates three outputs:
- key insights
- root causes
- actionable recommendations
Instead of generic summaries, we constrain the output format and provide explicit operational goals, which leads to more concrete suggestions like adjusting batch sizes or modifying portioning strategies at specific times.
Frontend Dashboard:
The dashboard pulls both raw and aggregated data and presents:
- summary metrics (total waste, meals served, overall waste rate)
- ranked visualizations of highest-waste foods
- time-based charts showing when waste occurs
- heatmaps of waste patterns
Challenges we ran into
One of the main challenges was getting all parts of the system to communicate reliably across different services. Our pipeline spans a web-based capture interface, a Python image-processing service, a .NET API, and a database-backed dashboard. Ensuring that data flowed correctly between each layer required careful alignment of request formats, endpoints, and response structures. Small inconsistencies in how detections were formatted or passed between services would break downstream processing, so we had to standardize the data contract across the entire pipeline.
Another challenge was integrating the camera-based upload system into the web application in a way that felt seamless. Since our goal is a passive capture system, the interface needed to simulate real-world usage while still being stable enough for a demo. Handling image capture, preview, upload, and error states in the browser while keeping the experience simple required more work than expected.
We also faced challenges with food detection and output consistency. Because we did not have the time or resources to train a custom computer vision model, we relied on a multimodal model to identify food items. While this worked well for rapid prototyping, it introduced variability in output format. We addressed this by using structured output constraints and additional normalization steps to ensure that detections were consistent and usable by the backend.
Finally, generating meaningful insights from the data required iteration. It was not enough to simply pass data into a language model. We had to carefully structure the input and constrain the output format so that the system produced clear, actionable recommendations rather than generic summaries.
Accomplishments that we're proud of
We are proud that Last Bite functions as a complete data system rather than a loose collection of features. A plate image enters one end of the pipeline and becomes a timestamped waste record, an updated metric profile, and a set of concrete operational recommendations.
We are also proud of the reliability of our end-to-end integration. Despite spanning multiple services, we established consistent data flow and formatting so each layer can build directly on the last without manual intervention.
Finally, we are proud that the system produces outputs that are immediately useful. Instead of just visualizing waste, it surfaces clear patterns and ties them to specific operational changes dining staff can act on.
What we learned
We learned that building a multi-service system depends on enforcing consistent data contracts across every layer. Even small mismatches in formatting between services can break the entire pipeline, so standardizing how detections and metrics are structured was critical.
We also learned that working with model outputs in practice requires constraints and normalization, not just good prompts. Ensuring consistent, structured responses was necessary to make the system reliable.
Finally, we learned that the value of analytics comes from how data is modeled. Representing waste as timestamped food events enabled meaningful analysis across time and items, and made it possible to generate insights that directly support decisions.
What's next for Last Bite
Next, we want to deploy a fixed camera system at tray return stations to enable continuous, passive data collection in a real dining environment.
We also plan to improve detection by estimating portion sizes, allowing us to measure how much food is wasted, not just what items appear.
On the analytics side, we want to expand metrics to include meal periods and locations, and introduce more predictive insights so dining staff can adjust operations before waste occurs.
Long term, we aim to scale Last Bite into a system that continuously tracks and reduces food waste across large dining operations.


Log in or sign up for Devpost to join the conversation.