-
-

Landing page
-
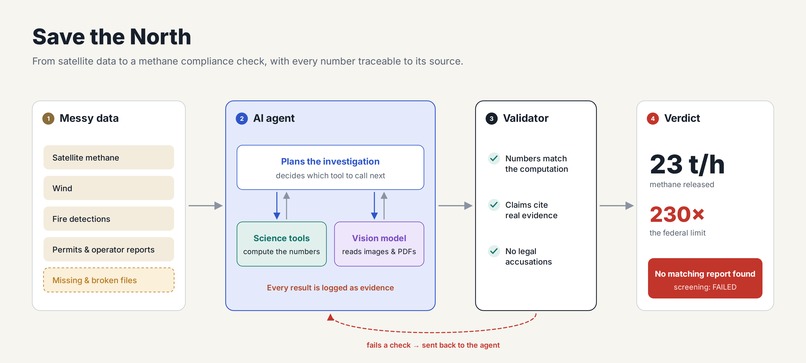
System Architecture
-
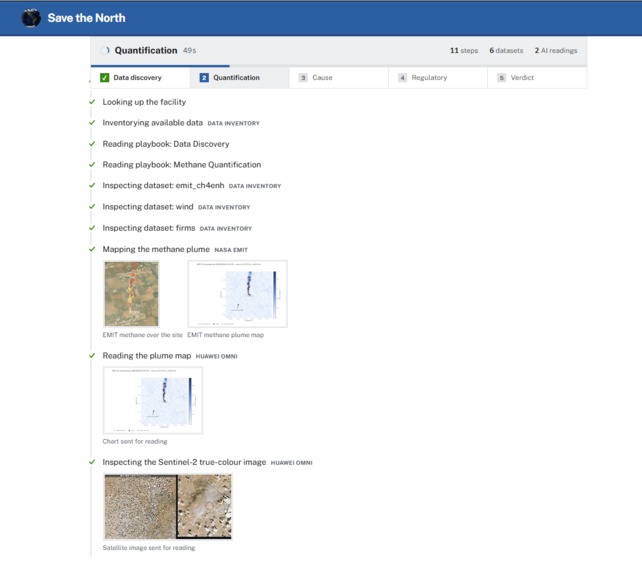
Image of the Agent working through turns
-
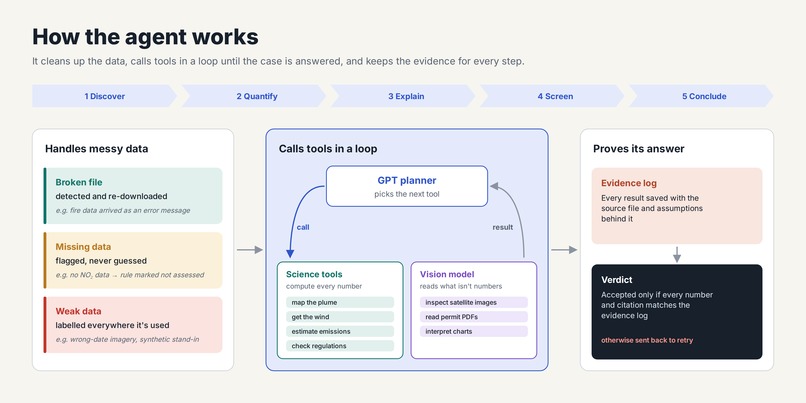
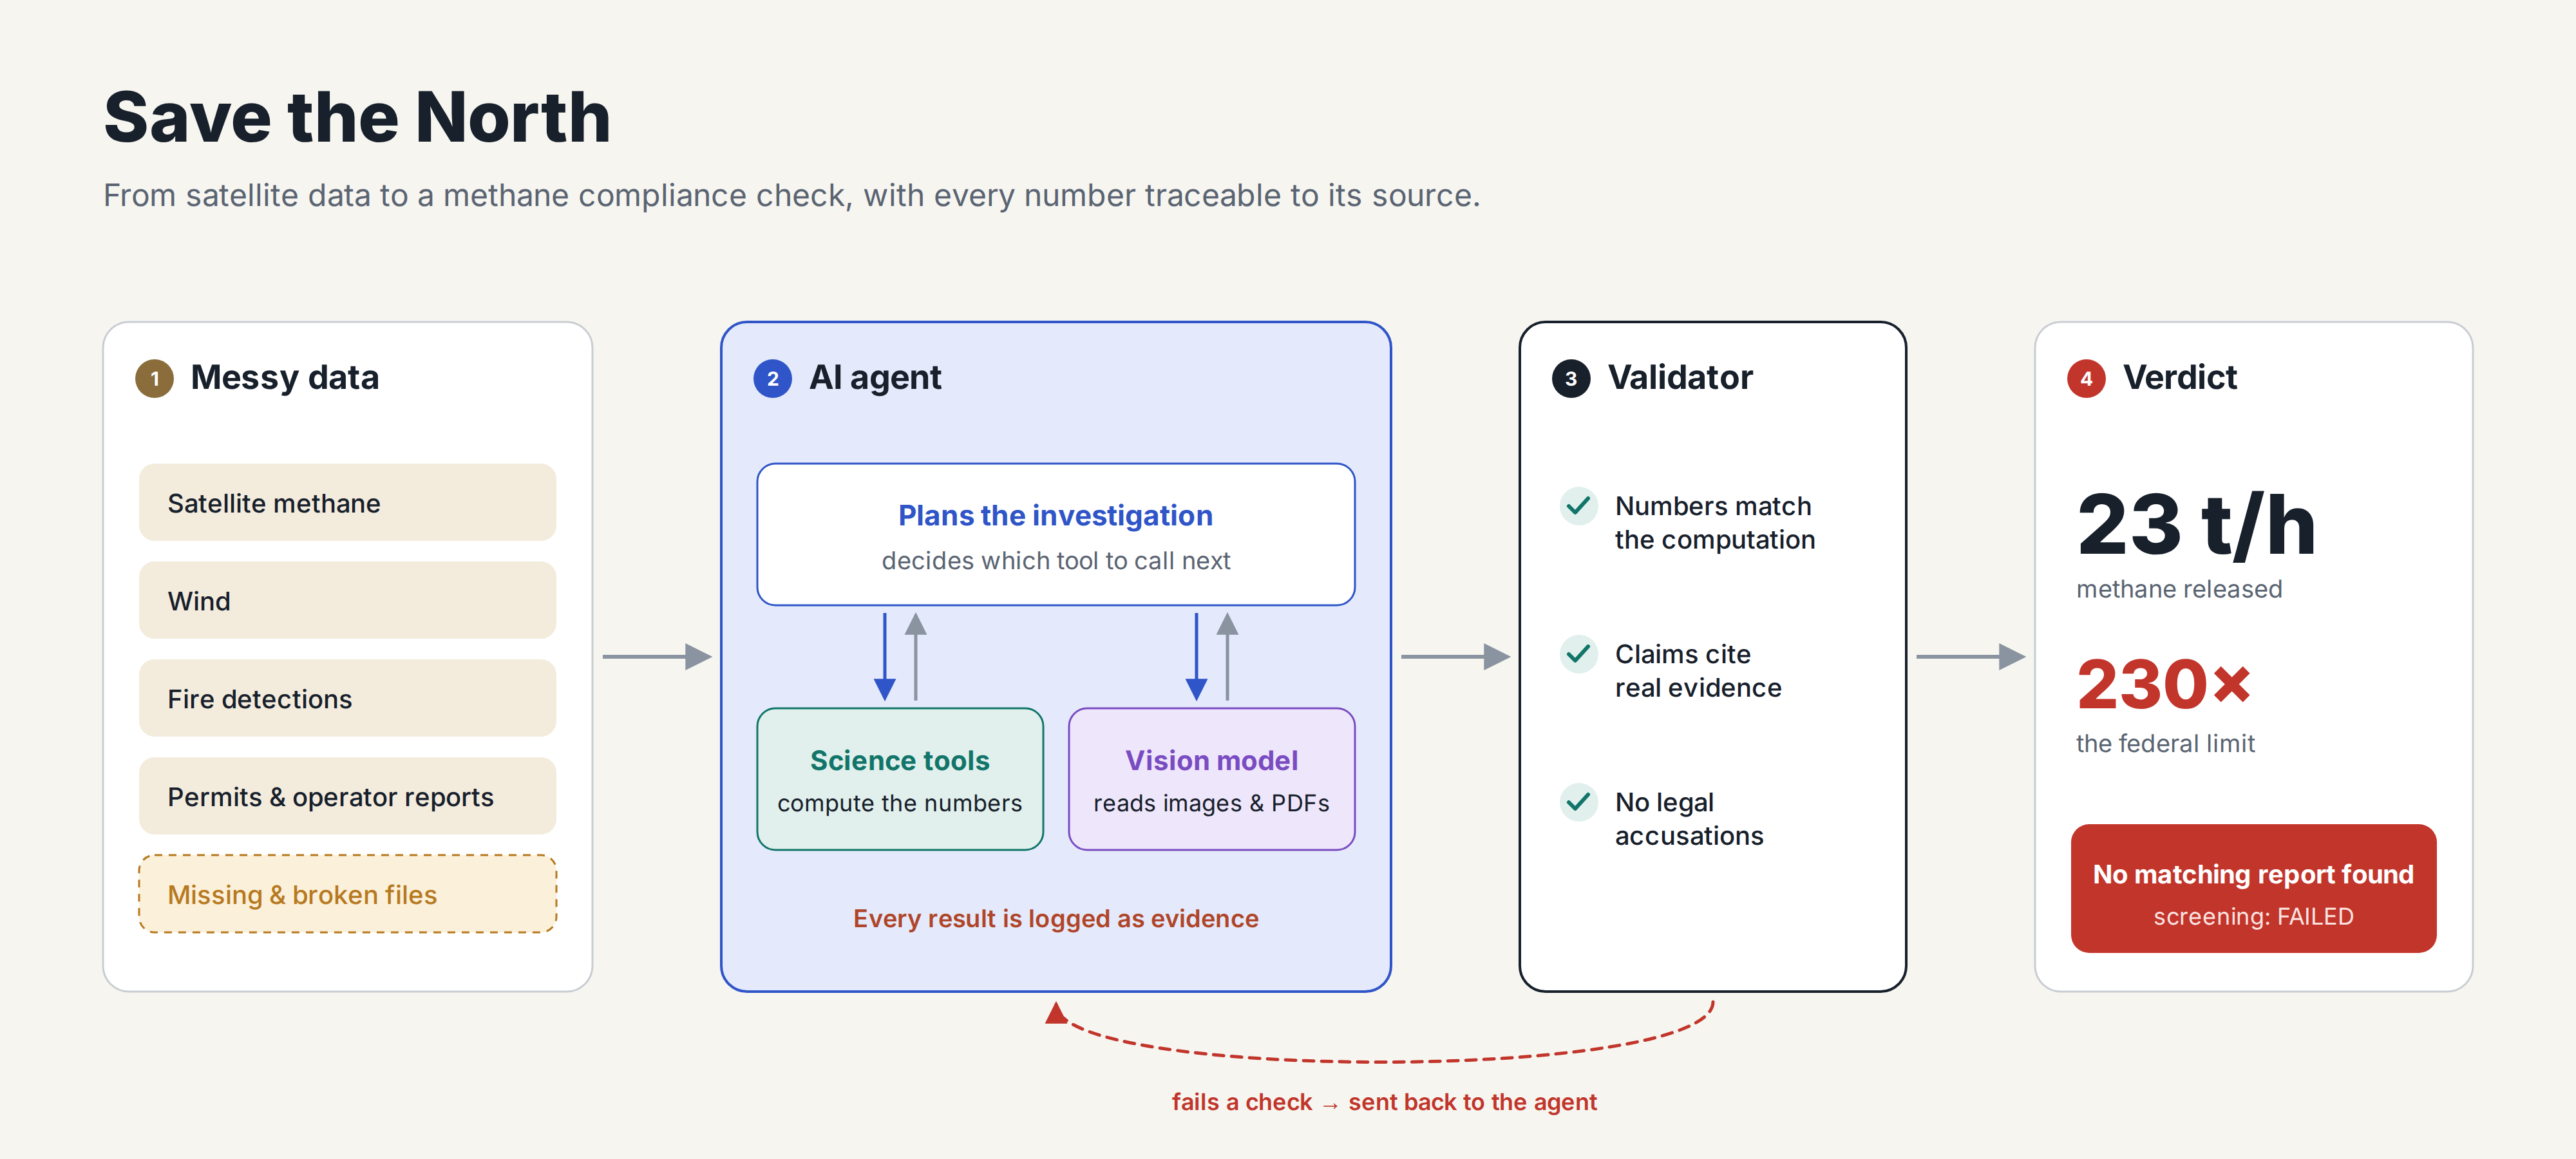
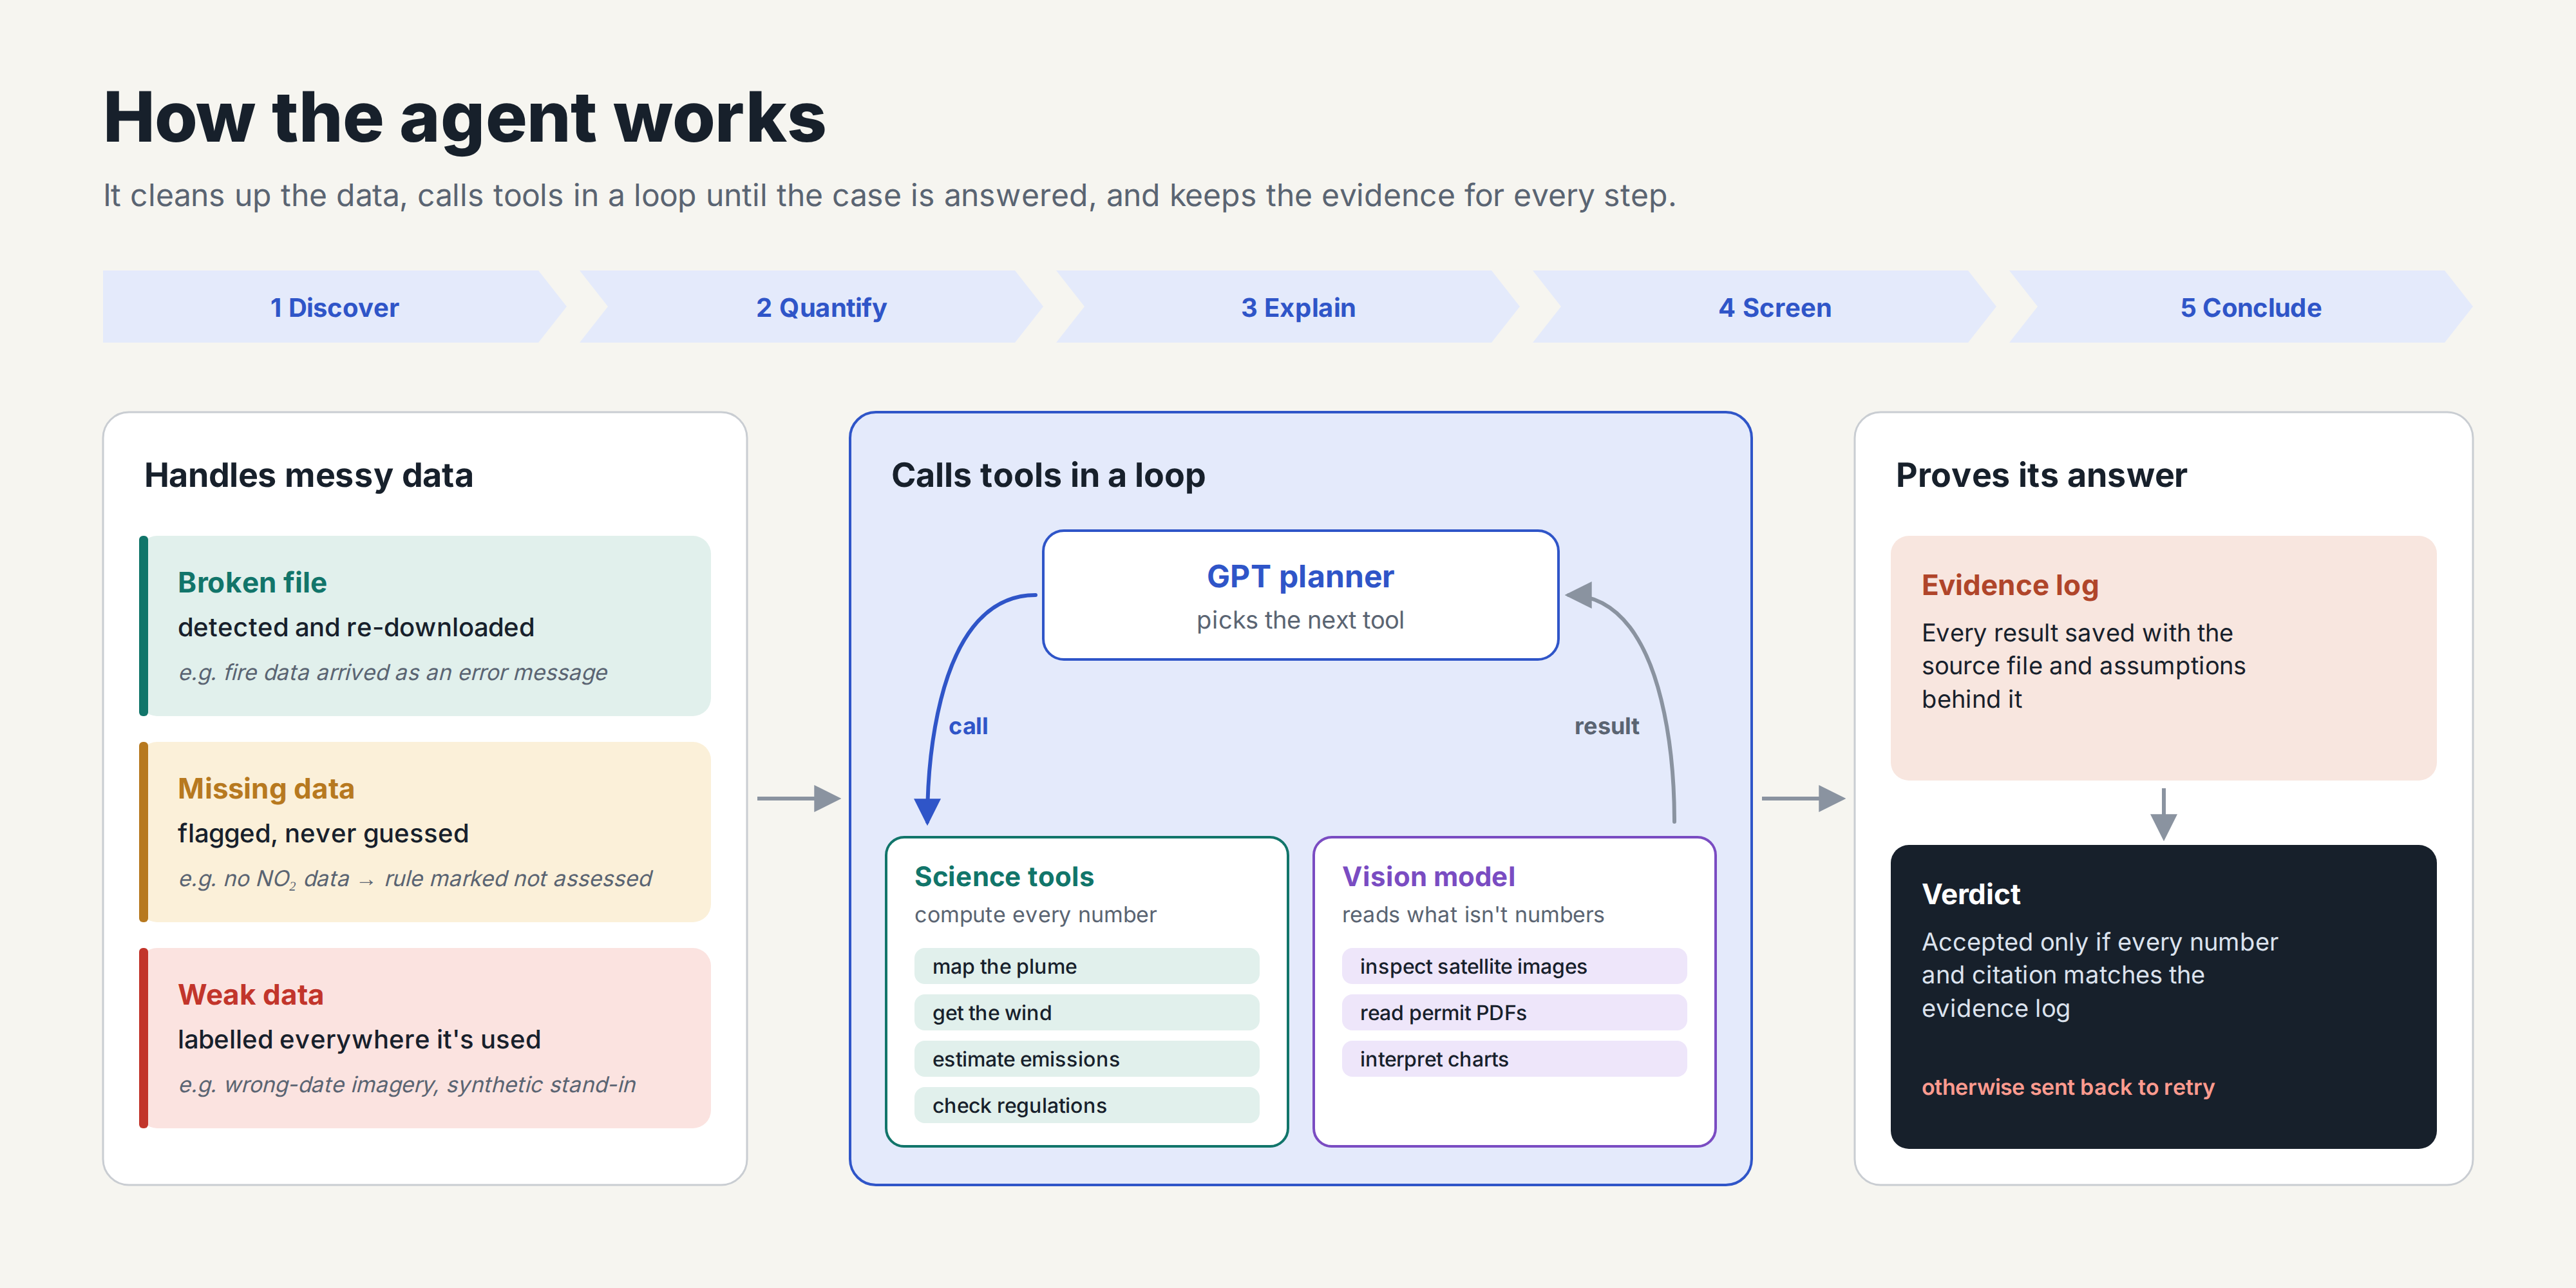
Agentic Flow
-
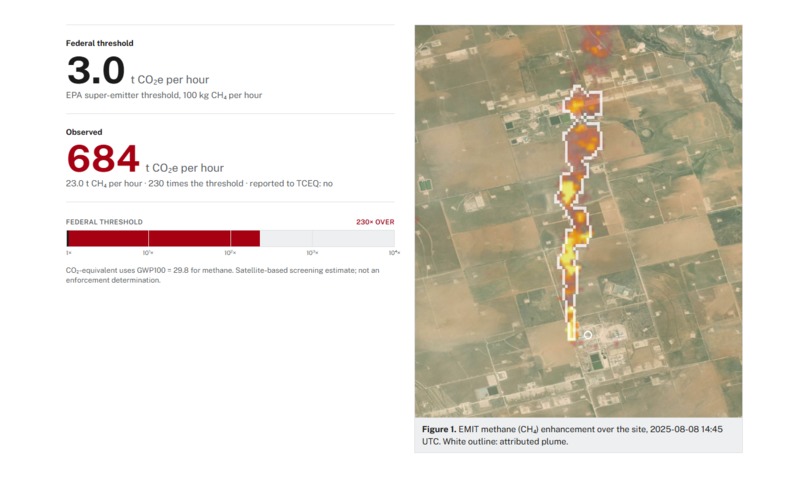
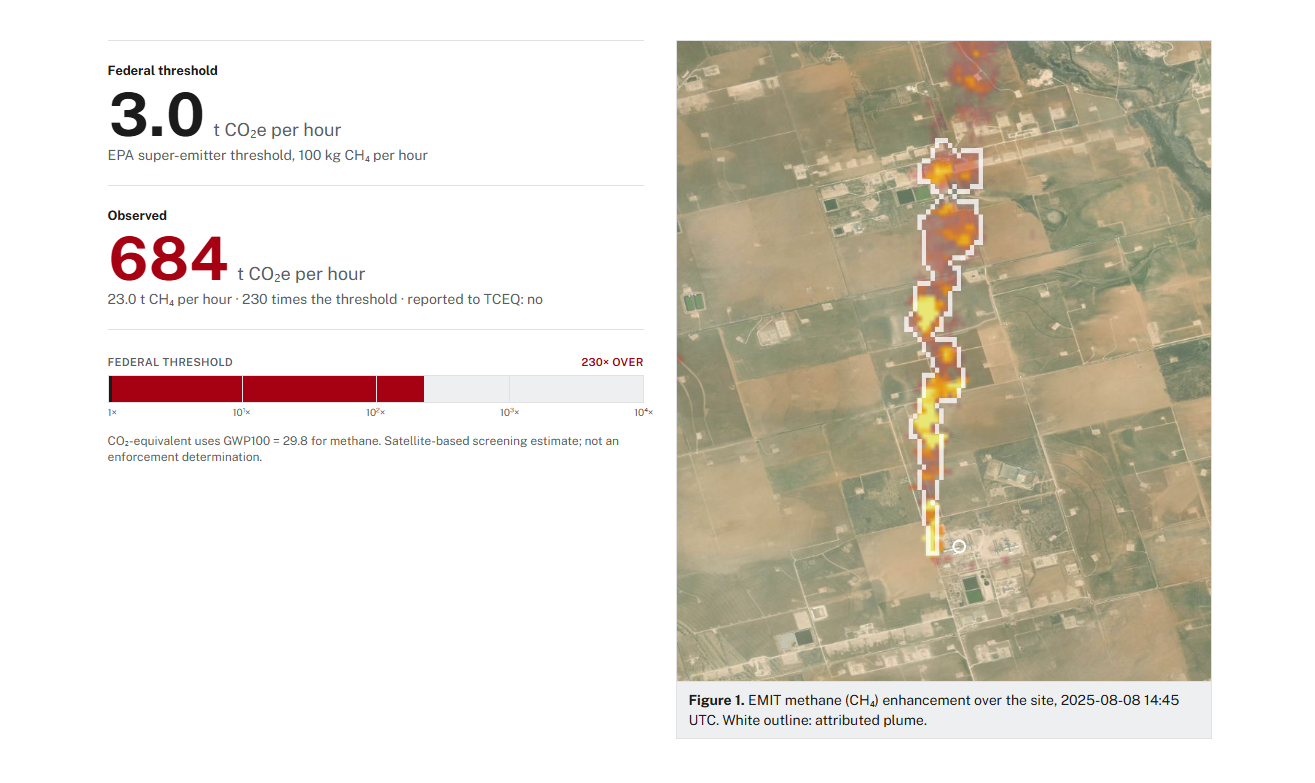
Summary of findings from the agent. The agent reports a 230x factor of extra emissions. The official number is 195x.
-
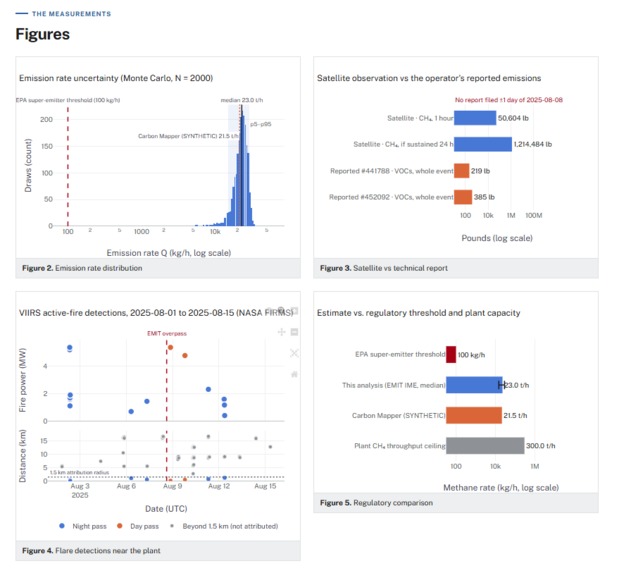
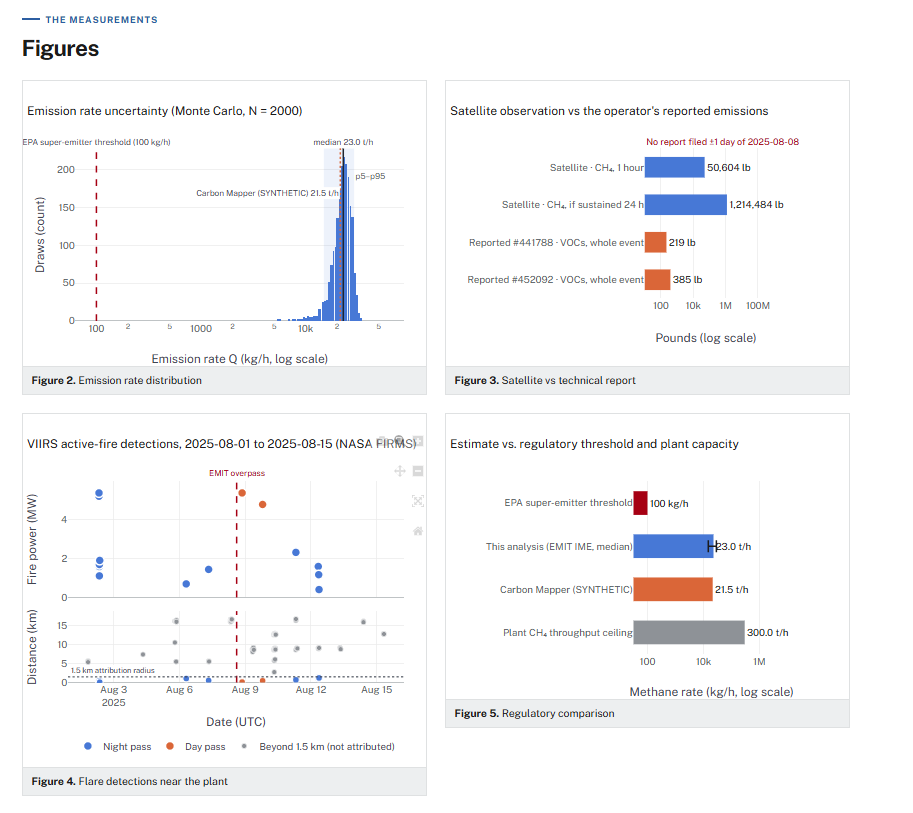
Additional results and figures generated by the Agent based
-
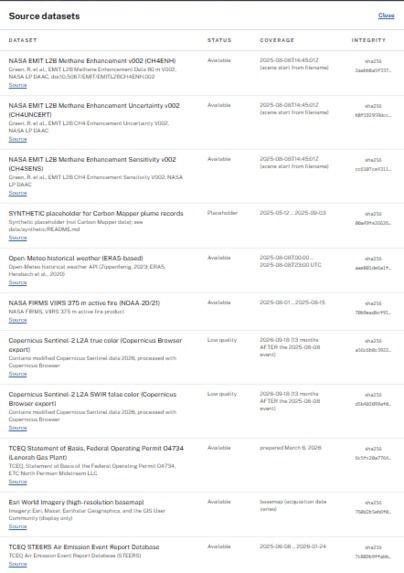
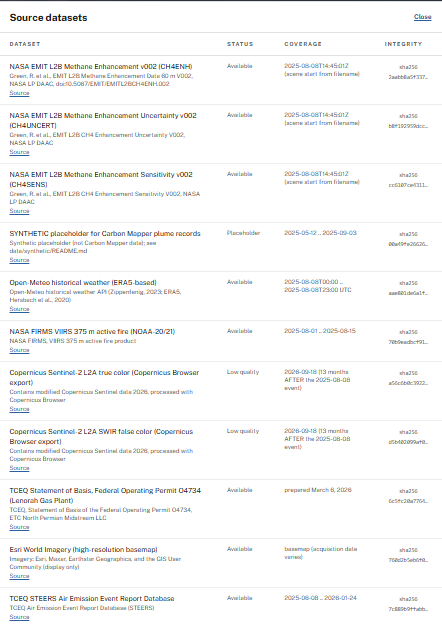
Full-list of datasets used by the Save the North agent.

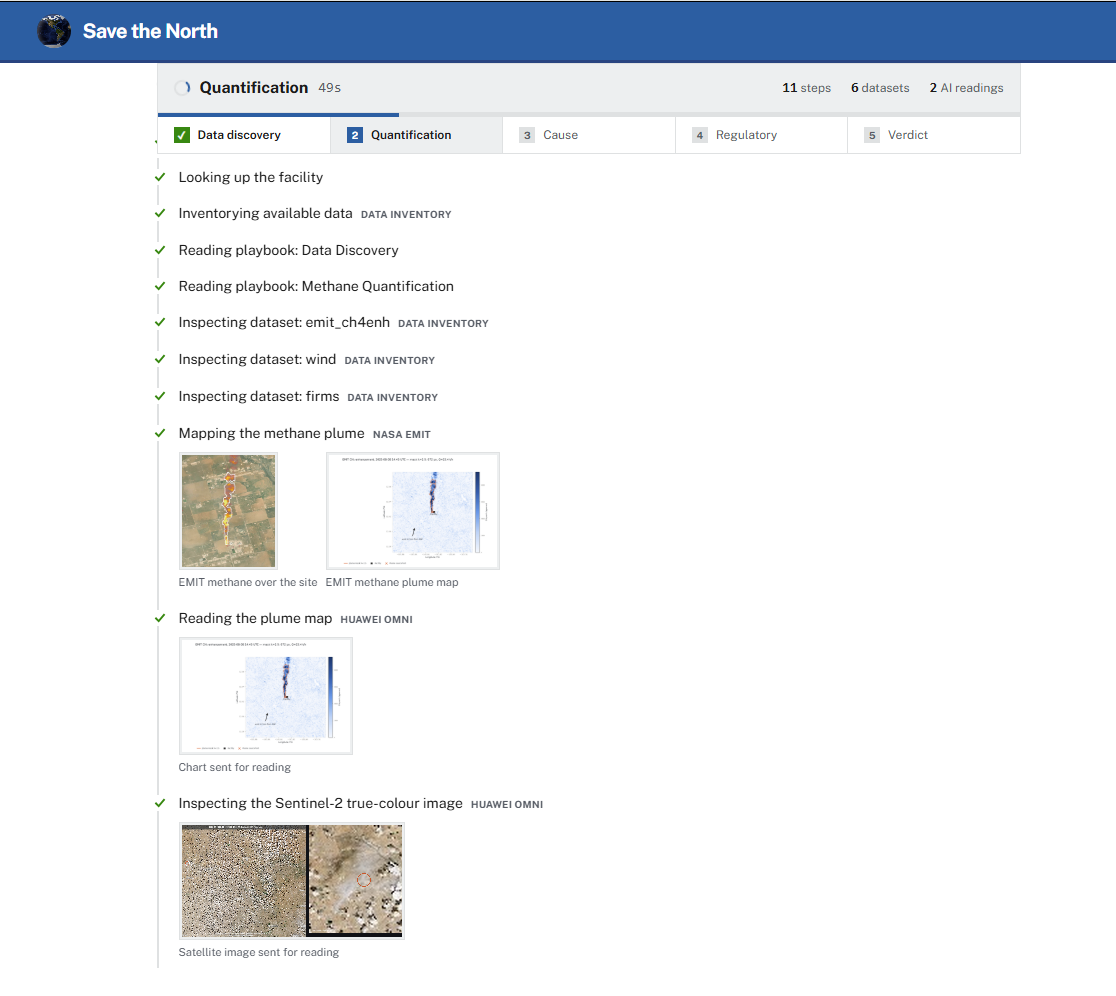
Save the North: Agentic Analysis for Factory Emissions
Inspiration
How do we make sure factories don't pollute more than they're allowed to? How do we know that oil companies are following environmental laws?
A regulator who wants to check a single factory has to pull satellite emissions data, find the matching weather information, request the facility's permit, search a database of emissions events, and then ask an atmospheric scientist to run a calculation to estimate emissions on that day.
This process is simply infeasible at scale; so many factories go unregulated and, as a result, overpollute. For example, when a methane plume stretching nearly five kilometres downwind came from the Lenorah / Red Lake gas plants in Texas, regulators couldn't respond until weeks later. By then, hundreds of tons of unreported, over-limit fossil-fuel emissions had been released into the atmosphere.
Goal
Our goal was to build an agent that can reason from raw, messy, multi-source observations of factory emissions and alert regulators to overpollution in real time. For this project, we isolated general-case data from:
- NASA EMIT L2B methane enhancement, uncertainty, and sensitivity rasters
- NASA FIRMS VIIRS thermal detections (flaring activity near the plant)
- ERA5 / Open-Meteo wind, temperature, and pressure at the overpass hour
- Copernicus Sentinel-2 true-colour and shortwave-infrared imagery
- Carbon Mapper plume records
Running our agent on the example of the Lenorah factory, we further gathered data from:
- Texas Commission on Environmental Quality (TCEQ) Title V permit (Statement of Basis, an 18-page PDF)
- TCEQ State of Texas Environmental Electronic Reporting System emissions-event reports filed by the operator
We designed a robust agent that uses tools, skills, and agent-to-agent frameworks to reason across these satellite datasets, legal documents, and emissions reports, and then runs physics calculations to estimate emissions.
What is Save the North?
Save the North is a factory emissions calculation agent. Regulators or members of the public give it a target oil or gas facility and a date. A GPT-5.6-sol orchestrator (OpenAI) reads detailed skill files, plans its own investigation, calls tools to process the data, calls the Huawei OMNI multimodal API to read charts and documents, screens the result against federal standards, ranks its own evidence, and produces a screening report.
End-to-end agent pipeline
The agent runs in five phases:
- Discover: Load the skill playbooks, find the facility, and inventory the available data.
- Skill:
data-discovery - Tools:
list_skills,load_skill,find_facility,list_available_data,describe_dataset
- Skill:
- Quantify: Crop the satellite scene, build a plume mask, pull wind data, and compute the emission rate through uncertainty analysis.
- Skill:
methane-quantification - Tools:
plume_map,get_wind,compute_emission_rate,compare_estimates - Huawei OMNI:
analyze_chartreads the plume map and the uncertainty distribution
- Skill:
- Explain: Look for flares in VIIRS data around the overpass, inspect Sentinel-2 imagery, and read the permit.
- Skill:
flare-and-cause-analysis - Tools:
flare_activity,physics_bounds,annualize - Huawei OMNI:
analyze_image(Sentinel-2 imagery),read_document(permit pages)
- Skill:
- Screen: Evaluate the estimated emissions against the federal emission ruleset, NOx permit limits, and greenhouse-gas reporting requirements.
- Skill:
texas-regulatory-check - Tools:
reporting_timeline,check_regulations - The NOx and greenhouse-gas reporting checks return
NOT_ASSESSED, because that data wasn't available
- Skill:
- Rank and conclude: Hybrid-search and rerank every piece of generated evidence, then have the orchestrator issue a verdict on whether the facility over-emitted.
- Skill:
verdict-report - Tools:
rank_evidence,show_chart,submit_verdict(accepted only if it passes the validator)
- Skill:
A typical run involves numerous tool calls and multimodal readings in about three minutes.
How we built it
- GPT-5.6-sol is the orchestrator (OpenAI Responses API with function calling). It decides what to look at next, what is worth explaining, and what the evidence adds up to.
- Python tools perform the deterministic science. The plume is segmented from the surrounding scene, analyzed by pixel to determine volume and then mass.
- Huawei OMNI (
qwen3.5-omni-flash) reads images and documents such as the plume map, the flare timeline, additional satellite imagery, and the facility's environmental permit. We chose Huawei OMNI because analyzing such diverse data can't be done by a conventional text-only chatbot; it requires a multimodal approach. - OpenAI-format tools. We designed tools in the OpenAI response format for the orchestrator, including deterministic computation tools, Huawei OMNI tools, and meta-tools for skills, data inventory, and verdict submission. The OpenAI format works best for this project because it provides a standardized JSON schema for communication between different models.
- Dedicated skills guide the agent through the process so it doesn't thrash or lose the plot: data discovery, emission quantification, flare analysis, regulatory checking, and final report generation.
- Hybrid evidence ranking. Before submitting a verdict, the agent must call the
rank_evidencetool. It takes all the evidence generated so far, retrieves it with keyword (BM25) and vector search, fuses the two rankings, and then has GPT-5.6-sol rerank it by importance to each of five questions, including which data are unreliable, synthetic or missing.
Skills (5)
data-discovery: take inventory before analysing anything, treat missing data as a finding, and never assume a dataset exists.methane-quantification: how to outline the plume, which detection threshold to prefer, and how to report the uncertainty.flare-and-cause-analysis: how close in time and distance a flare must be to matter, and how to weigh the possible causes of a release.texas-regulatory-check: the federal and Texas rules, the reportable quantity, and the ±1-day window for matching a filed report.verdict-report: the required sections of the conclusion, careful non-accusatory wording, and how to cite evidence.
Tools (20)
Data analysis
list_available_data: reads the manifest built from our raw folder, where every file is classified by its contents, and returns each dataset's status, dates, quality rating and warnings, plus a list of what is missing.describe_dataset: returns the units, dimensions, map bounds, date coverage and summary statistics for one dataset, so the agent can inspect an unfamiliar file before using it.reporting_timeline: parses the operator's emissions-event reports from their spreadsheet exports and puts them on one timeline with the satellite detections
Reasoning and science operations on data
plume_map: cuts out a ±6 km window around the plant, estimates the normal methane background from a surrounding ring (a two-pass median method, so the plume itself doesn't skew it), and outlines the plume at five detection thresholds. Only plume pixels connected to the plant are kept.compute_emission_rate: converts the plume into a total mass of methane, then into a leak rate using the wind speed (the integrated mass enhancement method from Varon et al., 2018). It runs 2,000 Monte Carlo simulations that vary the wind, the plume threshold and the sensor noise, and reports a median with a 5th–95th percentile range.physics_bounds: It compares the leak rate with the most the plant could physically process (it comes to 7.7%).check_regulations: screens the result against federal. returnsEXCEEDSif the low end of the uncertainty range is over the limit.
OpenAI
rank_evidence: combines keyword search (BM25) with OpenAItext-embedding-3-smallvector search, fuses the two rankings, then has GPT-5.6-sol rerank the evidence for five questions: threshold, reporting, attribution, cause and reliability.
Huawei OMNI
analyze_image: sends a satellite image to Huawei OMNI with the facility circled, plus an 8× zoom of the site, and asks what kind of facility is there. It also asks whether the image's date and resolution support a confident answer, and for our wrong-date Sentinel-2 images, OMNI said they don't.read_document: finds the most relevant pages of the 18-page permit, renders them as images, and has Huawei OMNI read them to extract what the plant is authorised to do.analyze_chart: has Huawei OMNI read our own charts, such as the plume map and the uncertainty distribution, and check them qualitatively (for example, whether the plume points the same way as the wind).
Other tools
list_skills/load_skill: list and load the skill playbooksfind_facility: fuzzy-searches the facility registryget_wind: wind speed, direction, pressure and temperature at the time of the satellite passcompare_estimates: compares our estimate with Carbon Mapper's for the same plumeflare_activity: fire detections within 1.5 km of the plant around the satellite passannualize: illustrative yearly emission projectionsshow_chart: adds a chart to the final reportsubmit_verdict: submit final report
Additional specifications
- Backend: FastAPI + Python 3.11 with SSE streaming
- Frontend: React 18 + TypeScript + Vite
- Visualization: Plotly figures
Overcoming the messy data challenge for reasoning
Our inputs were a folder of legacy .xls emissions-event reports, GeoTIFF rasters, JPG browser screenshots, nine CSV fragments, an 18-page PDF permit, and JSON weather data. When we tried running an agent without any data-normalization tools, reasoning over such a messy and diverse dataset led to information loss and model thrashing. So we built a set of data-preparation and reasoning tools for the agent:
- Inventory pass: A tool that tells the agent what data is actually present.
- Catching broken files: The inventory pass checks what each file actually contains. One fire-detection "CSV" turned out to be a saved API error message. The inventory flagged it, and we re-downloaded the data in 5-day chunks from three satellites.
- Tile selection: Two satellite tiles covered the site, but one was blank over the plant, so we gave the agent instructions to check the plant's pixel first and use the tile that actually contains data.
- Spreadsheet parsing: Some exports arrived as spreadsheets (one row per emission point × contaminant), so we parse them as tables.
- Multimodal assisted comprehension: Figures were captioned using the Huawei OMNI API for the agent to understand their content. Additionally, we mark key landmarks on the figures before sending them to Huawei OMNI (e.g., a circle around the factory in the satellite image, plus a zoomed-in view), so the model knows exactly where to look.
- Detailed skill files explaining how to reason through data: The skill files we wrote for our project tell the agent to approach understanding the data in a step-by-step manner. Without the skill, the agent tried to reason through the data at random. The skill instructs it to call the inventory pass tool, then recover broken data through tile selection and spreadsheet parsing, and generate captions for visual data through the Huawei OMNI API tools.
What we're proud of
A real-world use case
The agent independently identified overpollution at the Lenorah Gas Plant. We provided unlabelled, messy datasets scattered through the repository. It independently called data-analysis tools to reason through satellite imagery, weather data, emissions data, regulatory information, and incident reports filed with the Texas government. It then performed its analysis using the tools, skills, and multimodal support described above, ultimately concluding that the site was emitting 230× its emission cap. This number is an estimate that serves as a strong first step in helping regulators identify potential sites of overpollution.
The entire process took under 10 minutes, compressing weeks of regulatory work into minutes so regulators can get real-time information and act almost immediately.
A creative and safe use of Huawei OMNI
We used the multimodal model creatively across a wide range of data: the vision model checks whether the plume's shape on the plume map is consistent with the wind direction and describes what kind of facility sits at the target coordinates in the Sentinel-2 crop; and the text model reads the permit pages and extracts what the plant is actually authorized to emit.
What we learned
A strong OpenAI orchestrator changes what you can attempt
We expected to write a deterministic orchestration program for our project given the complexity, need for a structured process, and detail. However, we built an agent through the OpenAI API. This was possible by following GPT best practices. Namely, we provided good tool descriptions, envelope-shaped results, and skill playbooks. As a result, GPT-5.6-sol carried out a 32-turn investigation that was consistent and followed the process we wanted exactly. This showed us that agents with carefully designed MCP support can conduct long-range, thorough scientific investigations. Moreover, using an agent allowed real-time adjustment when data was corrupted or missing, which a traditional script could not handle.
Codex made our code connect with the world
Our project required connecting to many APIs, web interfaces, online data sheets, and portals to access data. We worried we would have to manually download all of these and then feed them to our agent to reason with. However, as soon as we gave Codex our plan, it automatically wrote scripts and began taking internet screenshots on its own, gathering the data for us. The tools, plugins, and sophisticated web browsing capability of ChatGPT with Codex meant our agent could autonomously acquire its own data.
Appendix: Science and Math Basis
Note: These methods largely come from Varon's 2018 paper (https://amt.copernicus.org/articles/11/5673/2018/). The paper clearly defines the mathematical framework for emission calculations. These have been around for decades, and our contribution was turning these defined calculations into tools our agent could use with real data to automate the entire process. A very high-level explanation is provided below:
1. Outlining the plume. For each pixel of NASA EMIT methane enhancement, the background is estimated from a ring 2.5–4 km around the plant.
2. From methane to mass. Each pixel's excess methane is converted to mass per area using the air density from observed pressure and temperature, then summed over the plume to give the integrated mass enhancement (IME):
3. From mass to leak rate (Varon et al., 2018). The plume's mass is divided by the time the wind takes to carry it across the plume's length scale:
4. How accurate is it? The statistical range is about ±30%. The main systematic uncertainty is that coefficients may be calibrated for a different instrument, not EMIT's 60 m pixels.
🪿 Thank you to all who showed interest in Save the North, and a huge congratulations to all hackers who submitted in time. We did it!
Built With
- codex
- css
- html
- huawei
- openai
- python
- sam2
- typescript


Log in or sign up for Devpost to join the conversation.