-
-
main page
Inspiration
I'm a casual racing fan and I've played a number of racing games, particularly Trackmania. Trackmania made me focus on how time can be gained in every single part of a track, so I wanted to bring this focus to actual race data.
What it does
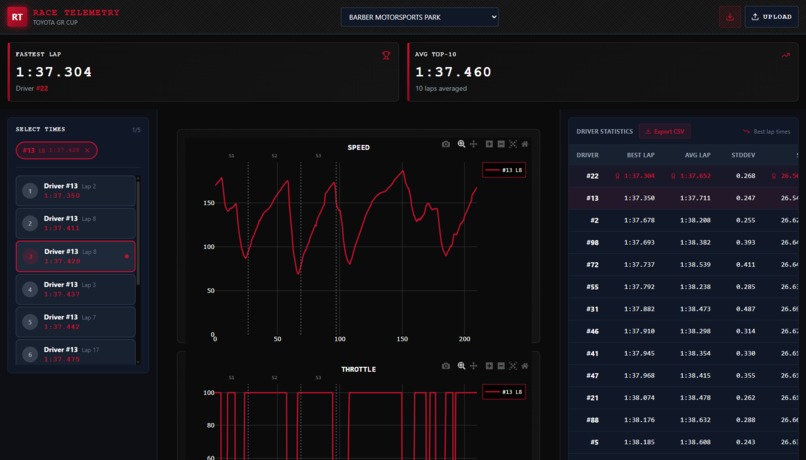
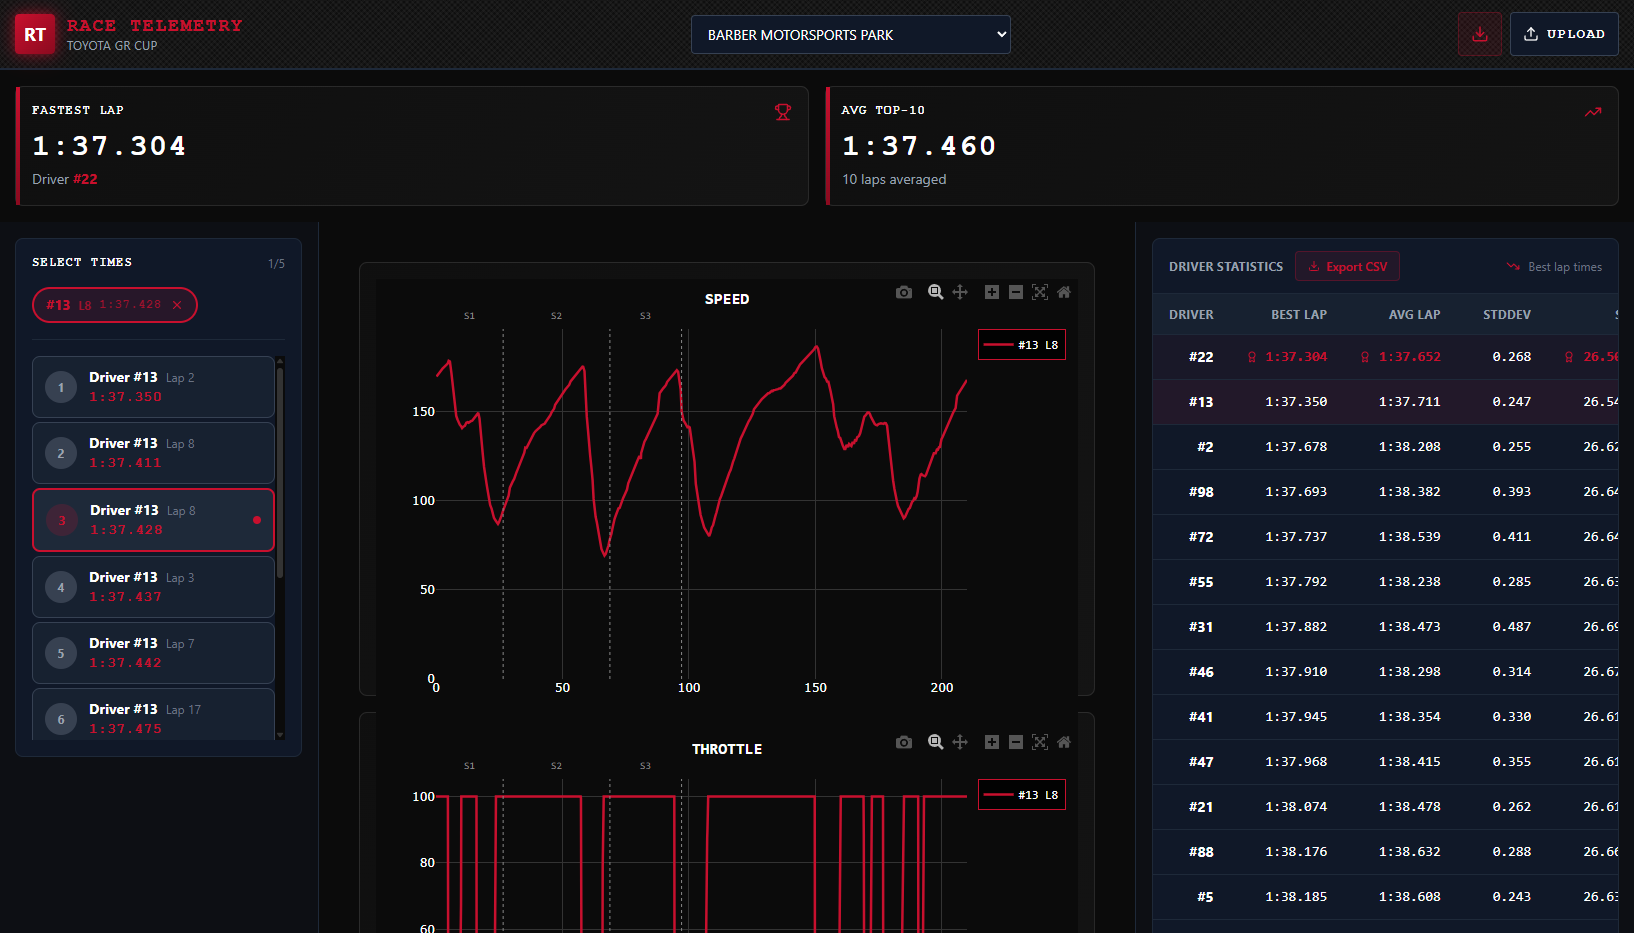
This project is hosted on a webpage. Its core features is the ability to compare multiple laps, including ones uploaded by the user. Lap times can be compared on graphs across speed, throttle, braking, steering, RPM, gear). These graphs are interactable, able to be zoomed and panned. The page even provides rudimentary analysis, comparing maximum and minimum speeds, as well as brake usage.
How we built it
Frontend: React, TypeScript, Tailwind CSS Visualization: plotly Data analysis: numpy, pandas Deployment: Vercel
Challenges we ran into
- The telemetry data was different across each track. For example, only Barber Motorsports Park had GPS coordinates.
- Timestamps were difficult to deal within telemetry data. It is stated within the notes that the time on the ECU is inaccurate, but it is more difficult to deal with the meta_time as multiple telemetry messages were recorded as to being received at the same time. Some meta_time messages were also received days after the race time, so I was left confused there.
- Many issues regarding laps, because the lap times reported on the telemetry files don't match with the lap times reported on the analysis files.
Accomplishments that we're proud of
- The page loads quickly even though there is around 42MB of files to load
- With more work done on this project, as well as better telemetry data, this may have actual impact on helping drivers find improvements in their driving
What we learned
- UX design
- weighing risks during the project
What's next for LapMetrics
- machine learning capabilities for more accurate places for improvement
- if available, tire degradation tracking
- live lap time predictions

Log in or sign up for Devpost to join the conversation.