Inspiration
Understanding crime patterns in Los Angeles is crucial for improving public safety and optimizing law enforcement resources. By visualizing these patterns, I aimed to gain insights into crime trends and identify areas that need attention.
What it does
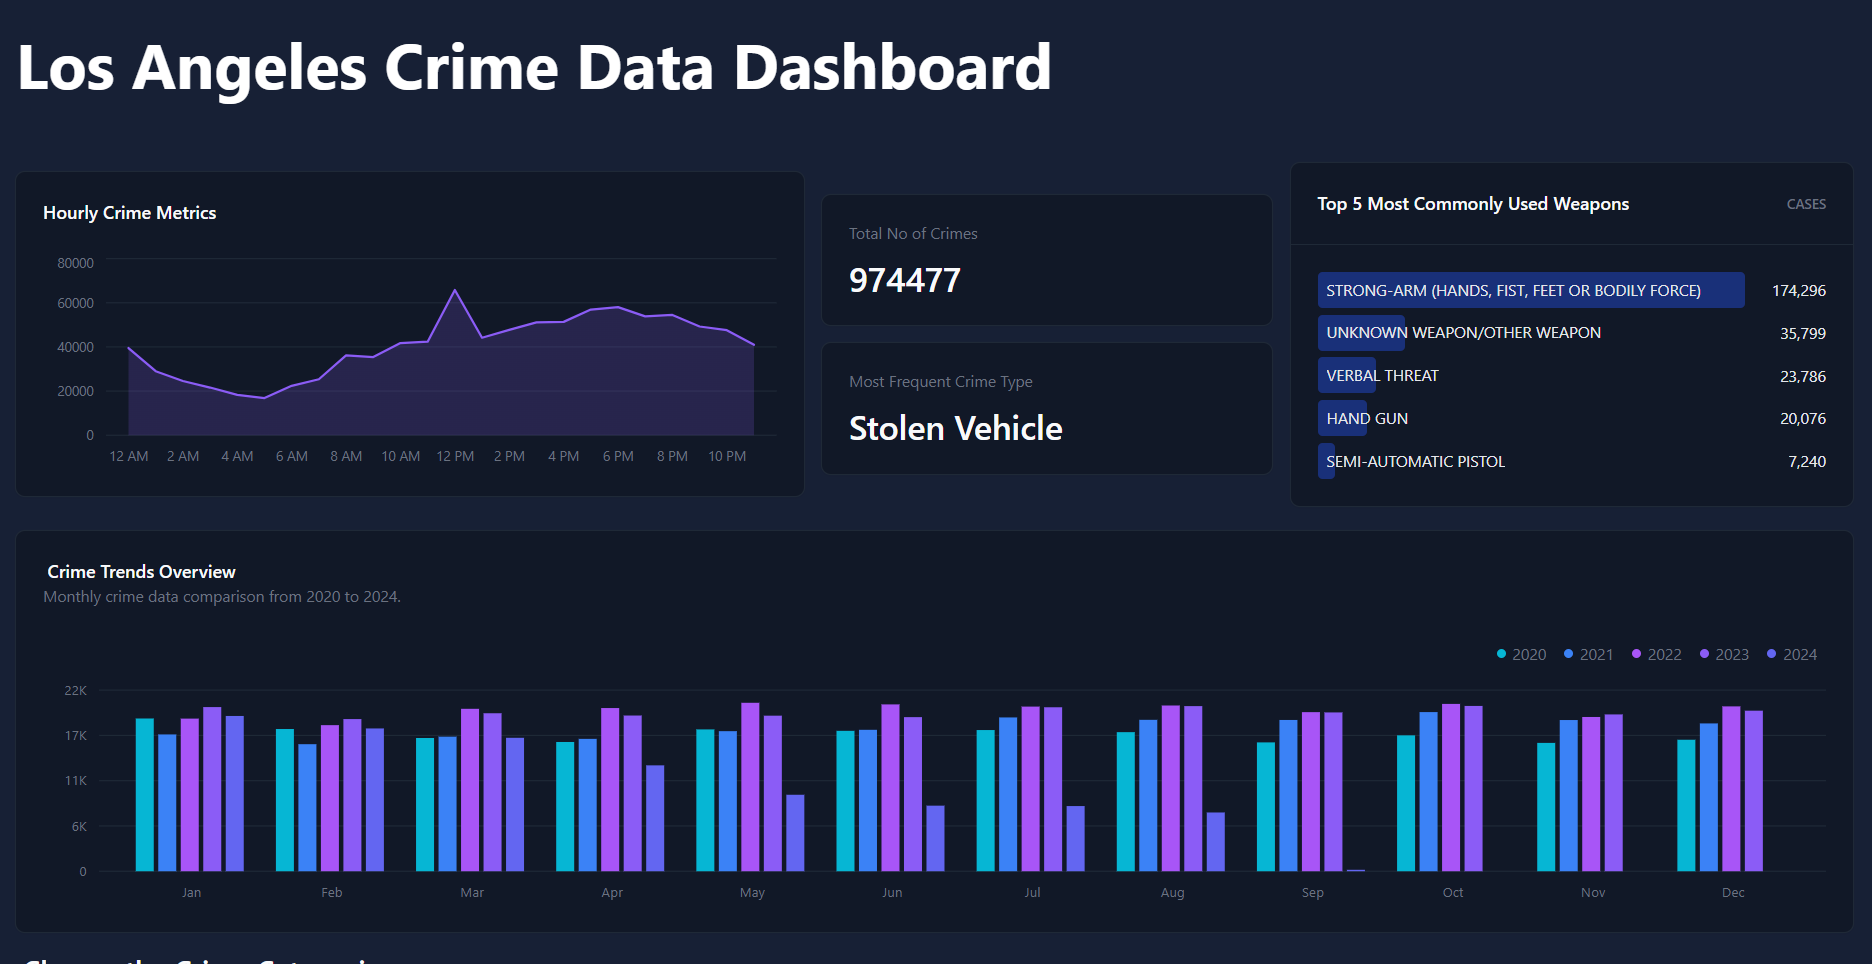
The LAPD Crime Dashboard provides an interactive visualization of crime data in Los Angeles. It allows me to explore crime trends over time, compare crime rates across different areas, and analyze the most common types of crimes and weapons used. The dashboard offers a user-friendly interface to make sense of complex data and uncover actionable insights.
How I built it
I built the LAPD Crime Dashboard using React for the frontend, leveraging a UI library to create visually appealing charts and dashboards. For handling large datasets, I used Google BigQuery to store and manage crime data sourced from official LAPD records. Google Cloud Functions were employed to create a responsive API for fetching and updating data. This setup ensures real-time data analysis and smooth user interactions.
Challenges I ran into
- Data Management: Handling large volumes of crime data and ensuring it was efficiently queried and updated in BigQuery.
- API Integration: Developing and maintaining a robust API with Google Cloud Functions to handle data requests and ensure performance.
- Visualization Complexity: Creating intuitive and interactive visualizations that accurately represent complex crime data.
Accomplishments that I'm proud of
- Successfully implemented a real-time crime data dashboard with dynamic charts and filters.
- Integrated large-scale data storage and querying capabilities with Google BigQuery.
- Developed a seamless API using Google Cloud Functions, improving data accessibility and interaction.
What I learned
- Effective data visualization techniques for representing complex datasets.
- How to integrate cloud-based data storage and serverless functions into a full-stack application.
- The importance of creating user-friendly interfaces for data exploration and analysis.


Log in or sign up for Devpost to join the conversation.